 MetaTrader 5
 专家
专家
 指标
指标
 程序库
程序库
 实用工具
实用工具
 窗口小部件
窗口小部件
 规则
规则
适用于MetaTrader 5的新EA交易和指标 - 523
 使用EA交易和指标,使外汇交易获得更多盈利。EA交易可使您自动开启和关闭交易,而指标将帮助您更准确地预测市场行为。
该页面提供MetaTrader 5应用程序的目录。
使用EA交易和指标,使外汇交易获得更多盈利。EA交易可使您自动开启和关闭交易,而指标将帮助您更准确地预测市场行为。
该页面提供MetaTrader 5应用程序的目录。 
The TimeFilter indicator allows visually selecting the bitmaks (GoodHourOfDay, BadHoursOfDay, GoodDayOfWeek, BadDaysOfWeek), which correspond to the Standard Library's Intraday Time Filter module for trading signals. Additionally, it is possible to enable and disable the trading intervals in a string form. It is also possible to use the trade volume multiplier when using the indicator as a part of an EA. String format: [week day]:[first hour]-[last hour]. See the screenshots and the video for us

Heiken Ashi Smoothed Strategy is a very simple but powerful system to get forex market trend direction. This indicator is actually 2 indicators in 1 pack, Heiken Ashi and Heiken Ashi Smoothed Moving Average both included. Because HA (Heiken Ashi) and HAS (Heiken Ashi Smoothed) are calculated in the same one system event with necessary buffers and loop only, so it is the FAST, OPTIMIZED and EFFICIENT HA having the combined indicator of MetaTrader 5. You can choose to display HA and HAS in the sam

This tool adds alerts to your Fibo Retracement and Fibo Expansion objects on the chart. It also features a handy menu to change Fibo settings easily and quickly! Please note the product is not working as a demo. Please watch the video.
Features Alert for Fibo Retracement and Fibo Expansion levels. Sound, Mobile and Email alert. Up to 15 Fibo Levels. Continuous sound alert every few seconds till a user clicks on the chart to turn it OFF. Single sound alert with pop-up window. Keeping all user se
The Envelopes indicator determines the presence of a trend or flat. It has 3 types of signals, shows the probable retracement levels and levels of the possible targets. The Fibonacci coefficients are used in the indicator's calculations. Signals (generated when touching the lines or rebounding from lines): Trend - the middle line of the Envelopes has a distinct inclination; the lines below the channel's middle line are used for buy trades, the lines above the middle line and the middle line

The main advantage of this indicator is filtering of buy and sell signals in the direction of the market impulse and ranking them by strength. Configuration of the indicator is simple and intuitive. All you need to do is to react only to strong signals. Adhere to the money management rules.
Description The Color Stochastic with an analytical panel indicator consists of the Stochastic indicator itself and the information/analytics panel. The indicator provides options for configuring the paramet
The Expert Advisor trades only Forex currencies on hedge accounts. The strategy depends on the selected trading mode. Trade mode - Weekly/Daily. This means that the trading cycle is limited by a week or a day. Lot size - fixed lot size. Set manually. The bar number of open positions - bar index from the start of the selected trading period for opening Limit or Stop orders. In case of Weekly mode, Н4 bars are considered. In case of Daily, Н1 bars are considered. The closing hour of trade - keep i
The balance of supply and demand is a simple and effective market analysis method. The supply and demand diagram can show you in advance, even before the trend reversal, where the supply ends and the demand is already emerging, where the demand ends and the supply is emerging, while substantially increasing the probability of making a deal in the right direction and with a high profit factor.
Indicator signals The indicator uses the price/volume values to generate signals: ED – excess demand. E
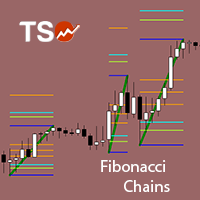
Fibonacci retracement is a method of technical analysis for determining support and resistance levels. The TSO Fibonacci Chains Indicator is different from a simple Fibonacci Retracements indicator in that it provides the targets for each retracement level. In other words, there is an Extension Level (D) for every Retracement Level (C). In addition, if an Extension Level is reached, then a new Fibonacci setup is created automatically. These consecutive Fibonacci setups create a chain that reveal
Advantage The analyzer provides an opportunity to examine correlation in history, for example, for the previous month excluding the current one, thus allowing you to evaluate symbol movement in history. It can be conveniently used in conjunction with the LineSyncMirrorCharts analyzer. Charts are synchronized by a market type: Forex, CFD, Futures, and Indices. The analyzer calculates the distance covered by the price on a specified period in points. The tool fits pairs and portfolio traders.
Des
The indicator looks for the "Fifth dimension" trade signals and marks them on the chart. A detailed description of the chart patterns that generate the trade signals can be found in Chapter 8 "The Balance Line Trades" in the book Williams' "New Trading Dimensions". Signal levels with indication of the position entry or stop loss placement price are indicated directly on the chart. This feature creates additional convenience for the trader when placing pending orders. A solid horizontal line is d
FREE

The script displays info about the share's corporate reports and dividends. The data is downloaded from investing.com : Report date Profit per share (EPS) Revenue Market capitalization Amount of dividends Date of payment of dividends Dividend income The product cannot be tested in the tester (since it is not possible to receive data from the Internet).
Before launching: Add 2 URL https://ru.investing.com/earnings-calendar/Service/getCalendarFilteredData and https://ru.investing.com/di

Monitoring: https://www.mql5.com/en/signals/author/yarkan
Features Does not use indicators Uses averaging with an increased lot Open prices only (an EA that explicitly controls bar opening) Trades Buy and Sell independently. In the EA parameters, you can set Buy, Sell or BuySell (for Hedge accounts)
Recommendations Leverage 1:500 Timeframe: M1 Rebate to refund part of spread or commission
Parameters Lots - lot increase parameter TargetProfit - target profit to close positions TargetLoss - los
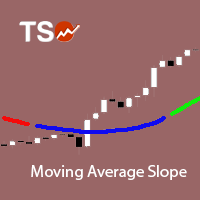
The Moving Average Slope (MAS) subtracts the moving average level n-periods ago from the current moving average level. This way, the trend of the moving average can be drawn on the moving average line.
Features Observe uptrends and downtrends at a glance. The indicator is non-repainting. Returns buffer values for the trend of the moving average to be used as part of an EA. (see below)
Inputs Moving Average Period : The period of the moving average (MA). Slope Period : Number of periods between
FREE
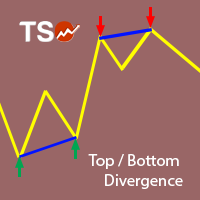
This indicator combines double bottom and double top reversal chart patterns together with RSI divergence detection.
Features Easily detect strong reversal signals. Allows to use double top/bottom and RSI divergence signals combined or independently. Get email and/or push notification alerts when a signal is detected. Custom colors can be used. The indicator is not repainting. Can easily be used in an EA. (see below)
Inputs ENABLE Double Top - Bottom: Enable the double top - bottom indicator.
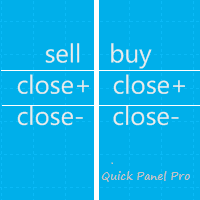
注: 这个EA只能在对冲类型的帐号上使用。MT4 版本: Quick Panel Pro 特性: 手数计算既简单又快,移动止损线StopLine时,手数就计算完了。 交易面板包含大多数交易操作(如多单全平,空单全平仓,平盈利单,平亏损单,等等),点击相应按钮就搞定。 六组面板之间切换也很方便,点击绿色按钮即可。 鼠标点击快速修改止损和止盈(不能用于复盘测试) 在一个黄色背景的面板上显示平均价格,以及画平均价格水平线。 点这里查看
面板解释: 面板包含两列,左列是与空单相关,右边则是与多单相关。 sell: 开一个空单 first: 平第一个空单,指的是开仓时间第一的那个空单 last:平最后的空单,指的是开仓时间最后的那个空单 all+: 平空单中的所有盈利的单子 all-: 平空单中的所有亏损的单子 max+: 平空单中盈利最大的那个单子 max-: 平空单中亏损最大的那个单子 min+: 平空单中盈利最小的那个单子 min-: 平空单中亏损最小的那个单子 All: 平所有空单 buy:开一个多单 first: 平第一个多单,指的是开仓时间第一的那个多单 last: 平最后的多单
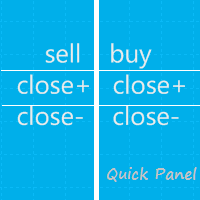
注: 这个EA只能在对冲类型的帐号上使用。MT4 版本: Quick Panel
这个面板是个EA,提供6组交易面板。 特性: 交易面板包含大多数交易操作(如多单全平,空单全平仓,平盈利单,平亏损单,等等),点击相应按钮就搞定。 六组面板之间切换也很方便,点击绿色按钮即可。 EA 可以在复查测试visual chart 图表上运行,这样复盘,交易训练等都很方便。 鼠标点击快速修改止损和止盈(不能用于复盘测试) 在一个黄色背景的面板上显示平均价格,以及画平均价格水平线。 点这里查看 面板解释: 面板包含两列,左列是与空单相关,右边则是与多单相关。 sell: 开一个空单 first: 平第一个空单,指的是开仓时间第一的那个空单 last:平最后的空单,指的是开仓时间最后的那个空单 all+: 平空单中的所有盈利的单子 all-: 平空单中的所有亏损的单子 max+: 平空单中盈利最大的那个单子 max-: 平空单中亏损最大的那个单子 min+: 平空单中盈利最小的那个单子 min-: 平空单中亏损最小的那个单子 All: 平所有空单
buy:开一个多单 first: 平第一个多单,

i-Orders is a simple indicator to monitor your own trade/analyze others' trades. I use it for a long time and do not imagine a chart without these arrows, lines and trade result numbers.
Features
disable display of opened and closed positions ( Show OPENED , Show CLOSED , Show PENDING ), change colors of arrows and lines for profitable and loss-making buy and sell positions separately ( Color for profitable/ losing BUYs/SELLs ), change style and width of the lines connecting deal open and
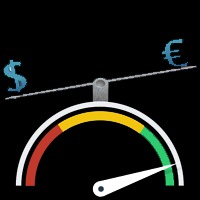
Strongest and Weakest Currency Analysis This product shows the strength of the main currencies in FOREX based on average pip gain/loss in different time-frames! Depending on the strength of the currency, the indicator colors changes from blue to red also the orders may also be changed, allowing you to find the strongest and weakest currency at a glance!
Advantages Whatever your trading method and strategy are, it is always important to choose the correct pairs, so this indicator will help you a
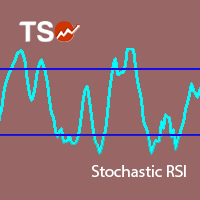
Stochastic RSI makes a stochastic calculation on the RSI indicator. The Relative Strength Index (RSI) is a well known momentum oscillator that measures the speed and change of price movements, developed by J. Welles Wilder.
Features Find overbought and oversold situations. Sound alert when overbought/oversold level is reached. Get email and/or push notification alerts when a signal is detected. The indicator is non-repainting. Returns buffer values for %K and %D to be used as part of an EA. (se
FREE
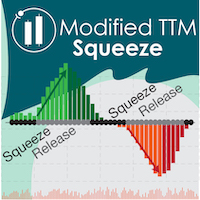
"The Squeeze indicator attempts to identify periods of consolidation in a market. In general the market is either in a period of quiet consolidation or vertical price discovery. By identifying these calm periods, we have a better opportunity of getting into trades with the potential for larger moves. Once a market enters into a "squeeze," we watch the overall market momentum to help forecast the market direction and await a release of market energy." The Modified TTM Squeeze Indicator is a modi
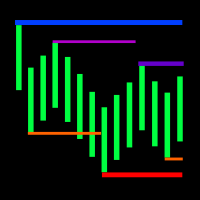
The indicator displays the fractal levels of one, two or three different higher timeframes starting beginning with the current one. When a new fractal appears, a new level is plotted. The indicator can be used for visual analysis of the current chart and applied in an EA. If more levels are needed, start a new instance of the indicator.
Features The indicator works on any timeframe and symbol. If a timeframe smaller than the current one is selected in the settings, the level of the current time

Telegram Publisher Agent 是一个附加组件,允许交易者实时向他们的 Telegram 频道和群组发送信号。通过可定制的消息、图表截图和其他功能,该工具可以帮助交易者与他们的追随者分享他们的交易见解和策略。该工具还具有亮暗主题切换的精美设计,为用户提供美观和功能性的交易体验。 Telegram Publisher Agent 旨在将您的所有交易作为信号发布在您的频道和群组中。您所要做的就是提供交易,然后 Telegram 发布商代理将为您完成所有繁重的工作,只需单击一个按钮即可将交易信号发送到您的交易渠道或群组。 电报发布代理 安装和输入指南 如果您想获得有关 EA 添加 URL ( http://autofxhub.com ) MT4/MT5 终端的通知(见屏幕截图)。 MT4版本 https://www.mql5.com/en/market/product/18985 MT5版本 https://www.mql5.com/en/market/product/23946
主要特点: 信号发送 - 将信号发送到用户的 Telegram 频道和组,带有可
Indicator of correlation and divergence of currency pairs - all pairs on one price chart. It shows all pair that are open in the terminal. Full synchronization of all charts. Does not work in the tester ! MT4 version
Advantages Traders who use multicurrency trading strategies can visually observe the price movement of selected pairs on a single price chart in order to compare the parameters of their movement. This is an advanced and extended version of the OverLay Chart indicator It is quite ef
Automatic calculation of lot size based on the StopLoss level: it calculates the lot with consideration of the risk percentage. Enter the deposit percentage and set the line to the planned StopLoss level. The lot size for the entry will be output as a result. The TakeProfit will also be calculated with taking into account the profit/loss ratio, and their profit/loss in the deposit currency. Thus, the end result of the trade can be seen immediately, which is an integral part of successful trading
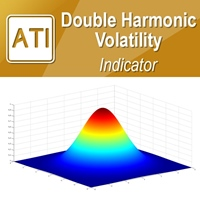
Introduction to Double Harmonic Volatility Indicator Use of the Fibonacci analysis for financial trading can nearly go back to 85 years from today since the birth of Elliott Wave Theory by R. N. Elliott. Until now, traders use the Fibonacci analysis to identify the patterns in the price series. Yet, we could not find any one attempted to use Fibonacci analysis for the Volatility. Harmonic Volatility Indicator was the first technical analysis applying the Fibonacci analysis to the financial Volat
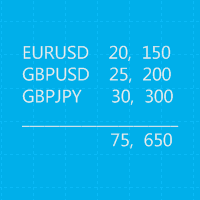
这是一个MT5的脚本,帮助把交易记录按照品种分类统计。 参数 Select Period: 这是7个选项的参数,分别是上个月,本月,上周,本周,今天,指定日期。 Specify Starting Date: 输入一个起始日期,如果上面参数你选择的是指定日期的话。 Specify Ending Date: 输入一个截止日期,如果上面参数你选择的是指定日期的话。 如果参数Select Period 选择的不是 指定日期,那么后面的两个参数就不用填写了。 脚本会有一个文件输出结果,文件保存在MQL5\Files文件夹中。 希望对你有帮助,真心希望对你有帮助,我觉得会有帮助。 必须满足300个字,我必须说些废话,好了好了,希望对你有帮助。 MT4 Version: https://www.mql5.com/zh/market/product/23802
FREE

你是否厌倦了拥有许多公开图表和观看许多不同的货币对?strongcurrency将监控所有货币对的优势,你不需要太多思考,就给你最好的货币对. StrongCurrency是基于各种技术指标,移动平均线和枢轴的完整交易系统。这些元素中的每一个都可以通过定义的规则和系数进行评估(取决于指标),为StrongCurrency提供了无限优化的方案。StrongCurrency通过评估数据创建一个趋势强度和入场信号列表显示,它显示所有货币对的数据。根据每个货币对趋势强弱获得入场信号。列表数据包括Symbol,BuyPercent,SellPercent,LastBuySignal,LastSellSignal。其中LastBuySignal和LastSellSignal内容显示入场价格,时间,货币对趋势百分比。趋势强度大于70%时,认为是强货币对;该工具适用于外汇市场,指数,金属的数据... 该工具仅在一个图表任意周期上运行,它对于多货币交易者非常有吸引力的,其简化的信息(LastBuySignal和LastSellSignal)可以提供出色的输入信号。帮助您快速,识别强弱货币对。请参见截图
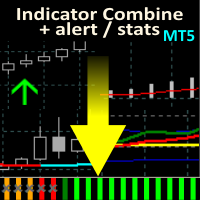
Allows multiple indicators to be combined into a single indicator, both visually and in terms of an alert. Indicators can include standard indicators, e.g. RSI, CCI, etc., and also Custom Indicators, even those purchased through Market, or where just have the ex4 file. An early alert is provided, say when 4 out 5 indicators have lined up, and a confirmed alert when all are in agreement. Also features a statistics panel reporting the success of the combined indicator by examining the current cha
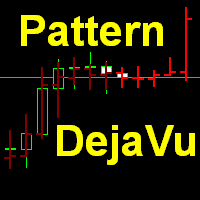
This indicator predicts the nearest bars of the chart based on the search of up to three best coincided patterns (a sequence of bars of a given length) in the history of the current instrument of the current timeframe. The found patterns are aligned with the current pattern at the opening price of the current (last) bar. The predicted bars are bars following immediately for patterns found in history. Pattern search is performed once every time a new bar of the current timeframe opens. The i

The script allows selecting the required 'Filter level' value of the AIS-MTF MT5 indicator. Run the script on the required chart and selected timeframe. Once its operation is complete, the HPS.csv file will be created in the Files folder. Open the file. You will see three columns. The 'Filter lvl' column represents the value of the 'Filter level' for the AIS-MTF indicator. Am. dev. - degree and direction of the indicator's deviation from the price level (sorted in ascending order). Negative valu
FREE
This is a further development of the Expert Advisor based on the two moving averages https://www.mql5.com/en/market/product/1693 . The EA implements a self-training mode allowing it to immediately start trading. However, it is also possible to conduct a preliminary EA training for more efficient trading. By default, the EA is configured to work on EURUSD H1. The robot is based on the modified probabilistic neural network. Initially, the neural network does not contain neurons. In this mode, the

This indicator studies the price action as a combination of micro-trends. All micro-trends are analyzed and averaged. Price movement is filtered based on this averaging. IP_High and IP_Low (blue and red dashed lines) show the instantaneous price movement. They display the forecast only for the current price values, taking into account only the number of bars defined by the 'Filter level' parameter. SP_High and SP_Low (blue and red solid lines) smooth the price movements with respect to history.
This indicator allows you to measure the profitability of each specific transaction (the ratio of Stop and Profit). The indicator allows you to adjust the ratio by step size and number of steps. You can build an unlimited number of ratios to compare the risks from different movements.
Note: the MT5 tester is not designed for full-fledged work with graphic objects, so drawing in the tester is slower than in the real situation. The ratio selection is performed with 1 mouse click.
Building a line
Peak Trough Analysis is the great tool to detect peaks and troughs in your chart. Peak Trough Analysis tool can use three different peaks and troughs detection algorithm. The three algorithm include the orignal Fractals Indicator by Bill Williams, the Modified Fractals indicator and ZigZag indicator. You can use this peak and trough analysis tool to detect the price pattern made up from Equilibrium Fractal-Wave process. For further usage, there are good guide line on how to use this peak trough
FREE

Trading signals are obtained through three stochastic indicators and a method for avoiding bad entries. Among its characteristics are: Trading Pannel with buttons BUY - SELL - CLOSE Money management that calculates the volume of orders based on the percentage of the total balance Automatic operation mode or manual mode where the EA only draw signal Designed to optimize fast only with opening prices Doesn't use martingale
Inputs Automatic Entry: On / Off. STCH 1º Kperiod : K period for the first

The Trend Sight indicator shows the Moving Average's percent change from the current bar to the other selected bar allowing you to track the smoothed price change rate, as well as trend strength and change. The uptrend is shown as a blue indicator line, while a downtrend is displayed in red. Close a short position and open a long one if the line color changes from red to blue. Close a long position and open a short one if the line color changes from blue to red. You should use a tight stop loss,

它有助于计算每笔交易的风险,容易安装新的订单,具有部分关闭功能的订单管理, 7 种类型的追踪止损和其他有用的功能。 附加材料和说明 安装说明 - 应用程序说明 - 模拟账户应用程序的试用版
线条功能 - 在图表上显示开仓线、止损线、止盈线。 有了这个功能,就可以很容易地设置一个新的订单,并在开仓前看到它的附加特性。 风险管理 - 风险计算功能在考虑到设定的风险和止损单的大小的情况下,计算新订单的成交量。它允许你设置任何大小的止损,同时观察设定的风险。 批量计算按钮 - 启用 / 禁用风险计算。 在 " 风险 " 一栏中设置必要的风险值,从 0 到 100 的百分比或存款的货币。 在 " 设置 " 选项卡上选择风险计算的变量: $ 货币, % 余额, % 资产, % 自由保证金, % 自定义, %AB 前一天, %AB 前一周, %AB 前一个月。 R/TP 和 R/SL - 设置止盈和止损的关系。 这允许你设置相对于损失的利润大小。 例如, 1 : 1 - 这决定了 TP = SL 的大小。 2 : 1 - 这意味着 TP 是 SL 的两倍。 RR -

The Candle Timer indicator displays an advanced bar countdown timer on a chart. This study indicates the remaining time for the last candle in the chart.
Main features The indicator shows the remaining time for the last bar in the chart. Alert notifications for new bar. Works on every timeframe (M1, M5, M15, M30, H1, H4, D1, W1, MN). Customizable parameters (Colors, Text size, Visibility...). Ideal tool for all kinds of trading (Scalpers, intraday traders...). Very fast calculation. Availa
FREE

The Grid Trader Expert Advisor is a very special algorithm that allows traders to benefit from sideways markets. It trades long and short sides separately and creates two different grids according to its setting. Each side has its account and virtual take profit, determined in money. EA also uses virtual stop loss based on the account's percentage amount. Traders can work with a classic grid where the distance between orders is fixed or choose a more "adaptive" dynamic grid with ATR-based dista

You can change all assets to your Market or Forex. Just replace the assets in the groups above! No asset limits! TradeLeader B3/Bovespa Scanner is an indicator that allows you to observe the entire market heat map in a single chart. More images in high definition in https://www.mql5.com/pt/users/ougaske/blog Track all the assets of the stock market separated by liquidity groups. Customize the alert level for opportunities. Display in real time the Ibovespa, minicontracts of Index and Dollar or

The Effort and Result indicator is based on the work of Karthik Marar; a volume spread analysis trader. It compares a price change (Result) to the volume size (Effort) for a certain period. By comparing the effort and result, we can get more information about the future price movement. Both values are normalized and converted to a scale of 0 - 100 % based on a selectable look-back period.
This indicator is also known as the Effort Index.
The law of effort and result The law of effort vs. res
The indicator allows you to quickly switch from one instrument to another, from one time period to another using the keyboard or buttons on the monitor. Each command can be assigned a hot key from 0-9, a-Z (case-insensitive) and VK_OEM_COMMA ("<" on the keyboard) and VK_OEM_PERIOD (">" on the keyboard). This can help you to operate the maximum number of instruments that are available at your broker, analyze more instruments/periods in less time. This product cannot be tested in the tester , beca

VR Alert是一种以指标形式制作的实用程序,旨在监控价格或其他指标,以告知交易者价格或指标达到给定水平。信号电平不仅可以水平设置,还可以以一定角度设置。因此,交易者有机会接收来自倾斜趋势水平的通知。 由于VR Alert实用程序,您将不再需要坐在显示器附近很长时间。你可以放心地做你的家务,履行工作职责,花时间与你的家人。你的任务是简单地设置水平,并选择通知的四种方法之一。该实用程序能够向智能手机发送警报,电子邮件,显示标准警报窗口和声音,并将图表绘制为红色。该实用程序的所有管理都是用图表上的鼠标完成的。 在启动时,该实用程序扫描图表是否存在其他指标。那些在图表上有可见部分的指标属于VR Alert的监督。
所有可以跟踪的指标都有自己的控制面板。
如果指示器没有可见部分或没有呈现的缓冲区,则将指示器从观察中排除。 建议: 配置终端发送推送消息到您的智能手机,说明在博客中。 配置终端向邮件发送邮件,博客中的说明。 只需用鼠标将指标从导航器拖动到图表。您将看到连接到图表的所有指标的名称以及用于设置级别和启用警报的面板。 选择要显示的行所需的向上或向下级别,然后选择通知方法。 当价格或指标

This simple indicator helps defining the most probable trend direction, its duration and intensity, as well as estimate the possible range of price fluctuations. You can see at a glance, at which direction the price is moving, how long the trend lasts and how powerful it is. All this makes the indicator an easy-to-use trend trading system both for novice and experienced traders.
Parameters Period - averaging period for the indicator calculation. Deviation - indicator deviation. Lag - calculatio

A combination of trend, pullback, range breakouts and statistics in one indicator Mainly functions as an Entry indicator. Works in any pair and timeframe.
Suggested Combination Cluster Helix with Strength Meter Strategy: Confirm signals with ideal strength levels Watch Video: (Click Here)
Features Detects range breakouts on pullback zones in the direction of the trend Analyzes statistics of maximum profits and calculates possible targets for the next signal Flexible tool, can be used in many w
Trading patterns on Forex is considered to be the highest level of trading, since it usually requires years of mastering various patterns (shapes and candle combinations) and the ways they affect the price. Patterns are different combinations of Japanese candles on a chart, shapes of classical technical analysis, as well as any regularities of the market behavior repeating many times under the same conditions. After the patterns appear on a chart, the price starts behaving in a certain way allow

"The Niffler is a fluffy, black and long-snouted beast. This burrowing creature has a predilection for anything glittery. Nifflers are often kept by goblins to burrow deep into the earth for treasure." Newt Scamander, "Fantastic Beasts and Where to Find Them". Niffler is a multicurrency trend trading Expert Advisor based on moving averages. A classic seasoned with the magic of modern technology. Niffler uses SMA, EMA, LMA, SWMA, HMA, AMA, TMA, EPMA and RMA on the timeframes M15, M20, H1, H3, H6
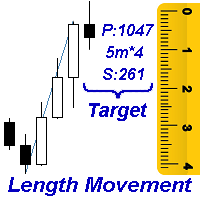
Measures the length of the selected movement in points, shows the duration of the movement, as well as the speed of movement. Outputs the average value of each dimension.
It is designed to calculate the expected target based on typical market movements.
The intended goal will provide information about the ratio of the stop size to the possible profit and will allow you not to open positions with a small expected profit.
It will also help you determine the point at which it is more logical to c

Shows whether market is trending or not, to what extent, which direction, and if the trend is increasing. The indicator is very useful for trend following strategies, where it can filter out flat/choppy markets. The indicator can also alert when the market transitions from being flat to trending, which can serve as a great trade entry point. The alert is controllable directly from the chart, via a tick box. Also, the product includes bonus indicators of the current spread and ask/bid prices in l
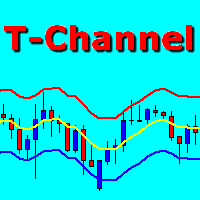
T-Channel is a technical indicator defining the current Forex market status - trend or flat. The indicator is based on TEMA (Triple Exponential Moving Average). The advantage of the TEMA is that it provides a smaller delay than a moving average with a single or double smoothing. The indicator is able to work on any timeframes, but H1 and higher timeframes are recommended to minimize false signals. The indicator displays a channel as lines located above and below the middle line. The upper and lo

The TEMA Trend indicator is based on two TEMA (Triple Exponential Moving Average) - fast and slow. The advantage of the TEMA is that it provides a smaller delay than a moving average with a single or double smoothing. The indicator allows determining the direction and strength of the trend, and it can work on any timeframe. Uptrends are shown by blue color of the indicator line, downtrends by the red color. Close a short position and open a long one if the line color changes from red to blue. Cl

结合交易环境的突破信号 ACB Breakout Arrows 识别价格进入平稳阶段后出现的方向性突破,并用买入或卖出箭头标记该形态。箭头代表检测到的突破形态,并不保证每个信号都会发展成大幅行情。 买入箭头表示看涨突破形态,卖出箭头表示看跌突破形态。价格可能回测突破区域,也可能重新回到原有区间,因此入场前应检查周围的市场结构、趋势方向以及附近的支撑或阻力。 在图表上规划交易 指标可以围绕每个信号绘制实用的参考价位: Stop Loss: 根据所选 K 线数量计算的保护价位。 Quick Profit: 较近的目标,可用于提前离场、部分止盈或决定是否移动到保本位置。 Take Profit: 为选择继续持有突破行情的交易者提供更远的目标价位。 这些价位有助于建立一致的交易计划,但仓位大小和最终的交易管理仍由交易者负责。 确认突破 多周期面板可帮助您比较不同可用图表周期上的突破信号。如需更多背景信息,可以使用 ACB Trade Filter 检查市场情绪和趋势方向。绿色配合看涨趋势支持多头形态,红色配合看跌趋势支持空头形态,灰色配合横盘趋势则表示市场条件混合。 您还可以检查买入信号是否直
Kerry Lovvorn 建议将平均真实波幅 (ATR) 通道添加到力量指数中。 添加这些通道使力量指数成为识别中间顶部和底部的出色工具。 带有 ATR 通道的强力指数并不能捕捉所有的变化,但它所识别的那些值得非常认真的关注。
注意: 平均真实波动范围中的“真实”一词是指处理价格差距。 由于力量指数没有缺口,这里的 ATR 与平均范围相同。
每当强力指数高于或低于其 3-ATR 通道时,就表明股票行情已达到不可持续的极端区域。 这就是涨势和跌势耗尽、价格趋向反转的地方。 这是在调用顶部和底部区域方面同样有效的极少数工具之一。 当力量指数的 EMA 升至 3-ATR 通道上方时,Elder-disk 在图上方放置一个红色箭头。 当 EMA 跌至 3-ATR 通道下方时,它会在图下方放置一个红色箭头。
根据我们的经验,这些信号在周线图上尤其有效。 当然,欢迎用户在任何时间范围内进行试验。
参数是 力量指数周期 (13) – 原始力量指数 MA 的长度 Force Index MA 模式(指数)——Force Index 的移动平均模式 力指数成交量类型(刻度)- 应用力指数
Object Synchronizer MT5 : Better focus/analysis of the price chart in many timeframes. Are you bored to save and load template many times for the same symbol for many chart timeframes? Here is the alternative. With this indicator, you enjoy creating objects across many charts, you can modify the same object in any chart, you can delete the same object in any chart. All objects you created/modified are always synchronized across all chart windows (with the same symbol). Save your time, you can fo

FFx Patterns Alerter gives trade suggestions with Entry, Target 1, Target 2 and StopLoss .... for any of the selected patterns (PinBar, Engulfing, InsideBar, OutsideBar) Below are the different options available: Multiple instances can be applied on the same chart to monitor different patterns Entry suggestion - pips to be added over the break for the entry 3 different options to calculate the SL - by pips, by ATR multiplier or at the pattern High/Low 3 different options to calculate the 2 TPs -
This indicator detects IDRN4 and IDNR7 two powerful patterns on 28 pairs on new daily bar. IDNR4 is the acronym for "Inside Day Narrow Range 4" where "Inside Day" is a lower high and higher low than the previous bar and "Narrow Range 4" is a bar with the narrowest range out of the last 4 bars so "Narrow Range 7" out of the last 7 bars. Hence, ID/NR4 and better ID/NR7 are an objective criterion for identifying days of decreased range and volatility. Once we find an ID/NR4 or an ID/NR7 pattern, we
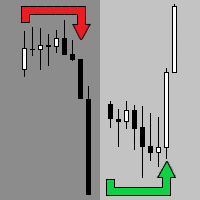
The indicator shows the market turning points (entry points).
Reversals allow you to track rebound/breakout/testing from the reverse side of the lines of graphical analysis or indicators.
Reversals can be an independent signal. The indicator allows you to determine reversals taking into account the trend and without it. You can choose a different period for the movement preceding the reversal, as well as the volatility coefficient. When plotting reversals, the indicator takes into account volati

The Basket expert advisor can open up to 10 trades at once. It was developed for basket traders who need to open a lot of trades on many different pairs. Expert advisor allows to set a take profit and stop loss as a value in money for each basket trade. This EA is also equipped with hedge functions and allows traders to use the Classic hedge strategy or Sure-Fire strategy, also known as "Always in profit".
Main features Opening multiple trades simultaneously EA Works on any market (forex,

The operation of this Expert Advisor is primarily designed to eliminate unprofitable positions according to Martingale with recalculation of the lot depending on the market situation. The EA uses Moving Averages with different periods to determine the trend strength and the moment for opening a deal, as well as RSI to avoid opening deals at the peak of a trend. The lot calculation is performed automatically depending on the current deposit. The deals are closed at different values depending on t

The Neurolite Expert Advisor offers trade decisions based on a neural network trained on 5-years of real tick data. Trading is performed only on the EUR/USD currency pair. Its main peculiarity is a small amount of input parameters so as to facilitate the working process of users. The Neurolite EA will fine-tune all the parameters for you. This Expert Advisor is based on the previously released Neurolite EA gbpusd , which was adjusted for successful trading on the EUR/USD currency pair.
Trading

The OHLC indicator shows the current and historical values of High, Low, Open, Close and Mid for a specific time period. It can plot the current values or the values from the previous session. The indicator's range can be calculated from a daily, weekly, monthly, or user-specified session.
Levels High of the current or previous session. Low of the current or previous session. Open of current or previous session. Close of the current or previous session. Midpoint of the current or prev
FREE

The Trading Sessions indicator is a simple tool that helps to highlight a specific trading session. For example, it can be used to differentiate the European, American or Asian sessions.
Main features The indicator shows a user-defined trading session. Alert notifications for the start and end of the session. Custom session time. Works on every timeframe (M1, M5, M15, M30, H1, H4, D1, W1, MN). Customizable parameters (Colors, alerts...). It can be used for creating EA. Available for MT4 an
FREE

The indicator is based on the analysis of interaction of two filters. The first filter is the popular Moving Average. It helps to identify linear price movements and to smooth minor price fluctuations. The second filter is the Sliding Median. It is a non-linear filter. It allows to filter out noise and single spikes in the price movement. A predictive filter implemented in this indicator is based on the difference between these filters. The indicator is trained during operation and is therefore

Price Reversion Indicator based on MA shows trend reversals. The indicator algorithm provides highly reliable entry points, and its simple settings allow using it for any symbol and trading style. Signals are generated at the opening of a bar and are not redrawn. Prima analyzes the relative movement of two moving averages (fast and slow) with respect to the price, and determines the moments when the next movement will cause the reversal of the two MAs with a high probability. These points are ma

This script allows performing a walk-forward analysis of trading experts based on the data collected by the WalkForwardLight MT5 library. The script builds a cluster walk forward report and rolling walk forward reports that refine it, in the form of a single HTML page. This script is optional, as the library automatically generates the report immediate after the optimization in the tester is complete. However, the script is convenient because it allows using the same collected data to rebuild th
FREE

The FFx Watcher PRO is a dashboard displaying on a single chart the current direction of up to 15 standard indicators and up to 21 timeframes. It has 2 different modes: Watcher mode: Multi Indicators User is able to select up to 15 indicators to be displayed User is able to select up to 21 timeframes to be displayed Watcher mode: Multi Pairs User is able to select any number of pairs/symbols User is able to select up to 21 timeframes to be displayed This mode uses one of the standard indicators
This is a simplified and effective version of the library for walk forward analysis of trading experts. It collects data about the expert's trade during the optimization process in the MetaTrader tester and stores them in intermediate files in the "MQL5\Files" directory. Then it uses these files to automatically build a cluster walk forward report and rolling walk forward reports that refine it (all of them in one HTML file). Using the WalkForwardBuilder MT5 auxiliary script allows building othe
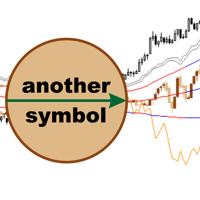
AnotherSymbol displays the relative movement of another symbol on the current chart as candlesticks, High/Low or Close lines. The plotted chart is aligned to the selected Moving Average and scaled by the standard deviation. When sing this data representation the trader should focus not on the absolute values, but on the behavior of the price relative to the Bollinger bands. Another Symbol provides additional opportunities in the pair strategies and cross rates trading.
Main Parameters SYMBOL -

对任何新手或专家交易者来说都是最好的解决方案!
这个指标是一个独特的、高质量的、负担得起的交易工具,因为我们已经纳入了一些专有的功能和一个秘密的公式。只需一张图表,它就能给出所有28种货币对的警报。想象一下,你的交易将如何改善,因为你能够准确地确定新趋势或剥头皮机会的触发点
建立在新的基础算法上,它使识别和确认潜在交易变得更加容易。这是因为它以图形方式显示了一种货币的强势或弱势是否正在加速,并测量了这种加速的速度--把它想象成你汽车中的速度表。当你加速时,事情显然会发生得更快,这在外汇市场上也是一样的,即如果你配对的货币正在向相反的方向加速,你就会发现一个潜在的有利可图的交易。
货币动量的垂直线和箭头将指导你的交易! 动态的市场斐波那契23水平被用作警报触发器,将适应市场活动。如果冲动触及黄色触发线,您将在MetaTrader或您的电子邮件或推送警报中收到警报。然后你就知道作为一个交易员应该做什么。货币对和方向已经给出。只要点击警报按钮,就可以切换到该货币对或打开一个新的图表,以便进一步分析。警报级别可以通过用户输入来改变,可以选择3个敏感度级别。
尽早获得新趋势的初始化触发

WalkForwardOptimizer library allows you to perform rolling and cluster walk-forward optimization of expert advisers (EA) in MetaTrader 5. To use the library include its header file WalkForwardOptimizer.mqh into your EA source code, add call provided functions as appropriate. Once the library is embedded into EA, you may start optimization according to the procedure described in the User guide . When it's finished, intermediate results are saved into a CSV file and some special global variables.
学习如何在MetaTrader AppStore上购买EA交易,MetaTrader平台的应用程序商店。
MQL5.community支付系统支持通过PayPay、银行卡和热门付款系统进行交易。为更好的客户体验我们强烈建议您在购买前测试EA交易。
