 MetaTrader 5
 专家
 指标
 程序库
 实用工具
 窗口小部件
 规则
适用于MetaTrader 5的新EA交易和指标 - 516
 使用EA交易和指标,使外汇交易获得更多盈利。EA交易可使您自动开启和关闭交易,而指标将帮助您更准确地预测市场行为。
该页面提供MetaTrader 5应用程序的目录。

Investment Castle Engulfing — Never Miss an Engulfing Candle
Whether you scalp or trade the daily, bullish and bearish engulfing candles are some of the most reliable signals — but spotting them across timeframes is tedious and easy to miss. This indicator finds them for you, including an engulfing candle forming on a higher timeframe while you trade a lower one.
What it does for you Automatic engulfing detection: bullish and bearish engulfing candles are flagged for you. Multi-timeframe aware
FREE
The Expert Advisor trades in the direction of the current trend, the algorithm is based on calculating the width of the trading range for a given interval and assessing price movements on short time intervals. If the impulse value exceeds a specified percentage of the trading range, a position is opened in the direction of the trend. The impulses are also additionally filtered using a special technique. When evaluating impulses, the tick history inside the bar is not used . The algorithm uses ex

Phenomenon is a new generation Expert Advisor that has incorporated the best automated trading developments of recent years. Designed for trading major currency pairs, it has protection against failures - when the connection is restored, the advisor will continue to work with its orders. Fully automated Expert Advisor. The robot controls the volume of trading positions, slippage, spread, maintains and protects open orders, can work with a deposit of any size. The Expert Advisor uses a number of
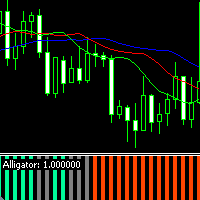
The modified Alligator indicator is designed as an oscillator. Facilitates the analysis of the Alligator indicator values by signaling the trader about market changes using a colored histogram. Histogram color values
Medium Spring Green - uptrend Orange Red - downtrend Gray - lateral movement (flat) Parameter values jaw_period - jaw period teeth_period - teeth period lips_period - lips period jaw_shift - jaw shift teeth_shift - teeth shift lips_shift - lips shift ma_method - method for calculat

The Expert Advisor analyzes tick micro-signals and determines the direction to open a position. Note: The EA can only be optimized and tested on all ticks! Be sure to optimize, the limits for optimization are shown in the screenshot. The EA uses netting system of position accounting (one symbol can have only one position). The EA does not work with independent position accounting (hedging, when there can be multiple positions per symbol). Account without hedging should be selected for testing o
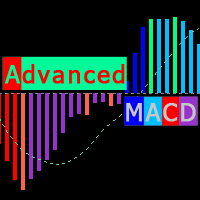
Modified MACD, for technical analysis of charts, with color backlight of histogram signals. The indicator highlights, the direction of the histogram movement, the change in the direction of the histogram movement, the histogram peaks, the interaction of the histogram and the signal curve. Also, the indicator makes it easier to find convergences / divergences between bars and the histogram (which serve as a powerful signal in some trading systems using the MACD indicator). Color designation of Ad

Clear Dom
This Indicator shows a pressure color box based on depth of market of the current symbol. Notice that it only works when book information is received.
You decide weather you want or not to display higher (ask) and lower (bid) levels of book.
The proportion ratio is calculated using volumes read from the book. You can read the actual pressure in the market any time.
Indicator parameters: color_Ask -> ASK box color and ASK value line color color_Bid -> BID box color and BID value li

Hello, boys and girls!
Script allows you either to quickly save opened charts and then close all charts opened by visual tester mode or just faster close all charts. Feel free to take a look at video manual about how to use this script on my YouTube channel. Also, feel free to join my telegram channel , where time to time I publish some exclusive stuffs. Feel free to leave feedback and thoughts how to improve this script - I'd highly appreciate that. All the best.

This indicator shows supports and resistences calculated form historical data when market was swing. When market was swing ? When ADX was below 25 for some bars. In fact market can be considered without a trend. I mean and suggest timeframes H4 and Daily. Using that lines in the present you see resistance and support. More lines are distant and best is possible profit. Every ADX parameters can be set, so colors, swing market bars number.
I am available to get feedback or modify code. Thanks Ale

If you use several charts open at the same time, you know how boring it is to apply formats to each chart individually. This script can change all open charts using a single command. Parameters: 1 - Choose symbol to put on charts: apply the selected symbol to all charts. If "current", it does not change the symbol; 2 - Choose timeframe or leave empty: apply the selected timeframe to all charts. If "CURRENT", it does not change the timeframe; 3 - Apply template to the charts: If true, apply the t
FREE

Join Deriv link on profile>>>
This is new Robot which created by Moving Average... There is things to Consider before you buy or rent this Robot, I listed down here so that you can read before you purchase this Robot 1; Not perfect 100% because you can make the huge profit but sometimes you can make a little loss i can say Profit 70% and losses 30%. 2; Use setup which provided by developer not otherwise. 3;Use lower timeframe, 1,5 Minute recommended. 4;You can deposit $50 and above. 5;Backte

Dear friend, I'm glad you're interested in the results of my work and you want to understand how to use this tool better. Here I will try to explain in detail and clearly what works and how to do to set everything up, as well as to get pleasure and profit from the results of my labors. If you liked it, I'll be really happy to see the positive feedback on the Market:)
Currency pairs: EURUSD, GBPUSD - they are the main ones and give good profits right now! (USDJPY, USDCHF, AUDUSD, USDCAD on req
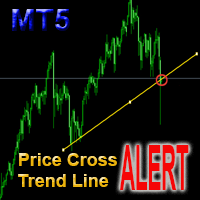
This is a support tool that will notify you when the price crosses a trend line, you can draw any trend line by manual, and you can change or drag it on chart in working time This tool will automatically update the new location of the trend line to alert you How to use: after added it on chart, you will draw a trend line and set name of the trend line same as in input of the tool (the parameter LineName ) There are 3 notification methods : Pop Up Alert, Send Email or Notification You can choose
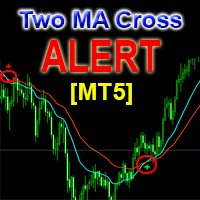
This is a support tool that will notify you when a fast MA (Moving Average) Line crosses a slow MA Line, you can choose any fast MA Line and slow MA Line by parameters in input tab The Indicator will draw a red arrow where fast MA line crosses DOWN slow MA line and it will draw a green arrow where fast MA line crosses UP slow MA line There are 3 Alert methods : Pop Up Alert, Send Email or Notification You can choose true or false to use or not for any Alert method in input tab You can choose Al
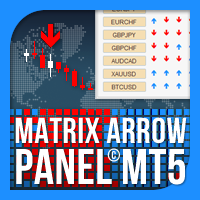
Matrix Arrow Indicator Multi Timeframe Panel MT5 是一个免费的附加组件,是您的 Matrix Arrow Indicator MT5 的重要资产。它显示了当前 Matrix Arrow Indicator MT5 信号,用于 5 个用户自定义的时间范围和总共 16 个可修改的符号/工具。用户可以选择启用/禁用 Matrix Arrow Indicator MT5 包含的 10 个标准指标中的任何一个。所有 10 个标准指标属性也是可调整的,如 Matrix Arrow Indicator MT5 。 Matrix Arrow Indicator Multi Timeframe Panel MT5 还提供了更改它所附加的当前图表的选项,方法是单击 16 个可修改符号按钮中的任何一个。这将使您能够更快地在不同符号之间工作,并且不会再次错过交易机会。
如果您想使用这个免费的 Matrix Arrow Indicator Multi Timeframe Panel MT5 插件,您需要在此处单独购买 Matrix Arrow Indicato
FREE

This tool has been designed for macroeconomic investors. It allows you to observe and operate currency indices that are more uncorrelated instruments than currencies, that do not share the same noise level as pairs and are totally uncorrelated with each other.
CurrencyTrader is a tool that allows you to trade the DXY, EURX, JPYX, GBPX, CADX, AUDX, CHFX and NZDX currency indices
Currently I use this tool for my swintrading in darwinex MACRO for MetaTrader 5 - Antonio Renteria Arce
I have left

DYJ TRADINGVIEW EA 是一种基于 DYJ TRADINGVIEW 指标的策略。
可编辑自定义交易计划,如每日最大限单3、多单限单2、空单限单1等。
交易完成后 EA 将自动删除。
适用于Boom 1000指数品种,兼容任何衍生品和外汇市场品种。
杠杆1000指数参数配置可在产品评测中下载。
最低存款 - 100 美元(高风险模式)。 推荐的存款 - 1000 美元或更多(正常模式)。 推荐符号——繁荣 1000 指数。
Parameters:
InpMagic-->123456 InpPairs-->GBPUSD,EURUSD,USDJPY,USDCHF,XAUUSD,USDCAD,GBPJPY,EURJPY,EURGBP,AUDUSD,NZDUSD
InpIsDisplaySignalWindows-->true InpMaxOpenTrades -->3 InpMaxLongTrades -->2 InpMaxShortTrades -->1 InpExtOrderStep -->200 -- for Boom 1000 Index Step

-蜡烛芯填充趋势概念
在市场的高波动性事件中,蜡烛往往会在其移动过程中产生灯芯。蜡烛图中的灯芯反映了价格的拒绝。大多数情况下,这些蜡烛芯被填满是因为有巨大的成交量向该方向推动。烛芯填充趋势扫描那些专注于趋势市场的机会。
它有一个成功率模拟器仪表板,显示带有进入点、获利和止损的实时信号。这个成功率模拟器可以作为回溯测试,检查哪些输入在过去有更好的利润。它计算点数和百分比的利润,根据过去的表现给出一个整体的概念,什么是最好的参数。
- 投入
-趋势阀芯。这个输入决定了指标所要扫描的阀芯的大小。它是以百分比来衡量的。它的默认值为20%。
-信号的数量。这是成功率模拟器所要扫描的信号数量。
-移动平均数。这个过滤器是移动平均线指标和RSI的组合。用户有机会根据自己的需要设置RSI和移动平均线。
-前一栏方向。这个功能可以避免或允许基于前一根蜡烛的信号。如果是真的,该指标将只考虑在前一根蜡烛是在相同的趋势方向上的灯芯作为信号。如果它是假的,它将考虑所有的灯芯。
-最后的高点和低点:该功能允许交易者在最后的 "x "条中扫描最后的高点和低点,以避免范围期。
-最小的蜡烛尺寸。此
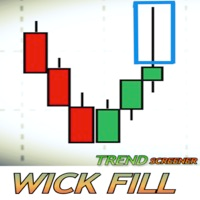
什么是交易中的灯芯?这个筛选器是如何工作的? 蜡烛图中的灯芯反映了价格的拒绝。本筛选器试图识别具有巨大潜力的灯芯。本筛选器专注于发生在趋势市场中的灯芯。
筛选器显示一个仪表板,提供了现场交易的潜在灯芯的整体视图。它显示了所有按时间框架组织的交易对/工具。买入机会被命名为 "UP-W"。它们在仪表板上显示为绿色,而卖出机会被命名为 "DN-W "并显示为红色。交易者必须在屏幕上显示的仪表板上点击所需的灯芯机会,筛选器将显示该具体交易。筛选器根据交易者选择的输入显示机会。请注意,诸如黄金或US30等工具通常有不同的合约大小,这取决于经纪人。请尽量使用具有相同合约大小的交易对或工具。否则,其中一个合约大小的交易对/工具将不会显示任何信号。
-投入
趋势阀芯。这个输入决定了指标必须扫描的芯块大小。它是以%来衡量的。默认情况下是20%。
-信号的数量。这是为成功率模拟器扫描的信号数量。
-移动平均数。这个过滤器是移动平均线指标和RSI的组合。用户有机会根据自己的需要设置RSI和移动平均线。
-前一栏方向。这个功能可以避免或允许基于前一根蜡烛的信号。如果是真的,该指标将只考虑在前一根
支持多时间周期、可自定义视觉信号和可配置警报系统的资金流量指数(MFI)指标。
自由编程服务、更新及其他TrueTL产品可在 MQL5个人资料 中获取。
非常感谢您的反馈和评价!
什么是MFI? 资金流量指数(MFI)是一种以成交量加权计算的动量振荡器,用于衡量特定时期内流入和流出证券的资金强度。它的工作方式与RSI相似,但加入了成交量因素,使其成为更全面的动量指标。数值范围在0到100之间。 MFI值高于80表示超买状态,低于20则表示超卖状态。MFI随价格上涨时确认趋势,而MFI与价格的背离则可能预警即将出现的反转。成交量因素使MFI在检测趋势衰竭方面尤为有效。 功能特点: 成交量加权动量计算 带箭头和垂直线的视觉信号标记 3个独立信号缓冲区,带可配置触发条件 信号检测选项:方向反转、水平线穿越、峰值/谷值 每个信号可配置警报(邮件、推送、声音、弹窗) 具有插值方法的多时间周期(MTF)功能 直方图或折线绘制模式 多种颜色模式(简单、基于方向、基于水平) iCustom缓冲区访问,支持专家顾问(EA)集成 输入参数: 基本设置: MFI周期: 用于计算资金流量的K线数量(默认
FREE
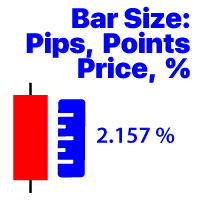
显示所选时间帧的最后一个收盘价柱的变化 价格价值; 百分比值(%); 点数; 市场点; 我的#1助手 : 包括66+功能/ 如果您有任何问题,请联系我 程序文件必须放在" Indicators "目录中。
在指标的设置中,您可以配置: 字体大小; 文字颜色; 在图表上的定位:在左下角或右下角; 打开/关闭计算机当前时间的显示; 计算的时间范围(您可以设置当前:当TF变化时,值将改变); 计算类型:
1=价格值;
2=百分比值(%);
3=以点数为单位的大小;
4=以点为单位的大小; 值的计算方法:
true:将使用高-低值;
false:打开-关闭值将被使用; 我的#1助手 : 包括66+功能/ 如果您有任何问题,请联系我 程序文件必须放在" Indicators "目录中。

Displays Forex Calendar events on the chart in the form of multi-colored lines, depending on the importance of the news. Displays the currency and the impact of the news (if available).
[OPTIONS:] Display only news on a currency pair or All news. Display news by major currencies (optional). Setting the time interval of displayed news. Selecting the importance of displayed events. Displaying the effects of news (Impacts) and currency on the chart.
FREE

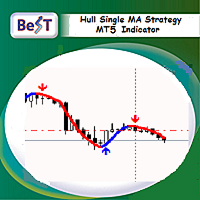
BeST_Hull Single MA Strategy is an Metatrader Indicator based on the famous indicator Hull Mov.Average . This indicator can display the Single HMA Strategy of just 1 Hull MAvg. It uses added internal filters locating the most likely Entries while it can be used as a standalone system or as an add-on to other ones.
Generally the Hull Moving Average (HMA - developed by Alan Hull) is a directional trend indicator . It captures the current state of the market and uses recent price action to determin

This is a fully automatic system for multi-currency trading (17 currency pairs) on the Forex market. The trading system itself finds the most powerful Price Action patterns in a fully automatic mode! Trading is conducted on 17 currency pairs at the same time and uses timeframes M5. Each pair has a stop loss, take profit, breakeven and trailing stop. Real m onitoring : https://www.mql5.com/ru/signals/2238618
Benefits Partial closure to reduce the load on the deposit. Determines the direction o

This indicator recognizes all support and resistance levels. A number of unique high-performance techniques have been applied, which made the existence of this indicator possible.
All formed channels are naturally visible: horizontal linear linear parabolic cubic (Polynomial 3 degrees - Wave) This is due to a bundle of approximating channels. The formed channels form "standing waves" in a hierarchical sequence. Thus, all support and resistance levels are visible.
All parameter management is i

Monitoring real accounts https://www.mql5.com/en/users/robotstroi/seller Ready-made files with settings are provided Real-time support chat. A built-in AI assistant replies instantly — around the clock, with no waiting. Then every message is reviewed by a human: if the AI can't help, an operator takes the case through to a solution. Open chat Let's take a look at the trading robot designer's capabilities, grouping them into blocks for clarity. 1. Ready-made solutions vs. developing your own str

Ace Scalper EA works on the GBPUSD, EURGBP, USDCHF, EURCHF . Timeframe M5. The strategy is based on the search of price fluctuations for the quiet period of the Asian session. During this period, there is usually no strong unpredictable price movements, which allows relatively safe scalping, with the average trade duration 1 hour. Uses tight Stop Loss, which provides deposit protection in the event of adverse developments in the market. EA does not use dangerous methods of trading that can destr

Price reach indicator. It also serves as the perfect term for supports and resistance. I use it in two experts. The basic tool for professional trading. The indicator analyzes the last 500 bar and uses this to determine the levels ( but it doesn't predict the future ) . Personally, I use it on TF H1. It is very simple. Four lines on chart and that's all. Only two input parameters. Thousands of indicators. Why this? Is good ? No! Is very good. Please test the indicator prior to purchasing. You

This is a Forex Scalping Trading Sytem based on the Bollinger Bands. Pairs:Major Time frame: 1M or higher. Spread max:0,0001. Indicators (just suggestion) Bollinger bands (20, 2); ADX (14 period); RSI (7 period ). Y ou should only trade this system between 2am to 5am EST, 8am to 12am EST and 7.30pm to 10pm EST. Do not scalp 30 minutes before a orange or red news report and not for a hour afterwards. Setup: is for price to move above the lower or lower Bollinger Bands, RSI raise above the
FREE

This EA trades according to your trendline. It can trade in several modes: will open only one trade and then be stopped trades only in the direction of the trendline opens more trades after each touch with the trendline trades in both directions it can place a pending order or open a market order See the screenshots below for a better understanding of its features.
Unfortunately, it is not possible to draw your own trend line in the MT5 strategy tester. This EA will draw its own trendline for t
Info: marcobarbosabots
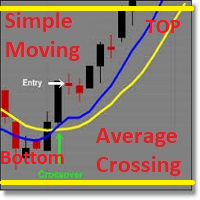
This EA automates order opening by crossing two simple moving averages. If price is on a top region, a sell order is placed. Othewise, if price is on the bottom region, a buy order is placed. Only one order at a time. No martingale and no grid system. This EA also has the option to allow it to place or not orders on the market. The value of moving averages, lot, takeprofit, stoploss, top price, bottom price and width price region are configurable, and they do not allow
53% OFF until December 31 (Normal price $125)! Don't miss the opportunity to have this invaluable tool!
This is a totally automated multi timeframe support and resistance levels finder on every MT5 chart. No manual work! Just drop this indicator on a chart and you will have the S/R levels always up to date. It is very convenient and helps the trader to anticipate possible stalls and reversions in price movements. The levels are displayed as lines and each timeframe has a different color. The i

Это классический вариант реализации экспоненциальной скользящей средней с коррекций ошибки, какой используется в индикаторах DEMA и TEMA. Соответственно названию, глубина коррекции ошибки увеличена до 33. Индикатор оптимизирован. Потребляет минимально возможные ресурсы. Достаточно быстр, учитывая объёмность вычислений. Может накладываться на другие индикаторы. Как и обычные скользящие средние, nEma_33 не перерисовывается (за исключением нулевого бара). Требуется история > Период*33*33. Согласно

货币强度交易面板 EA MT5 是适合任何初学者或专家交易者的创新解决方案!它将货币强度概念提升到一个全新的水平,因为它将它与价格行为相结合,并且可以应用于任何符号/货币对,除了通常的 8 种主要货币的 28 种组合。这意味着您可以交易任何货币对的强弱,包括所有货币、商品和加密货币(不是指数)。这是一款真正的突破性产品,通过使用彩色条形图,让您一眼就能清楚地了解 16/32 符号,从而直观地告知您任何对的 2 个部分的强度/弱点平衡,而无需破译复杂的强度线或直方图,就像在其他传统的货币强度解决方案中一样。
货币强度交易面板 EA MT5 也是您可以找到的最简单易用的 MT5 交易面板。它的所有选项和功能都集中在一个表面上,无需打开额外的窗户或面板。它是一个订单管理、风险计算器、部分关闭和帐户保护实用程序的合一,使用起来极其方便!通过使用 货币强度交易面板 EA MT5 ,您可以比传统的手动交易方法更快、更准确地进行多次交易,这让您有更多时间和更清晰的头脑专注于您的交易决策。 货币强度交易面板 EA MT5 也是一个很好的账户保护实用程序,它可以在达到账户止盈或止损净值后关
MT5 的货币强度指标 是任何初学者或专家交易者的创新解决方案!它将货币强度概念提升到一个全新的水平,因为它将它与价格行为相结合,并且可以应用于任何符号/货币对,除了通常的 8 种主要货币的 28 种组合。这意味着您可以交易任何货币对的强弱,包括所有货币、主要、次要和外来货币、商品和加密货币(不是指数)。这是一款真正的突破性产品,通过使用彩色条形图,让您一眼就可以清楚地了解 32 个符号,从而直观地告知您任何对的 2 个部分的强度/弱点平衡,而无需破译复杂的强度线或直方图,就像在其他传统的货币强度解决方案中一样。
MT5 的货币强度指标 为您提供了根据个人喜好配置 32 个符号按钮的选项,通过添加您想要密切关注和交易最多的货币对。这样您就不会错过任何机会,因为您只需看一眼就可以在图表上全面了解当前市场。此外,当您监控的 32 个品种中的任何一个在当前时间范围内达到您想要的强度水平时,您可以向您发送终端、推送或电子邮件通知。
MT5 安装和用户指南的货币强度指标 | 更新购买的产品
特征 非常简单和直接的界面,没有复杂的额外窗口或屏幕 独特的货币强度算法与价格

Trend Everest MT5 indicator is a trend following indicator that aids in decision making. It is based on the calculation of ATR that assist and the average hull. A key issue is that the Trend Everest MT5 nominee does not repaint, so you can backtest with greater confidence. When it is Green, UpTrend When it is a Red downtrend. Not that the Market is fractal, so the longer the graphic time, the greater its degree of assertiveness.

**经纪商敏感,请优化
实时信号:
https://www.mql5.com/en/signals/1285219
https://www.mql5.com/en/signals/1278508
新闻交易者是一个自动新闻交易程序。 它将挂起的止损买入和卖出订单放置在当前价格之上和之下,并修改它们直到新闻事件发生。
一旦订单是活的,它将取消相反的订单,如果选项启用和跟踪或移动止损收支平衡。
您必须添加地址' http://ec.forexprostools.com/'在允许的URL选项卡列表'工具/选项/顾问'
当心! 一些经纪人的差距价格和填补远离要求的价格。
**在欧元兑美元30分钟内效果最佳
**设置文件在注释部分
**对于回溯测试,请确保"新闻时间"为15:30,但请确保在实时交易时使用"Auto=0"
**我们的策略在优化过程中使用过去2年的历史数据,因为它是最准确的数据。
新闻包装不使用鞅或网格,所以它比其他专家安全得多。
参数:
新闻时间(0=自动)-在使用live0时应使用和15:30而回溯测试;
新闻更新间隔(
欢迎来到MT5特殊缺口机器人
如你所知,市场上有许多类型的缺口。不仅仅是在周末。
因此,我创建了一个适用于所有时间框架和所有货币对的缺口。
特点。
- 神奇的数字
- 点差过滤
- 获利
- 止损
- 条形转换
- 在相反的信号下退出
- 差距(是的,没有大小)。
- 过滤(可调整)
- 追踪
- 马丁格尔
以及更多。
请随时下载它并进行24/7交易。 欢迎来到MT5特殊缺口机器人
如你所知,市场上有许多类型的缺口。不仅仅是在周末。
因此,我创建了一个适用于所有时间框架和所有货币对的缺口。
特点。
- 神奇的数字
- 点差过滤
- 获利
- 止损
- 条形转换
- 在相反的信号下退出
- 差距(是的,没有大小)。
- 过滤(可调整)
- 追踪
- 马丁格尔
以及更多。
请随时下载它并进行24/7交易。

Auto Point of Control Indicator for those who use the Market/Volume Profile in their trading, who are familiar with the concepts of POC and VAH/VAL. I often noticed that it is inconvenient to change the zone of POC level calculation. Also it is not always convenient to use periodic areas, such as Day, Hour, etc. So I decided to develop a fully automated POC, where the zones change each other through the algorithm in the script. How to use POC - everyone decides for himself. They can be stop-loss
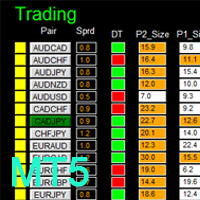
MT4 version: LINK DIBS = Daily Inside Bar Setup This system basically utilizes the popular candle pattern Inside Bar to generate trading signal mainly on time-frame H1. To facilitate you to understand and trade this system quickly and effectively, the collection of PDF manuals and tips are provided in my first comment of this product. For who cannot access Google Drive, please find these resources in the thread or PM me. Dashboard The DIBS Method MT5 is an intuitive and handy graphic tool to hel

Looking for a quality pivot point indicator? So Prosecution is what you need! To identify pivot points, the Prosecution indicator analyzes many conditions, as the aggregate analysis provides a more accurate picture of the market situation.
What are pivot points? Pivot point analysis is often used in conjunction with the calculation of support and resistance levels, as is the case with trend line analysis. When analyzing pivot points, the first support and resistance levels are calculated u
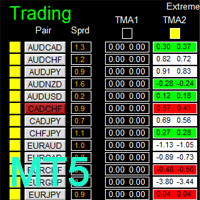
There is Demo version of this panel Dashboard Extreme TMA System MT5 Demo in my product list, please try it out to get familiar with all functionalities for free. Free version: LINK MT4 version: LINK This system basically utilizes 4 TMA (Triangular Moving Average) slope indicators on 4 time-frame and TMA Band as the core indicators to generate trading signal mainly on time-frame M15. The signal will be further filtered and trimmed by M15 Stochastic To facilitate you to understand and trade this
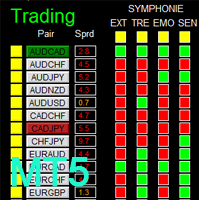
There is Demo version of this panel Dashboard Symphonie Trader System MT5 Demo in my product list, please try it out to get familiar with all functionalities for free. Free version: LINK MT4 version: LINK This system basically utilizes Symphonie Indicator Set (Extreme, Emotion, Trend, and Sentiment) as the core indicators to generate trading signal mainly on time-frame M15. The signal will be further filtered and trimmed by 1) M5 and M15 Stochastic; 2) EMA5 and PA To facilitate you to understan
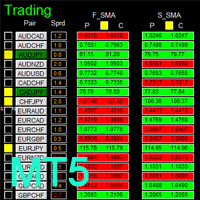
MT4 version: LINK This system basically utilizes two simple moving averages (10 SMA and 197 SMA) over 2 hours before Tokyo Open to generate trading signal mainly on timeframe H1. The signal will be further filtered by 1) M15 and M5 Fractals; 2) Stochastic To facilitate you to understand and trade this system quickly and effectively, the collection of PDF manuals and tips are provided in my first comment of this product. For who cannot access Google Drive, please find these resources in the threa

Utility for order reversal. Closes orders on the chart on which it is launched and opens orders with the opposite direction instead of them. Has a simple and intuitive graphical interface. It is also possible to automatically reverse newly opened orders. MT4 version of the utility- https://www.mql5.com/en/market/product/74771 If you like this utility, take a look at my other products - https://www.mql5.com/en/users/nina_yermolenko/seller
FREE
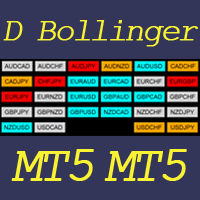
This indicator helps to visualize the Bollinger Band status of 28 pairs. With the feature of color panel, alert, and notification features, user can catch the potential Bollinger Bounce opportunities from 28 main pairs on one Dashboard quickly. Dashboard Bollinger Band is an intuitive and handy graphic tool to help you to monitor all 28 pairs and provide trading signals based on the Bollinger Bounce Rules (Overbought/Oversold and Bollinger Band Cross).
Color legend clrOrange: price is above the
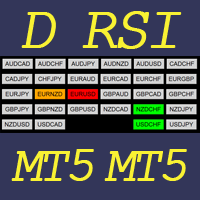
This indicator helps to visualize the RSI status of 28 pairs. With the feature of color panel, alert, and notification features, user can catch the potential buy and sell opportunities when the 28 main pairs cross the oversold/overbought area on one Dashboard quickly. Dashboard RSI is an intuitive and handy graphic tool to help you to monitor all 28 pairs and provide trading signals based on the RSI Rules (Overbought/Oversold and Stochastic Cross).
Color legend clrOrange: RSI signal is above th
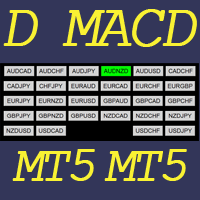
This indicator helps to visualize the MACD status of 28 pairs. With the feature of color panel, alert, and notification features, user can catch the potential buy and sell opportunities when the 28 main pairs’ fast EMA cross the slow EMA on one Dashboard quickly. Dashboard MACD is an intuitive and handy graphic tool to help you to monitor all 28 pairs and provide trading signals based on the MACD Rules (Fast EMA Cross Slow).
Color legend clrRed: MACD fast EMA down cross MACD slow EAM and MACD f
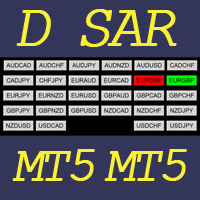
This indicator helps to visualize the SAR status of 28 pairs. With the feature of color panel, alert, and notification features, user can catch the potential buy and sell opportunities when the 28 main pairs’ SAR dots are switching between the above/below of candles on one Dashboard quickly. Dashboard SAR is an intuitive and handy graphic tool to help you to monitor all 28 pairs and provide trading signals based on the SAR Rules (SAR dots are switching between the above/below of candles).
Color
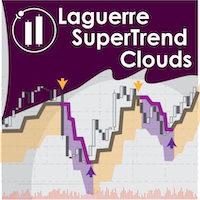
Laguerre SuperTrend Clouds adds an Adaptive Laguerre averaging algorithm and alerts to the widely popular SuperTrend indicator. As the name suggests, Laguerre SuperTrend Clouds (LSC) is a trending indicator which works best in trendy (not choppy) markets. The SuperTrend is an extremely popular indicator for intraday and daily trading, and can be used on any timeframe. Incorporating Laguerre's equation to this can facilitate more robust trend detection and smoother filters. The LSC uses the

The EA determines the likely levels of price consolidation or correction and makes a decision to buy or sell the asset. Trading is performed within a day with one position, each position must have virtual stop loss and take profit levels. At the end of the day, all open positions are forcibly closed. The time of the trading period can be set in the settings. The Expert Advisor allows you to choose the type of trading by trend or flat.
The default settings allow you to start trading immediately

Matrix MT5
Matrix MT5 is an Expert Advisor (EA) multi currency, trading based on the steps of the Fibonacci sequence and allows users to help when the market is unfavorable and EA can't handle it, this makes EA really perform well in the market. The EA works on all timeframes without losing its profitability, Recommended pairs for users GBPUSD, EURUSD, GBPCHF, USDCAD. Parameters
MagicNumber EA: Magic Number of Expert Advisor. Comment: Comment. Stop Trade %: % of capital allowed for EA
Multset This is inte_plays indicator, which helps the trader to enter the trades appropriately it plots an arrow when there is appropriate environment which permits trading
Features 1. Sends push notification on mobile devices 2. Plots arrow on chart when the setting is found
TimeFrame Is suggested to be used on higher time frames only, especially starting 15min and above for proper moves
For more informations please Visit: https://t.me/Tz_Fx_Lab Subscribe to our Youtube channel: https:
FREE
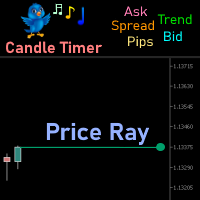
Price Ray indicator is a utility that will improve the way you trade. Primarily, it shows the Bid, Ask or Last price as a line ray which beams till the current candle, last visible chart candle or extended to all candle bars. The enhanced features in this indicator provide information in an area where you focus most, right next to the current candle. You can select text to be shown above or below the Price ray. The indicator is fully customizable, allowing it to fit any strategy requirements. Th
FREE
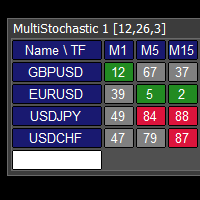
This tool monitors Stochastic indicators on all time frames in the selected markets. Displays a table with signals to open a BUY trade (green) or SELL trade (red). You can set the conditions for the signal. You can easily add or delete market names / symbols. If the conditions for opening a trade on multiple time frames are met, you can be notified by e-mail or phone message (according to the settings in MT5 menu Tools - Options…) You can also set the conditions for sending notifications. The li
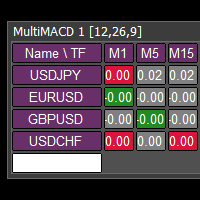
This tool monitors MACD indicators on all time frames in the selected markets. Displays a table with signals to open a BUY trade (green) or SELL trade (red). You can set the conditions for the signal. You can easily add or delete market names / symbols. If the conditions for opening a trade on multiple time frames are met, you can be notified by e-mail or phone message (according to the settings in MT5 menu Tools - Options…) You can also set the conditions for sending notifications. The list of

True Choppiness Direction determines if the market is choppy (trading sideways) or if it is trending, as well as the trend direction and strength (green=up, red=down, grey=no trend) . The underlying algorithm is designed to detect trend movements even in the presence of noisy market data, please see screenshots. Trend strength is indicated by taller or shorter red/green fill. Choppiness index is range-bound between -50 (very trendy) and +50 (very choppy). This is a custom algorithm designed
Reverse TradeCopier for Followers can copy trades from an account that is running Reverse TradeCopier for Source . Features: Copies trades from one source (master) account to multiple following (slave) accounts. Allow investor (read only) password for source (master) account. There are no complicated settings and input parameters, everything is easy. Works with different brokers. Works with different quotes symbols (EURUSD_FX, eurusd_m, etc.). Can copy orders from 4-digit quotes platform to 5-
FREE
If you want something as below: Sell FOREX trading signal. Manage multiple accounts. Follow the trading from somebody. "TradeCopier_follow" and "TradeCopier_source" can help you! Features: Copying from one source (master) account to multiple follower (slave) accounts. Allow investor (read only) password for the source (master) account. There are no complicated settings and input parameters, everything is easy. Works with different Brokers. Works with different symbols (EURUSD_FX, eurusd_m, e
FREE
If you want something as below: Sell FOREX trading signal. Manage multiple accounts. Follow somebody's trading. "TradeCopier_source" and "TradeCopier_follow" can help you! Features: Copying from one source (master) account to multiple follower (slave) accounts. Allow investor (read only) password for the source (master) account. There are no complicated settings and input parameters, everything is easy. Works with different Brokers. Works with different symbols (EURUSD_FX, eurusd_m, etc.). C
Reverse TradeCopier for Followers can copy trades from an account that is running Reverse TradeCopier Source . Features: Copies trades from one source (master) account to multiple following (slave) accounts. Allows investor (read only) password for source (master) account. There are no complicated settings and input parameters, everything is easy. Works with different brokers. Works with different quotes symbols (EURUSD_FX, eurusd_m, etc.). Can copy orders from 4-digit quotes platform to 5-dig
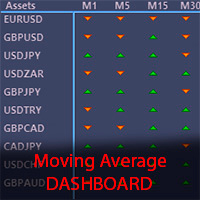
The Moving Average Dashboard indicator allows you to see the relationship between a fast and a slow moving average.
This indicator is working on multiple symbols and up to 21 timeframes. It's allows you to configure the fast and slow moving averages to whatever period, method or price is appropriate
The Moving Average Dashboard saves you time as you can use the indicator to scan multiple currency pairs or other symbols in just one window.
Installation Download the Indicator in your MT5 termi

50+ Candlestick Patterns, Simulated Trading Results, Top Five Performers Candle Analysis extends Candlesticks Pattern Analysis by not only identifying Patterns but also recording the Past Performance of the Patterns. What it Does:- Identifies and plots results on chart Displays Top Patterns for both Bullish and Bearish type. Log can be printed in experts tab to see Simulated Trading results Displays All or Selected Patterns Alerts on Pattern formation More detailed information in Blog
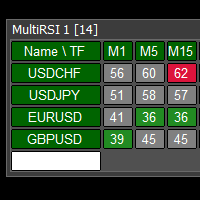
This tool monitors RSI indicators on all time frames in the selected markets. Displays a table with signals to open a BUY trade (green) or SELL trade (red). You can set the conditions for the signal. You can easily add or delete market names / symbols. If the conditions for opening a trade on multiple time frames are met, you can be notified by e-mail or phone message (according to the settings in MT5 menu Tools - Options…) You can also set the conditions for sending notifications. The list of s
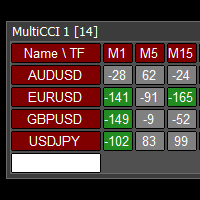
This tool monitors CCI indicators on all time frames in the selected markets. Displays a table with signals to open a BUY trade (green) or SELL trade (red). You can set the conditions for the signal. You can easily add or delete market names / symbols. If the conditions for opening a trade on multiple time frames are met, you can be notified by e-mail or phone message (according to the settings in MT5 menu Tools - Options…) You can also set the conditions for sending notifications. The list of s
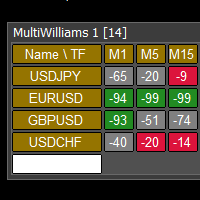
This tool monitors WilliamsPR indicators on all time frames in the selected markets. Displays a table with signals to open a BUY trade (green) or SELL trade (red). You can set the conditions for the signal. You can easily add or delete market names / symbols. If the conditions for opening a trade on multiple time frames are met, you can be notified by e-mail or phone message (according to the settings in MT5 menu Tools - Options…) You can also set the conditions for sending notifications. The li
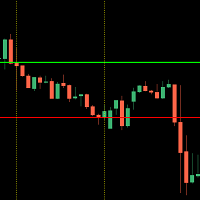
This indicator shows you the higher high and lower low of a certain period of time.
It is easy to use - select your desired time frame (current, 15Min, 1H, 1D) and the corresponding number of candles.
The indicator measures the highest and lowest point within the specified range and automatically draws the two corresponding lines.
The design of the lines is up to you!
Should the trend break one of the drawn lines with a closed candle, a message will be sent to you by the built-in alarm funct

HI guys this my developing indicator 1st version alert logic work well.. this indicator using can you stronger currency and top weaker currency find well,this;s indicator multy MTF time frame strength work.very good for SL trend screener intraday trader and long time trader, very easily can you watch stronger and weaker index.I hope to more improve this future further,thank you if you want more information please pm me
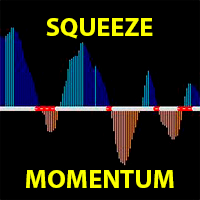
TTM Squeeze Momentum is a volatility and momentum indicator introduced by John Carter of Trade the Markets (now Simpler Trading), which capitalizes on the tendency for price to break out strongly after consolidating in a tight trading range.
This derivative Squeeze Momentum indicator attempts to identify periods of consolidation in a market. In general, the market is either in a period of quiet consolidation or vertical price discovery. By identifying these calm periods, one has a better oppor
MetaTrader市场是 出售自动交易和技术指标的最好地方。
您只需要以一个有吸引力的设计和良好的描述为MetaTrader平台开发应用程序。我们将为您解释如何在市场发布您的产品将它提供给数以百万计的MetaTrader用户。
