 MetaTrader 5
 专家
 指标
 程序库
 实用工具
 窗口小部件
 规则
适用于MetaTrader 4的新EA交易和指标 - 174
 EA交易自动执行市场交易,而指标可使您更准确地分析报价并预测价格行为。
通过这些应用程序,您将能够更明智地在MetaTrader 4执行交易,抓住更多的交易机会。
从股票指数开盘时发生的爆炸性走势中获利,每天给自己一个可操作的优势。 开盘区间突破 EA 可以根据您的喜好进行调整,以捕捉 DAX、DOW、NASDAQ 和 S&P500 等主要股指每天开盘后形成的趋势。 这些开盘每天都在同一时间发生,因此您知道何时会发生波动,并且通常就在开盘强劲趋势形成之后,您可以使用此 EA 捕捉并在整个交易时段内进行。
开盘区间通常是股市开盘后的前 5-15 分钟,在大型市场参与者下达初始订单后,投机交易开始。 打开后,往往会发生以下两种情况之一。 1. 你得到一个区间或轮换日,指数上涨,反转,然后再次反转。 如今,策略和 EA 经常会收支平衡或出现小额亏损。 2. 你会遇到一个趋势日,市场通常会连续几个小时朝一个方向发展。 这些是策略真正银行的日子,并且随着趋势的发展可以轻松产生 3-10% 的回报。 MT5 Versions is here: https://www.mql5.com/en/market/product/91232
有关 EA 交易方式的策略指南可在此处找到: https://www.mql5.com/en/blogs/post/75
指标显示所选时间帧上的最大水平交易量。 基于指标 UPD1 Volume Box 。 线可以连接或分离。 在设置中,您可以启用智能触摸通知。 这个指标对于那些使用市场概况和智能货币概念进行交易的人来说非常有用。
输入参数 。
基本设置 。 Bars Count - 表示将在其上绘制TF POC的条数 。 Data Source - 使用蜱虫的时间范围。 Vertical Step - 影响密度和垂直精度 。 TimeFrame Period - 应用最大水平交易量的时间段 。 ID - 指标标识号。 选择不同的值以在同一图表上多次使用指标 。
视觉设置 。 Current POC - 显示出现的POC 。 Crop Line To Current Bar - 这条线不会超过最后一条 。 Link POC - 用垂直线连接POC线 。 POC Width - POC线厚度 。 POC Color ID - 所选指标ID的poc线颜色 。 Extend Line Multiplier - POC线的延续,乘数。 等于1。 该线由相同数量的条形扩展 。 Extend Line St
FREE
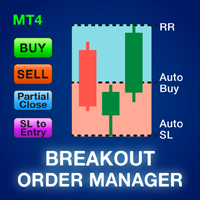
大多数零售交易者无法通过过度冒险或过度交易来管理风险和亏损账户。该工具完全自动化回撤和风险管理,让交易者只关注他们的条目。它是交易突破或回调的理想选择。它使用先前关闭的蜡烛高度来计算风险,方法是将止损设置在卖出交易的高点上方或买入交易的低点下方。止损位置可按时间范围自定义。缩编时;它通过以预定义的止损百分比自动关闭部分头寸来管理风险。通过风险回报或点值设置多个获利水平。
可用于任何入场方式和任何交易方式;剥头皮交易、盘中交易或波段交易。
特征: 可以使用其独特的“订单类型”设置来交易突破和回调。 使用最近关闭的蜡烛高度自动计算所有限价或止损订单的风险。 当价格接近止损时,使用止损距离方法通过部分平仓自动管理回撤。 使用点值或风险回报方法设置多个获利水平。 可以自动或手动将止损移至入场。 可以自动或手动关闭部分头寸。 当达到每日收益百分比时自动关闭所有未平仓头寸。 当达到每日损失百分比或 $ 值时,自动关闭所有未平仓头寸。 警告!如果您不能或不想阅读用户手册,请勿租用/购买此工具。用户手册是英文的。 购买后请在mql5私信索要用户手册。 请在模拟账户上测试此工具至少 2 周,然后再

介绍 Balanced Martingale EA MT4,这是一个专为 MetaTrader 4 平台设计的复杂交易解决方案。该专家顾问利用独特的马丁格尔和反马丁格尔策略,使交易者能够有效地利用每日趋势。 凭借其先进的算法,Balanced Martingale EA MT4 通过智能管理交易,为交易者提供竞争优势,最大化利润,同时最小化风险。适合新手和经验丰富的交易者,它简化了交易过程,使用户能够专注于战略决策。 MQL产品安装指南 | 在 MT4/MT5 上更新已购买的MQL产品 | 常见故障排除指南 | 常规设置/输入指南 | 回测和设置文件 主要特点 核心交易策略:采用马丁格尔策略,根据交易结果调整头寸大小,以有效管理风险。 支持的时间框架:兼容多种时间框架,允许灵活的交易风格。 货币对:针对多种主要货币对进行了优化,提高了盈利交易的潜力。 风险管理:具有可定制的 Stop Loss 和 Take Profit 设置,以保护您的资本。 入场过滤器:包括 spread 检查和会话过滤器,以确保在最佳条件下执行交易。 头寸管理:利用马丁格尔原则有效管理交易,即使在波动的市场条件下

该指标用于显示平面和趋势位置。 该设计基于振荡器。 它被用作一个额外的过滤器,既用于常规图表上的交易,也用于二元期权。 平的地方用于指标 UPD1 Volume Cluster 按照智能货币的概念进行交易 。 内置的警报信号最大的超买/超卖的地方。
输入参数 。
基本设置 。 Bars Count - 指定指标将显示在其上的条数 。 Period - 选择振荡器的周期 。 Start Flat After Bar - 趋势结束后要忽略多少条才能开始平图 。
视觉设置 。 Color - 自动或手动 。 Floor Color - 如果颜色是"手动"设置的,那么您可以设置自己的颜色 。 Histo Width (0 - Auto) - 选择直方图的厚度或设置自动模式 。
Alert Settings 。 Alert - 启用/禁用通知设置 。 Alert Work Time - 指定警报将处于活动状态的时间段 。 Alert Pop Up - 启用/禁用警报弹出 。 Alert Push - 启用/禁用手机通知 。 Alert E-mail - 启用/禁用电子邮件通知 。
FREE

显示当前主要市场交易时段和开始下一个交易时段的剩余时间。
市场
纽约 伦敦 法兰克福 东京 西德尼 另外 1 个会议 自定义名称、开始和结束时间
时钟时间
格林威治标准时间/世界标准时间 本地(来自计算机) 经纪人(服务器时间) 设置上的默认时间是格林威治标准时间。 更改为本地时间或经纪人时间后,需要根据选择的时间类型手动调整每个会话的打开和关闭时间。 每个市场开 和 收市 时间可以调整
图形设置 每个会话都可以单独显示或隐藏。 这将包括: 会话名称,在打开的栏上 开盘价格线,将在交易结束前绘制 背景颜色 会话背景颜色有 2 种模式
第一条,用作分隔符 完整的会议期间,从开始到结束
* 会话颜色会在重叠时混合。 这将在图表上创建一种新的特定颜色,希望有助于轻松发现历史数据上的重叠 * 在图表上绘制太多会话可能会造成混淆 * 图表上之前可见的时段可以按天数进行限制。 增加天数将增加在图表上启动指标的时间,具体取决于使用的时间范围 * 自动对比度校正功能将在设置为开时尝试调整与图表背景颜色相关的颜色
FREE
指示器显示垂直体积. 在设置中,有2个系数用于确定高和极值,1个用于确定低音量。 类似的算法也用于指示器 UDP1 Volume Pixel 。 当检测到指定的体积时,直方图以适当的颜色着色。 直方图的宽度会根据比例自动选择。 作为一项规则,价格反应的最大和最小体积。 但有必要使用确认信号。
输入参数 。
基本设置 。 Bars Count - 指标将显示在其上的蜡烛数 。 Calc Bars - 确定体积偏差的平均蜡烛数 。 Low Volume Factor - 我们定义低容量的系数 。 High Volume Factor - 我们定义大体积的系数 。 Extreme Volume Factor - 我们定义极值体积的系数 。
视觉设置 。 Histo Color - 根据蜡烛的体积和方向选择颜色来着色直方图 。 Width Histo (-1 auto) - 规则直方图的厚度 。 Width Color Histo (-1 auto) - 颜色直方图的厚度。 默认情况下,自动选择厚度。
电线杆 。 Draw Polus - 显示两极。 极点被定义为逆分形。 左右的音量
FREE
Ultimate Confluence Signal MT4 是一个复杂的交易指标,专为 MetaTrader 4 设计,为交易者提供了一个强大的工具,以增强他们的决策过程。通过聚合多个技术指标的信号,该工具为新手和经验丰富的交易者提供了识别各种金融市场中高概率交易机会所需的洞察。 使用 Ultimate Confluence Signal MT4,您可以有效地过滤市场噪音,并利用来自 RSI、MACD 和 Stochastic 等各种指标的对齐信号。这种方法不仅提高了您的胜率,还帮助减少情绪化的交易决策,使其非常适合在动态市场环境中进行剥头皮、日内交易或摆动交易。 MQL 产品安装指南 | 在 MT4/MT5 上更新已购买的 MQL 产品 | 常见故障排除指南 | 指标设置 / 指南 主要特点 多指标汇聚:整合多个指标,为趋势、反转和突破策略提供全面的交易信号。 可自定义信号阈值:根据您的交易风格定义弱、中等和强汇聚水平。 颜色编码直方图:以易于阅读的视觉方式表示市场状况,牛市和熊市信号采用不同颜色。 缓冲区集成:将指标值作为缓冲区暴露,以便与 Expert Advisors 无缝交
市场结构MTF指标是一个成功的尝试,以形式化结构的价格运动使用一个独特的算法。 它准确地将任何价格走势分解为其组成元素,并允许您不会错过任何有趣的进入或退出点。 市场结构MTF指标的一个重要特征是在两个时间框架上同时可视化价格变动的结构–在当前和任何旧的时间框架上由用户选择。 尽管与各种曲折的外部相似性,但这个指标与它们根本不同,并且没有曲折具有的所有缺点–延迟和重绘。 市场结构MTF指标的使用允许您仅基于"动量修正"结构工作,既可以跟随趋势,也可以确定趋势反转的时刻。 此外,该指标与任何交易系统和策略(水平,趋势线,市场概况,保证金区域,期权水平等)完美结合,加强它们,并允许您在运动开始时找到切入点,并在趋势方向 此外,以下工具包含在市场结构MTF指标中: *Fibo回撤和Fibo扩张,以确定价格移动路径上的移动目标和重要区域 *在自动模式下构建水平线-由当前和旧时间框架上高于和低于当前价格的重要极端值确定的最近支撑和阻力水平。 *自动检测当前和较早的时间帧(上升/下降趋势或持平)的市场状况,并以箭头的形式输出这些信息 *"智能"警报-按一个按钮设置标记。 当触摸哪个价格时,用户收

根据波动性,奖励交易头寸的潜在风险基于平均真实范围显示。 点击"买入或卖出"按钮时,会显示风险回报框! ATR计算的一个效用,为一个不属于何时关闭交易的艰难决定的问题感到高兴。 这件事将有助于你的风险管理决定.
规格说明 平均真实范围是一个常用的指标,以点或价格衡量市场的波动性。 真实范围是在任何给定时间段内烛台的最低交易价格和最高交易价格之间的差额。 平均真实范围,在所有,平均这些高点和低点的"前"天。 例如,ATR指标的默认设置为我们提供了14天的周期。 ATR收集点值的高点和低点,除以14天。
但当然,这超出了通用指标ATR。 事实上,三个完全不同的TPs完全依赖于他们自己的时间框架来实现不同的pip消耗。 烛台的规则在技术上是不同的每个时间框架。 因此,当我们使用相同的时间段时,我们会发现每个时间段的结果不同。
例子::
时间段/天数占:14/时间段:M30 时间段/天数占:14/时间段:H1 时间段/天数占:14/时间段:H4 ^这些将提供不同的平均真实范围^ 这里是我喜欢3TP的权力所在和原因:理论上,尾随可以发生在第一个TP朝向第二个TP。 第三个T
FREE

介绍 STM Trade Panel MT4,这是一个专为使用 MetaTrader 4 的交易者设计的必要工具。这个强大的工具简化了交易执行和管理,为新手和经验丰富的交易者提供了流畅的体验,帮助他们提高交易效率。 STM Trade Panel MT4 提供了关键优势,例如一键下单和可自定义的交易设置,确保用户能够快速响应市场变化。非常适合剥头皮交易者、日内交易者和摆动交易者,这个工具因显著减少交易执行时间和改善风险管理而受到认可,适用于包括 forex、指数和加密货币在内的各种交易工具。 MQL 产品安装指南 | 在 MT4/MT5 上更新已购买的 MQL 产品 | 常见故障排除指南 | 指标设置 / 指南 主要特点 一键交易执行:快速下达买入和卖出订单,支持可自定义的 lot 大小和止损/止盈设置。 自动交易关闭:根据预定义的利润或损失阈值自动关闭交易,确保有效的风险管理。 特定订单管理:轻松同时关闭特定类型的订单或所有交易,以增强对交易组合的控制。 风险-收益配置:设置风险收益比,以使您的交易策略与风险承受能力相匹配。 实时盈亏监控:在直观的显示界面上实时查看您的盈亏情况,便于
FREE
這個稱為“Tumbler”的 Expert Advisor 以 mar 原理工作,根據設置,它使用隨機信號進行入場。它的獨特之處在於,當通過止損平倉交易時,以不同的方向開倉交易,同時考慮到前一筆交易或一系列交易中投入的資金。 它既可以作為助手用於手動交易,也可以用於自動交易,具體取決於設置。 Zhège chēng wèi “Tumbler” de Expert Advisor yǐ mar yuánlǐ gōngzuò, gēnjù shèzhì, tā shǐyòng suíjī xìnhào jìnxíng rùchǎng. Tā de dútè zhī chù zàiyú, dāng tōngguò zhǐ sǔn píng cāng jiāoyì shí, yǐ bùtóng de fāngxiàng kāi cāng jiāoyì, tóngshí kǎolǜ dào qián yībǐ jiāoyì huò yī xìliè jiāoyì zhōng tóurù de zījīn. Tā jì kěyǐ zuòwéi zhùshǒu yòng yú shǒudòng j
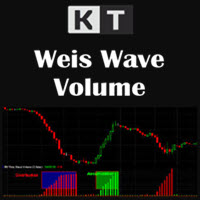
逐浪解读市场活动 KT Weis Wave Volume 将每根柱线的成交量转换为交替出现的上涨与下跌价格波段。指标会累积整个波段中的成交量,并在价格图表下方以清晰的柱状图显示结果,让市场活动呈现明确的方向结构。 上涨波段中绿色柱线持续增长,下跌波段中红色柱线持续增长。随着价格发展,递增的柱线让波段方向、持续时间和累积活动一目了然。 分别累积每个上涨与下跌价格波段的成交量。 清晰的绿色和红色柱状图,便于快速直观解读。 基于 ATR 的波段划分,并可调整参数值。 可选择价格来源和真实波幅处理方式。 可选振荡显示与标准化显示模式。 比较成交量投入与价格结果 Weis Wave 分析将成交量与价格走势结合在一起。每个完成的波段都会显示推动该方向运动所伴随的市场活动,帮助您比较成交量投入与最终形成的价格进展。 将当前上涨波段与之前的上涨波段比较,再以相同方式比较下跌波段。您还可以把累积成交量与价格运行距离结合起来观察。这种逐浪分析方式能够以实用、直观的形式呈现参与度、方向强度和动量的变化。 一眼掌握多周期方向 内置面板显示当前品种在九个时间周期上的 Bullish 或 Bearish 方向:M

Obie 1M Scalper Metatrader 4 Forex Robot 是一款利用 13 条移动平均线的自动外汇交易软件。
从本质上讲,它使用多个移动平均线来制定扫描市场以获取买卖交易信号的逻辑,可确保此类警报越来越准确。
顾名思义,这是一种剥头皮算法,在 1 分钟时间范围内对主要外汇货币对(如英镑/美元、欧元/美元、美元/瑞士法郎、美元/加元等)以及上市股票表现最佳 在纳斯达克。
交易此自动交易系统所涉及的风险是点差。
因此,1 分钟剥头皮专家顾问应仅部署在点差相对较小的外汇对上,例如 EUR/USD、USD/JPY 和 GBP/USD。
策略测试报告 在 1 分钟图表上的 GBP/USD 外汇对的 1 分钟黄牛外汇机器人策略测试报告下方找到。
整体表现 EA 从总共 13 笔交易中获得了 605.44 美元的总利润。 最大的盈利交易产生了 357.27 美元的利润,而最大的亏损交易产生了 0.00 美元的损失。
统计数据: 测试中的柱线:建模的 8519 个刻度
初始存款:10000.00 美元
净利润总额:605.44 美元
总交易数:13
最大

Pure Management Metatrader 4 Forex Robot 是一种算法交易者,其设计目的是在当天的交易时段仅获利 10 点。
EA 部署了一种算法,该算法优先考虑连续获胜的高概率以找到更好的结果,从而提高预期收益。
Pure Management 专家顾问利用基于历史统计数据的资金管理技术,以及交易失败后手数的增加。
Pure Management 外汇机器人也在连续获胜后通过增加订单手数来降低风险。 它使用默认的最大手数上限 5.0 来控制不断增加的订单手数。
策略测试报告
在 1 分钟图表上找到 EUR/USD 外汇对的 Pure Management 机器人策略测试报告。
整体表现
EA 从总共 198 笔交易中获得了 1640.00 美元的总利润。 最大的盈利交易产生了 50.00 美元的利润,而最大的亏损交易产生了 250.00 美元的损失。
统计数据:
测试中的柱:模拟 19854 个刻度
初始存款:10000.00 美元
净利润总额:1640.00 美元
总交易数:198
最大利润交易:$50.00
最大亏损交易:-$2
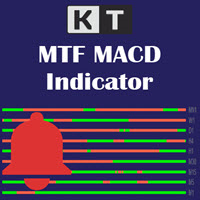
作为一名交易者,同时监控多个时间周期可以帮助你更好地了解市场趋势,并判断多个周期之间是否达成一致或存在分歧。 KT 多时间周期(MTF)MACD 指标可在一个图表中显示所有时间周期的 MACD(移动平均收敛/发散)情况,从而提供整体方向的可视化概览。 该指标以表格形式展示每个时间周期对应的 MACD 趋势,你还可以在图表上直观地看到 MACD 是否在各周期中增强或减弱动量。
功能特点
KT MTF MACD 可同时监控多达 5 个不同的时间周期、周期间隔和交易品种。 它能够识别每条数据流的 MACD 趋势状态和信号。 将多时间周期的复杂图表整合为一个简洁的概览视图。 通过减少使用的图表和指标,节省电脑资源。 支持高级颜色编码功能和自定义选项。 当趋势变化时,可通过提醒功能第一时间通知你。
结论 多时间周期交易是提升交易效果的优秀方法,因为它可以帮助你在更大趋势中找到最佳入场点。 通过 KT MTF MACD,你无需在多个图表中来回切换,它允许你在一个界面中观察多个时间周期的市场行为。 你可以先在模拟账户中测试该指标,看看它如何与你的交易策略结合。
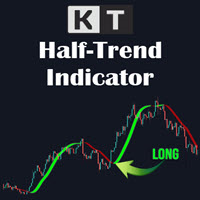
在价格图表上跟踪趋势状态 KT Half Trend 直接在价格上绘制彩色趋势线,并用箭头标记方向状态的变化。趋势线持续显示当前状态,而箭头则让每次新转换在图表上一目了然。 蓝色趋势线: 表示看涨的 Half Trend 状态。 红色趋势线: 表示看跌的 Half Trend 状态。 蓝色向上箭头: 标记转入看涨状态。 红色向下箭头: 标记转入看跌状态。 比较多个时间周期的方向 紧凑的面板显示 M1、M5、M15、M30、H1、H4、D1、W1 和 MN1 的看涨或看跌 Half Trend 读数。无需为每个周期分别打开图表,即可将当前图表与更短和更长的时间周期进行比较。 多时间周期模式可以开启或关闭,面板中的每个时间周期也可以单独启用。您可以只保留交易流程中需要的行。 使用 Amplitude 调整灵敏度 Amplitude 参数控制 Half Trend 计算对价格变化的响应。可根据时间周期和图表风格选择合适的灵敏度。明显倾斜的趋势线表示方向性走势更强,较平坦的部分表示方向性较弱。 趋势线、箭头和面板可以配合使用:当前图表的趋势线显示现有状态,箭头定位转换位置,面板则用于比较不同时

The Time End bar by MMD is a simple indicator that shows the number of seconds remaining in the three selected intervals. According to the MMD methodology, the moment when a directional price movement occurs is important. This indicator allows you to use this relationship more effectively in Forex and Futures trading.
Functionality description:
Time Frame 1 Period - defining the first time interval Time Frame 1 Color - specifying the color for the first time interval Time Frame 1 Period - def
FREE

MMD 的收支平衡線
盈虧平衡線對於使用允許同時雙向交易的策略(例如 MMD 方法)的人來說是一個有用的指標。 該指標在玩統計模型和在累積和分配區域平均位置時很有用。 該指標通過對三組頭寸求和來繪製水平:包含在買入中的頭寸、包含在賣出中的頭寸和包含的所有頭寸。
功能說明:
Show BUY BELine - 顯示或隱藏買入頭寸的收支平衡水平 BUY BELine Style - 定義 BE 級別的線條樣式,用於 BUY 位置 BUY BELine Color - 指定 BE 水平線的顏色,用於 BUY 位置 Buy BELine Width - 定義 BE 水平線的粗細,用於 BUY 位置
Show SELL BELine - 顯示或隱藏賣出頭寸的收支平衡水平 SELL BELine Style - 定義 BE 級別的線條樣式,用於 SELL 項目 SELL BELine Color - 為 SELL 位置指定 BE 水平線的顏色 SELL BELine Width - 為 SELL 項目指定 BE 水平線的粗細
Show BUY+SELL BELine - 顯示或隱藏所有
FREE
All about Smart Money Concepts Strategy: Market struture: internal or swing BOS, CHoCH; Orderblock; Liquity equal; Fair Value Gap with Consequent encroachment, Balanced price range; Level with Previous month, week, day level or in day level (PMH, PWH, PDH, HOD); BuySell Stops Liquidity (BSL, SSL); Liquidity Void Long Wicks; Premium and Discount; Candle pattern ... "Smart Money Concepts" ( SMC ) is a fairly new yet widely used term amongst price action traders looking to more accurately navigate

The construction of a breakdown system includes the following steps: 1. Determination of the current volatility and the breakdown threshold. The current volatility, in this case, is defined as the difference between yesterday's daily high and the daily low. The breakdown threshold is set at 70-75% of this value. 2. Setting pending buy and sell orders. 3. Entering into a transaction, placing stop loss and take profit orders. Breakouts occur, as a rule, during periods of consolidation. As can be s

XA Risk Reward Ratio Tool MT4 tool is a professional algorithm, that calculates risk of every transaction before it is finalized. It allows you to precisely estimate gain and possible loss. The professional tool can estimate levels of Take Profit and Stop Loss incredibly precisely, making investments more effective and safer. Using Risk Reward Ratio Tool, you can with one click carry out transactions, cancel position, set position rate, set opening point, TP, SL and many other features. List of
FREE

This indicator is very useful for those who trade with investor techniques. That's why I named it InvestorTool. Why investors? Isn't this a tool for trading? This indicator is basically to help investors to identify which pairs are very close to their All-Time-Low or All-Time-High. So that the investor will quickly spot which instruments are "relatively" at its low cost, and telling the minimum equity required.
If the pair is close to All-Time-Low then investor can put a buy position. When t
Индикатор предназначен для разметки ,фибо уровней и фибо зон.Также есть возможность удаления и редактирования уровней на текущем графике. При установке нескольких индикаторов (FIBO-ZONES)на график,не забывайте менять имя в поле (NAME).В утилите также есть возможность менять цвет зон, толщину линий и стиль линий уровней фибо. При установке индикатора ,зоны выстраиваются автоматически.
FREE

** Automatically Adds to your existing trades that you open ** KFX Dashboard EA monitors Price Action using Candle Direction + Moving Average on Multiple currency pairs (selected by you) and on Multiple Timeframes (selected by you). The dashboard also reveals Currency Strength of pairs based on your Moving Average selection. KFX Dashboard EA option to set Stop Loss(SL) and Take Profit(TP) based on your selected Timeframe and ATR / Points settings. Trailing stop by ATR / Points also available (s

Place the indicator on the chart, preferably with a timeframe of H1 or H4. If you are trading in the daily range or, conversely, on lower timeframes, you will need to adjust the RSI and ATR levels accordingly.
The blue arrows of the indicator will be a signal to open a long position, the red arrows will be a signal to open a short position:
1) Blue arrow for longs (growth) and red arrow for shorts (decline).
2) Two horizontal lines for current positions (one for entry and one for stop).
3

The GRat_OrderExport EA exports trades made in the MT4 (manual or any other Expert Advisor), which can later be imported by: GRat_BinanceImport or GRat_BybitImport or GRat_Crypto tool in order to copy trades to the crypto exchange. using the GRat Order Exchange library (in particular, the GRat_OrderImport EA) in order to copy trades to MT5 terminal; GRat_OrderImport (MT4) in order to copy trades to another MT4 terminal or to another correlating symbol of the same MT4 terminal . To

The GRat_OrderImport EA imports into MT4 on the symbol of its chart all trades that are exported by: GRat_IndiTrade - strategy builder for automatic trading using ANY available indicators; GRat_OrderExport (MT5) - manual trades or trades of other EAs from MT5; GRat_OrderExport (MT4) - manual trades or trades of other EAs from MT4; using the GRat Order Exchange library. To start importing trades for the required symbol, just launch the EA on the chart of this symbol and set the parameters: Magic
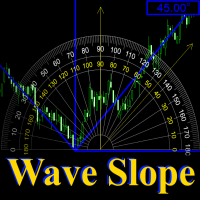
Wave Slope - works on the basis of the ZigZag indicator and is designed to measure the slope of the current wave, in degrees.
The sharper the angle of inclination, the stronger the trend. And on this you can build a trading system.
In the settings, you can connect the ZigZag indicator, set the color and width of the slope line.
And you can also turn on and off the sound signal, which is triggered in case of a change in the slope of the wave.

** All Symbols x All Timeframes scan just by pressing scanner button ** *** Contact me to send you instruction and add you in "M W Scanner group" for sharing or seeing experiences with other users. Big Update: 2026/10/28
Introduction: Double Top(M) and Double Bottom(W) is a very repetitive common type of price reversal patterns. Double Top resembles M pattern and indicates bearish reversal whereas Double Bottom resembles W pattern and indicates a bullish reversal that they have high w

This expert has capital and risk management tools. Many indicators are used in this expert for low-risk automatic trading. Refer to the guide for details. Help: Lot=Volume TP=Take Profit SL=Stop Loss Order = number of orders Currency EURUSD & Period H1
It is strongly recommended to use the following defaults according to the inventory. - example: balance 1000 Standard or Micro Lot:Volume = 1 TP:Take Profit = 50 SL:stop loss = 1000 Order:number of orders = 1 balance 100 Standard or Micro Lo
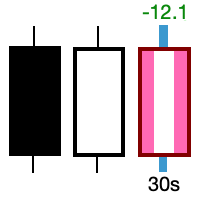
Take control of the most important candle on your chart. Customise and supercharge the active candle. "LastCandle" is a unique indicator. There is no other indicator that is so laser-focused on just the active candle. Set different colors and make it stand out from all the other candles. (This makes sure you never mistake an active candle from a closed one. Even if this happens once it could save you the cost of the software.) When you zoom out, you get a super-sized version of the candle so y

WARNING!! THIS SWORD IS TOO SHARP! ONLY 10 COPIES LEFT FOR THE NEXT PRICE TO BE 8,000$ FOR UNLIMITED PLAN. Dear traders I am very glad once again to introduce to you my other tool called "Forex Sword Indicator". In short this tool is meant to give you an edge over the market that you have been waiting for so long. Now, here it is. It is a very very simple tool but yet a dangerous sword. I call it a Holy grail indicator!. I will not talk a lot about this tool. Just let the tool speak by itse

Индикатор строит блоки заказов (БЗ) по торговой системе (ТС) Романа. Поиск блоков осуществляется одновременно на двух таймфремах: текущем и старшем (определяемым в настройках). Для оптимизации и игнорирования устаревших блоков в настройках задается ограничение количества дней в пределах которых осуществляется поиск блоков. Блоки строятся по правилам ТС состоящем из трех шагов: какую свечу вынесли (что?); какой свечой вынесли (чем?); правило отрисовки (как?).
FREE

MA Revolution is upgraded version of standard Moving A verage. With the current upgrade moving average line got more sensitive with different market conditions. It gets more flexible by decreasing default period step by step while market is sharp and incrasing period back to default period step by step while market is normal again. testing of the ide a shows th at this upgr aded version gives much more acur acy for detecting m arket direction, ch anges in direction are shown much e arly th an

Risk Management Panel is unique to tool calculate your risk quickly and place trades based on your account money. There are two options for the user Account Equity Account Balance Tools like these is specially useful when you have to take a quickly decision about your trade but dont have the time to calculate the risk. It works with magic number. So the advantage is a trade placed by this panel could be manipulated by the other expert advisors as well
FREE

Time Line by MMD is a simple indicator that supports historical data analysis and trading on statistical models that follow the MMD methodology.
Start Time - specifying the time when we start analyzing and playing the MMD statistical model Time Duration in minutes - duration of the model and its highest effectiveness (after the end of the line, the price returns - statistically - to the set level) Lookback days - the number of days back, subjected to historical analysis Base Time Frame - the b

Welcome to the newest product. The Mirco Scalper EA is packed with the latest trading strategies for speculating in the forex market. The EA calculates Price Action and Tick Data volatility to find the best trading opportunities with high winrate. EA works with currency pairs and Gold. All trading orders have Stop Loss. You can set Stop Loss values that match your risk criteria. This Robot is fully automated and has been created for everyone. No need for set files or complicated settings. You

Ever took a trade and when you come back to the termainal to check on the status of the position, you realized the market has gone so far in the opposite direction or it has hit your stoploss. Well this system is here to help manage those moments price doesn't go in your desired direction. Consider this to be the insurance your account needs for your trading business. This tool manages manual trades and e.a. triggered trades. However be aware that some e.a.s are programmed to override other e.a.

NOTE: PRICE WILL RISE VERY SOON. DON'T SKIP THIS OFFER! Dear traders I am glad to introduce the " Market Swing Scanner Board" indicator to you. This indicator was made mainly to be used in combination with the Market Swing Index Indicator. You use the "Market Swing Scanner Board" indicator to scan for trading opportunities on the Market Swing Index Indicator . This tool is designed for serious traders who have decided to make a difference through trading. Be the next person to witness this st

Это очень удобный и нужный инструмент для тех, кому некогда сидеть за монитором или если вы просто хотите при получении определенной прибыли, зафиксировать ее и закрыть все открытые ордера на счете.
Советник полностью автоматический, но если Вы захотите вмешаться в его работу, то для этого есть кнопка Close. Кнопка «Close» позволяет закрыть все открытые на данный момент позиции.
Настройки: Total_Profit_Start = 5000; //Сумма в USD от которой стартовать трал по Профиту Profit_Percent = 1; //% Пр

This is the HFT Flame Ea....This is a complex Expert Advisor that basically pick trades from price movements, it is also a none-martingale mechanism with netting strategy that makes this Ea more interested and profitable throughout your trading journey. The HFT Flame EA can be super consistent on profits depending on the inputs selected for your style of trading. This is a hand free trading robot that can trade your way to success while you are away from the charts, another perfect advantage abo

Description
This Expert Advisor mainly works on range breakout on a particular timeframe. The logic behind the this pretty simple. When a range is formed in any time frame (e.g. the range should be less than 20 pips and there must be atleast 30 candle in that range), this ea will wait for the range to be broken out on any direction. If the range is broken on the upper side it will enter into the buy position and hedge the lower ragne with sell position(Could be martingale multiplied lots). If i

KT Trend Exhaustion is our personal implementation of the famous Trend Exhaustion Index developed by Clifford L. Creel, Ph.D., in 1991.
The change in price direction often comes with uncertainty. TEI helps to tackle the uncertainty by showing a crisp direction using the smoothed color-changing index.
Features
Easy to use and interpret. It comes with a multi-timeframe scanner that scans the upcoming signals across all the time-frames. It can be used as an entry signal or trend confirmation. Al

KT Know Sure thing is a momentum oscillator based on the smoothed rate of change over four different timescales and was developed by Martin Pring. In 1992, Pring published the initial description of the indicator in Stocks & Commodities magazine's "Summed Rate of Change (KST)" article. KST creates a momentum oscillator by combining the price momentum measurements from four different price cycles. Traders can utilize KST to search for bullish or bearish divergences, signal line crossovers, and ce

KT Forex Line can be described as an improved version of the moving average indicator. The indicator is embedded in the main trading chart and features a line that switches between blue and white depending on the prevailing direction or mood of the market.
Utilizing the indicator is simple. You do not need to understand complex graphs and intricate lines. Recognize the indicator line's color and trade accordingly.
Key Features
The indicator has customizable colors, with the blue and red being

The KT Market Speed is a unique and straightforward oscillator-based technical analysis tool that helps traders visualize the speed at which the price of an instrument changes based on the preset length. The Market Speed representation helps correctly map the price momentum: is it moving fast, slowing down, or trapped in a range? These are the questions the indicator answers, giving traders more bandwidth to execute better-informed trade positions.
Formula
It's a simple technical analysis tool

KT Forex Super Scalper is created to identify market trends and plot trade signals based on the direction of the predetermined trend. It functions very similarly to moving averages but reacts quickly to changes in price actions and can signal right away once a valid trend is confirmed. The quick reactionary feature makes it a valuable tool for scalpers. However, anyone familiar with moving averages can use it for actual trading because of its signaling process and chart demonstration simplicity
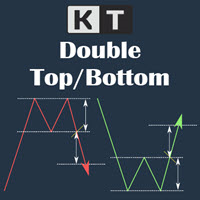
The double top bottom pattern is arguably one of the technical analysis's most popular chart patterns. These patterns are used to capitalize on recurring patterns and identify trend reversal patterns, thereby creating well-placed entry and exit levels. The KT Double Top Bottom is based on these patterns and fine-tunes the trade signal development process for traders.
Features
It's based on one of the most reliable trading patterns and brings some fine-tuning and automation to the process. Also
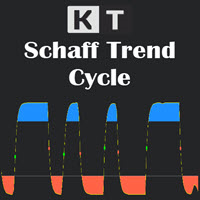
The Schaff Trend Cycle (STC) is a technical analysis tool that helps traders and investors plot highly-probable predictions on the price direction of an instrument. Due to its predictive properties, It's a good tool for foreign exchange (forex) traders to plot buy and sell signals. The Schaff Trend Cycle was developed by prominent forex trader and analyst Doug Schaff in 1999. The idea driving the STC is the proven narrative that market trends rise or fall in cyclical patterns across all time fr

Basic technical analysis tools use signals during market changes by providing critical information that can influence investment and trading decisions. Several technical analysis tools are developed for this purpose, and one of the most popular indicators traders use the KDJ Random index. It's known as the Random Index, is primarily a trend-following indicator that aids traders in identifying trends and prime entry points.
Features
It analyzes and projects changes in trends and price patterns

It is important to read and understand the EA. Optimize for parameters. The EA does use stops and does not use martingales This is an original partial concept version, not the same but a concept of HFT HACKER: https://www.mql5.com/en/market/product/73834 HFT HACKER uses money management and is not so much about getting 1 pip and was built with machine learning. This EA will buy and sell capturing small moves It needs to be trades on the best broker for small moves, like a direct access brok
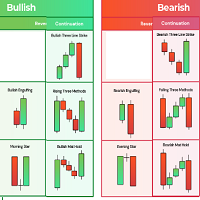
simple indicator based on some candle patterns recognition arrows appear on candles when bear signal / bull signal based on candle pattern recognition two strategies available you can enable / disable them indicator can work on any chart and time frame i prefer to work on high time frames especially the Daily charts D1 red arrows appears above candle showing a bear signal after candle completed - arrow will be blue during candle formation Green arrows appears below candle showing a bull signal a
MFF FTMO risk management helps to close all orders when the balance falls below the previously set level. Input Parameters: Management Type: Percent % Daily drawdown (MFF). Close all orders if Percent % drawdown based on equity: Set Percent with this Management Type. Management Type : Set Equity Close all (FTMO). Number of Equity to close all orders: Set Number with this Management Type.

Green Revolution is an Expert Advisor designed specifically for trading gold. EA works according to the Trend Follow
Live Results at: https://www.mql5.com/en/signals/1869436?source=Site +Profile Requirements Trading pairs XAUUSD Timeframe M15 Minimum deposit
100$ Leverage
1:500,1:100 Brokers
Just Forex,Exness,FBS
Features - Fully automatic mode with Less inputs. - Every trade is protected in advance. - Does not use averaging, history reading, overoptimization and other pointless meth

What Is the Coppock Curve? The Coppock Curve is a long-term price momentum indicator used primarily to recognize major downturns and upturns in a stock market index. It is calculated as a 10-period weighted moving average of the sum of the 14-period rate of change and the 11-period rate of change for the index. It is also known as the "Coppock Guide."
Example of How to Use the Coppock Curve Apply the Coppock Curve to a weekly/monthly price chart of a stock index or stock index exchange traded f
Attention Trader: Maximise This 5 Star Trading System +R3 System Is Now In Play Why Is The +R3 PowerPlay BullBear System Different? +R3 trading systems are different because of how they work. In short +R3 systems follow three rules which give consistent performance. By following the +R3 system when trading manually you can have some success by just using one of the laws, but when you combine them you have a trading system which blows everything else out of the water. What Are the 3 Laws To Foll
FREE

Tradely Scalper is a fully automated scalping EA that uses an exclusive breakout strategy and provides Advanced money management, Trailing stop, risk-free and profit save systems. This EA doesn't need over-optimization to be profitable which means it's suitable for every beginner or experienced trader.
Requirements Trading pairs EURUSD, USDJPY
Timeframe H1 or M30
Minimum deposit
$100
Leverage
1:100 Brokers
Hedging ECN account. Low spreads and zero stops level
How to setup - Open M

"ImEngg EA" is the advance system developed after years long research and proven in best market conditions, even this EA survived the worst market crashes. This is a simple Grid system, takes trades very logically without fail and you can sleep easily without worrying if using the suggested settings and minimum balance. Currency Pairs: AUDCAD, AUDNZD, NZDCAD Time Frame: M15 Very much cheaper when compared to simmilar EAs. OneChartSetup: Trades three pairs AUDCAD, AUDNZD, NZDCAD. Just set up EA
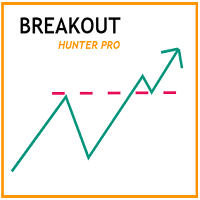
This EA uses a breakout strategy, will look for swing highs and lows automatically. Has protection from daily max drawdown so this ea is very safe. Not using martingale or grid techniques. Recommended timeframe 1 hour.
Recommended pairs EURUSD & USDJPY.
Risk percent: Risk per trade. Calculate risk based on: You can choose based on balance or equity. Fix lot: If risk percent = 0 the fix lot will be active. Timeframe for signal: Look for swing highs and lows by timeframe Takeprofit: Takeprofit
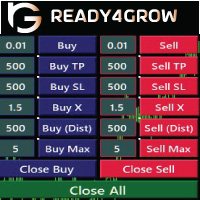
Every time Trader opens a trade, he must know the profit and risk of the trade he made, so that he can determine the risk and profit opportunity he will get. Determining this calculation manually can be quite troublesome, especially if it has a lot of open trade to do. Ready4grow Trading Panel is a utility tool that really helps traders meet those needs. Opening a Market or pending trade, determining lots, pips, price positions, how much USD, and what percentage of risk can be set automatically

MT4版本: https://www.mql5.com/en/market/product/90091 MT5版本: https://www.mql5.com/en/market/product/93707
“多对货币强度计”EA 是一款先进的交易工具,专为希望通过全面的市场分析和强大的风险管理技术优化交易策略的外汇交易者而设计。 该 EA 利用货币强弱方法,根据当前未平仓头寸提供不同货币对的相对强弱指示。 以下是详细描述:
概述 “多对货币强弱计”EA 是一种自动交易系统,可动态分析多个货币对中各种货币的强弱。 通过评估未平仓头寸,它可以识别货币优势和劣势带来盈利交易潜力的交易机会。 该 EA 配备了复杂的风险管理功能,包括平均挂单,以确保平衡和受控的市场波动风险。
主要特征 货币强弱分析 实时数据:持续实时监控和更新各币种的强弱,确保及时准确的交易决策。 多货币对评估:同时分析多个货币对,提供外汇市场格局的全面视图。 强弱指标:利用先进的算法计算并显示每种货币的强弱指标,轻松识别潜在的交易机会。 持仓监控 实时头寸分析:与当前未平仓头寸相结合,评估其对货币强度的影响,提供动

MT4 版本: https://www.mql5.com/en/market/product/90165 MT5 版本: https://www.mql5.com/en/market/product/90469
Dynamite Breakout EA - 基于智能波动率的交易算法 概述 Dynamite Breakout EA 是一种先进的专家顾问,旨在通过根据日内价格变动动态识别突破区域来利用市场波动。此 EA 通过分析与当日最高价和最低价相关的实时价格行为来智能计算潜在交易区域。通过实施智能挂单,它可确保具有预定义风险管理的最佳交易入场。
交易逻辑和机制 1. 动态范围计算 在运营时间内,EA 持续监控当前价格并计算运行价格与当日最高价和最低价之间的距离。 目标是确定价格是更接近当日最高价还是最低价,这决定了突破潜力。 2. 买入限价区域形成 如果当前价格与今日最低价之间的距离大于与最高价之间的距离,EA 会构建一个买入限价区域。 该区域从当前价格向下延伸至当日最低价,标记出可以下达买入限价订单的区域。 该区域内的确切切入点可通过用户设置菜单进行调整,允许交易者微调其切入策
Maedina Gold Scalper 是专门针对 XAUUSD / 黄金 的专家顾问。 该EA是 剥头皮式马丁格尔机器人。 该EA在市场波动条件下表现出色。 根据您的需求调整设置。在使用真实账户进行交易之前,请记得进行回测和前测。 请根据您的资金调整手数。 点差要求 2位数经纪人的点差不超过20,3位数经纪人的点差不超过200。 点差越低越好。 经纪人强制平仓水平 点差为20时,强制平仓水平≤30%。 点差为10时,强制平仓水平≤50%。 这意味着,如果您的黄金点差为20,并且您的经纪人强制平仓水平为50%,则不适合。您必须确保如果点差为20,则经纪人的强制平仓水平为30%或以下。如果您的点差为10,则经纪人的强制平仓水平最高可为50%。不得超过50%。 强制平仓水平越低越好。 资本和手数
最低资本为 3,000美元 或 3,000 USC (30美元) 。
推荐资本为 7,000美元 或 7,000 USC (70美元) 。
每7,000美元的余额0.01手。 每日更新:t.me/mgsdgs
FREE
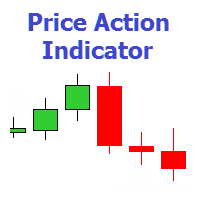
The indicator shows 7 patterns of the Price Action trading system, as well as the maximum and minimum price lines for the day. Timeframe: H1, H4, D1. Pin bar Outside Vertical Bar (OVB) Pivot Point Reversal (PPR) Closing Price Reversal (CPR) Double Extremums ( DMax/DMin ) Wide Range Bar (WRB) Inside Bar (IB) Settings PRICE ACTION PATTERNS Show Pin Bar Color Pin Bar - pointer arrow color. Show Outside Vertical Bar (OVB) Color Outside Vertical Bar - poin

當前價格 99 $ - 即將上漲 - Adding on the attractive price , I will give those who buy AMARIS an other SUCCESSFUL BREAKOUT EA for free
AMARIS EA 是一個全自動交易機器人,它使用非常成功的夜間剝頭皮策略,多年來證明了它的有效性,AMARIS 將僅在夜間非常安靜和雙小時使用大量過濾器、安全措施和止損進行交易,它可以在多種貨幣對上進行交易,從而獲利。
(低風險)* 現場表演: https://www.mql5.com/en/signals/1430368
推薦貨幣對:EURUSD;GBPUSD;AUDCAD;EURAUD;USDCAD;EURGBP;USDCHF;GBPCF;GBPCAD;GBPAUD;EURCAD
使用特點 Amaris 不使用任何風險策略,如 martingale、grid 等。
默認參數針對所有 Pairs 進行了優化。
機器人每晚可以進行多次交易,每筆交易都受到視覺止損和獲利追踪止損的保護。
有一個點差

MiloBot PRO 是一个先进的外汇专家顾问,基于一个独特的专有策略 它已经被开发、测试和优化了2年多的时间。该策略的可靠性在于,开发商的真实账户的存款总额超过10万美元。 独特的MiloBot PRO策略允许每个月获得稳定的利润,自定义指标允许EA在市场反转时刻尽可能精确地进入市场。 查看开发商当前的实时信号:
2019 年 11 月以来的账户(利润超过 +1520%): myfxbook.com/members/Malik87/robot-advisor-launched-november-11/3623023 Mql5 Signal : https://www.mql5.com/zh/signals/2379641
我們個人使用 MiloBot Pro 進行交易,因此我們不斷測試它,在 EA 中實施一些新的東西。 所有買家都將收到更新並使用最新和最可靠的顧問版本。 我叫 Sergey Ermolov ,是 MiloBot PRO 顧問開發團隊的負責人。 我只相信數字,而數字表明: 我们的MiloBot PRO专家顾问让你的年收益高达103%,包括资本重组 它平均每月完成

Hm(水平标记)专为水平水平的手动标记而设计。 标记包含级别及其价格值。 线的厚度和颜色以及价格值在设置中设置。 水平可以放置在本地的时间框架,或公开设置所有的时间框架。
他的工作很简单:
1)–按你在设置中设置的键来标记级别;
2)-我们将线路带到所需的位置;
3)–点击鼠标右键和水平链接。
在未来,这些水平可以移动和调整。
从图表中移除后,指标不会自行清理水平。 他们将不得不手动删除。
最有效的应用是一次在所选交易工具上使用具有不同设置的多个HMS。
输入:
线条样式-线条样式
线宽-线厚
标记样式-价格标签的大小
标记偏移(像素)-相对于屏幕左边缘的标记偏移
线条颜色-线条和标签的颜色
单独的时间帧-显示在单独的时间帧上,或显示在所有时间帧上
标记热键-设置级别的键
FREE
這個名為“MARTIN SMART”的 Expert Advisor 以 mar 原理工作,根據設置,它使用隨機信號進行入場。它的獨特之處在於,有 3 種選擇可以將交易轉移到收支平衡,並通過從市場的小幅調整中獲利來關閉負交易。 它既可以作為助手用於手動交易,也可以用於自動交易,具體取決於設置。 Zhège míng wèi “MARTIN SMART” de Expert Advisor yǐ mar yuánlǐ gōngzuò, gēnjù shèzhì, tā shǐyòng suíjī xìnhào jìnxíng rùchǎng. Tā de dútè zhī chù zàiyú, yǒu 3 zhǒng xuǎnzé kěyǐ jiāng jiāoyì zhuǎnyí dào shōu zhī pínghéng, bìng tōngguò cóng shìchǎng de xiǎofú tiáozhěng zhōng huò lì lái guānbì fù jiāoyì. Tā jì kěyǐ zuòwéi zhùshǒu yòng yú shǒudòng jiāoyì

用户手册:BOS Breakout Signal (OswalTrading) BOS Breakout Signal 是一款专为交易结构突破 (Break of Structure) 的交易者设计的高精度 MetaTrader 工具。该指标不会用随机信号使图表杂乱无章;相反,它使用优化的 ZigZag 算法过滤市场噪音,在确认突破之前仅识别最重要的支撑和阻力位。
1. 目的与运作原理 该系统充当结构扫描仪。启动时,指标可能不会立即显示信号,因为它需要价格形成清晰的波动。一旦市场建立了有效的反转形态,指标就会绘制不可见的“激活”水平。当价格果断突破这些水平时,就会产生入场信号。
2. 参数指南(输入菜单) ZigZag 算法配置 Depth(深度):决定波动的幅度。高值寻找主要趋势中的突破,而低值检测微观结构。 Deviation(偏差):调整标记新高或新低所需的百分比变化。 Backstep(回撤步长):控制峰值之间的最小蜡烛间隔,以避免在过度波动的市场中出现信号。 History Scan (Bars)(历史扫描):定义指标将处理多少根过去的蜡烛以显示交易历史。 警报管理 S
MetaTrader市场是 出售自动交易和技术指标的最好地方。
您只需要以一个有吸引力的设计和良好的描述为MetaTrader平台开发应用程序。我们将为您解释如何在市场发布您的产品将它提供给数以百万计的MetaTrader用户。
