适用于MetaTrader 4的付费技术指标 - 50


Royal Ace Signal 3 MA The Royal Ace Signal 3 MA indicator tracks the market trend with combine 3 MA. Amazingly easy to trade The indicator needs no optimization at all It implements a multi-timeframe dashboard The indicator is non-repainting
Anatomy of the Indicator The Royal Ace Signal 3 MA indicator displays a colored arrow. If the arrow is gold you should be looking for long trades, and if the arrow is red, you should be looking for short trades. Use this indicator in H1, H4 timeframe
Binary Monster FX is a ready-made trading system. The real-time indicator displays the profitability of its strategy on history. This allows you to choose the most profitable currency pair and evaluate the profitability immediately, even before the start of real trading. Features Ready trading system Displays Binary Monster FX strategy trading statistics for a given number of bars of historical data. Gives a visual and audible warning when a CALL or PUT signal appears. Warns before a signal abou

A trend indicator, the main direction of which is to display the possible direction of price movement. The price reversal occurs with the same patterns on the indicators. The indicator shows the possible direction of price movement. Signals are generated on the previous bar. Red Coogie - the signal is considered unconfirmed. The indicator works best on timeframes H1, H4 and D1.
This is one of the few indicators that can signal strength and direction, which makes it a very valuable tool for tr
DPOMASimple (DetrendPrice Oscillator) is an indicator that removes the price trend, in order to observe the cyclical movements of the price without the noise of the trend, the DPOMASimple indicator can be used to determine support and resistance levels in the peaks and valleys or as trading signal whe cross 0 level.
DPOMASimple > 0 -> Buy. DPOMASimple < 0 -> Sell.
Markets in range: Maximum and minimum will be the same as in the past. Set the overbought and oversold levels ba

Introducing the trend indicator! Ready trading system. The principle of the indicator is to automatically determine the current state of the market when placed on a chart. The indicator analyzes market dynamics for pivot points. Shows the favorable moments of entering the market with stripes. Can be used as a channel indicator or level indicator! This indicator allows you to analyze historical data, and on their basis display instructions to the trader on further actions. To find out how to dete

This indicator is based on the standard MACD indicator, but showing the changes up and down colored. It is a nice assistance to visualize our Expert MAGIC MACD.
MAGIC MACD MT4: https://www.mql5.com/en/accounting/buy/market/41144?period=0 MAGIC MACD MT5: https://www.mql5.com/en/accounting/buy/market/41151?period=0
Inputs in the Indicator: Fast EMA: standard is 12 Slow EMA: standard is 26 Signal: depending on what you want to see. For the MAGIC MACD the standard is 1
in common settings: Fixe

The indicator monitors the market trend with very high reliability. Sharp price fluctuations, as well as noise around averaged prices, are ignored. All intersection points will be ideal points at which the direction of the trend changes. Signal points, places where color changes, can be used as points of potential market reversal. This development can be used both for long-term trading, and for piping on small periods. The indiuctor algorithm implements a kind of technical analysis based on the

This Indicator calculates based on the Stochastic, Fractal and ZigZag the best possible entries in all timeframes.
Input Stochastic Oscillator K line period = standard is set to 10
D line period = standard is set to 3 slowing = standard is set to 4 Method = stadard is set to Linear weighted Price value = standard is set to close/close
ZigZig settings Depth = standard is set to 24 Deviation = standard is set to 5 Backstep = standard is set to 3 Bar filter = staard is set to 35
Alarm set

This indicator will provide you with everything you need in order to overcome losses due to human emotions. The indicator determines the moments of a trend reversal and the direction of its movements. This development is equipped with the most modern, adaptable trading algorithms. The main secret of short-term trading is to have information on when to enter a deal. The indicator works great on all timeframes and informs the trader about the most successful moments of buying or selling a currency

It can be used as an independent trading system. It is based on the idea that some currency pairs follow one another. The indicator allows you to simultaneously display several other charts on the chart of one currency pair, which allows you to anticipate some movements and fairly accurately determine the beginning of trends. The principle of trading according to indicator signals is also simple: you need to sell a currency pair whose chart is higher, and buy the lower one.

This indicator gives signals about a trend change, shows successful signals. High probability of a successful trend, it can be used with an optimal risk to profit ratio. The indicator does not redraw and is not late; it can be used both for piping on small periods and for long-term trading. The indicator algorithm works using open prices, and you can work with a zero bar. It works on all currency pairs and on all timeframes.

This is the FXTraderariel ATM Indicator - the best trend indicator we ever created. It shows different trend perfect and supereasy to Spot. Depending on the settings and trading style, it can be used for scalping or long-term trading . The indicator can be used on every time frame , but we advise to use it on , H4 and D1 . Especially if you are a novice trader. Pro Traders can also you use it for scalping in smaller timeframes (M1, M5 and M15). This indicator is not a complete trading s

Automatic marking of the chart with Pentagram models. This model is based on the Expansion Model from Adversa Tactics. Designed to determine the trend and predict possible levels and targets of price correction in the future. The model describes a developing trend. The trend is relevant until the price crosses the trend line of the model in the opposite direction. Levels of rays of the pentagram, level of HP, distances of 100% and 200% of the distance between points 1-4, levels of HP are possibl

This indicator will provide you with everything you need in order to overcome losses due to human emotions. The indicator determines the moments of a trend reversal and the direction of its movements. This development is equipped with the most modern, adaptable trading algorithms. The main secret of short-term trading is to have information on when to enter a deal. The indicator works great on all timeframes and informs the trader about the most successful moments of buying or selling a currency
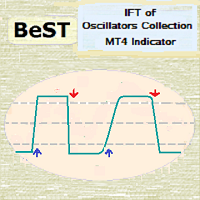
BeST_IFT of Oscillators Collection is a Composite MT4 Indicator that is based on the IFT (Inverse Fisher Transformation) applied to RSI , CCI , Stochastic and DeMarker Oscillators in order to find the best Entry and Exit points while using these Oscillators in our trading. The IFT was first used by John Ehlers to help clearly define the trigger points while using for this any common Oscillator ( TASC – May 2004 ). All Buy and Sell Signal s are derived by the Indicator’s crossings of the Buy or

The indicator ignores sharp fluctuations and market noise and tracks market trends with absolute reliability. It is suitable for trading on small timeframes and on large ones, it ignores sudden price spikes or price movement corrections due to the reduction of market noise around the average price value. For calculations, the indicator uses indicators: iLow, iHigh, iMA, iATR. Since the output signal relies on reliable indicators, it is also reliable. You can configure both a sound signal and se

Recently released !!!! Amazing !!!!! Free indicators for you !!!!!! Win operations with the power of the Macd multi timeframe indicator in a single window. Ideally you can complement it with our Rsi Multiframe to get powerful trades. . Give me 5 stars please Look at our signals made with our indicators. Very profitables - Soon Momentum Multi time frame !!!
https://www.mql5.com/es/signals/620506

可持续的分配可用于平滑财务系列。由于可以使用相当深的历史来计算分布参数,因此在某些情况下,与其他方法相比,这种平滑甚至更有效。
该图显示了H1时间框架内EUR-USD货币对的开盘价分布十年的示例(图1)。看起来很迷人,不是吗?
该指标的主要思想是通过价格分散来确定可持续分配的参数,然后使用这些数据来平滑财务序列。由于这种方法,在给定的市场情况下,平滑后的值将趋于最可能的价格值。
使用参数LB组态指示器的操作。它的值确定平滑序列的长度,以巴表示。允许值在1-255的范围内。
蓝线表示平滑的高价,红线表示低价,绿线表示收盘价。
该指标的主要缺点是无法设置平滑窗口的宽度,因此指标在历史记录的所有部分中均保持稳定。因此,交易者必须根据其特定要求选择参数。

MTF Qristalium箭头指标是一个半自动的现成交易系统。 它适用于所有货币对。
该指标使用三条规则:1)我们只交易趋势,2)"当每个人都卖出卖出,当每个人都买入卖出",3)价格总是违背人群。
MTF Qristalium箭头指标使用内置指标在多个时间周期上过滤这些规则。 如果趋势与所选时间间隔匹配,则指标将显示一个进入市场的箭头。 然后你自己做决定。 买-绿箭,卖-红箭头。 在指标中,您可以更改批次,设置EA的交易时间和关闭时间。 您还可以更改工作时间段和时间筛选器。 有一个蜂鸣声。
建议的工作周期D1。 滤波器H1和H4。
设置:
TF-工作期间(建议D1)
CCI_Period CCI LeveiUp CCI等级
CCI价格 SAR步骤
SAR最大值 TF Filter1-(推荐H1)
TF FiIter2-(推荐H4) 工作时间 声音使用 最大酒吧

One of the disadvantages of the ZigZag indicator when working with advisers is the need to find the latest extremes. For this purpose, various algorithms of history analysis in indicator buffers are used. However, the indicator itself knows these values and can therefore display them. To this target, the ZigZag Minimum indicator ( https://www.mql5.com/ru/market/product/37975 ) has been refined. The zero buffer stores the value of the last maximum. The first buffer stores the value of the last m
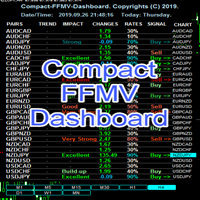
Compact FFMV Dashboard Compact FFMV Dashboard is a little trimmed custom indicator of FULL FOREX MARKET-VIEW DASHBOARD created to give the Traders a full view of what is going on in the market. It uses a real time data to access the market and display every bit of information needed to make a successful trading. It shows as many as 30 currency pairs or as allowed to display in the Market Watch of your MT4 USAGE: For Solo Trading For Basket Trading (See the screenshot on how) For Signal confirmat


我们的目标是提供无障碍和高质量的服务,使市场参与者、交易员和分析师都能获得及时的市场行情的交易决策所需的市场观察指标。 这是最优化,高度稳健和易于使用的动态趋势分析指标。 DYJ市场观察指标试图用两种不同的方法来衡量市场的看涨和看跌力量,每种方法都有一种。
该指标的熊市指数尝试衡量市场对价格下降趋势。
该指标的牛市指数尝试衡量市场对价格上涨趋势。
Pivot是市场观察指标的额外指标。Pivot含有6种策略:经典,卡玛瑞拉,无敌,斐波纳奇,网络布局,黄金分割. 另外点评里,采用多个辅助指标RSI,MACD,MA,布林带等过滤假信号. 我们的Pivot指标是基于先进的算法计算支点和支持和阻力水平。
它们对未来重要的价格水平和可能的市场逆转做出难以置信的准确预测。
适用于所有市场(外汇、大宗商品、股票、指数和其他)和时间框架。 特点: 同时监视所有对。 默认情况下,指标监视报价窗口的全部货币对。 它只从一个图(m1到mn)运行。 参数: inplanguage = english -- 英语或中文 InpCalculationMode = CALC_MODE_CLA

G99 GRAVITY
G99 Gravity is a channel indicator for the MetaTrader 4 terminal. This indicator allows finding the most probable trend reversal points. Unlike most channel indicators, G99 Gravity does not redraw. Attach the indicator to a chart, and the alert will trigger once a signal emerges. With our alerting system, you will never miss a single position opening signal! Advantages of the indicator Perfect for scalping. Excellent for identifying trend reversals. Suitable for beginners and expe

在做出交易决策时,不仅要依赖历史数据,而且还要依赖当前的市场状况,这很有用。为了使监视市场趋势的当前趋势更加方便,可以使用AIS Current Price Filter指示器。 该指标仅考虑一个方向或另一个方向上最重要的价格变化。因此,可以预测近期内的短期趋势-无论当前市场形势如何发展,当前价格迟早都会越过该指标的界限。从交易者的角度来看,最有趣的是价格已经尽可能远离指标水平的情况。这些时刻对于打开新的交易头寸可能是最理想的。 指标的操作不取决于所选的时间范围,而是使用两个参数进行配置。 FS -可以用来设置灵敏度阈值的参数。它越大,价格移动就应该越强,以便在指标中将其考虑在内。其可接受的值在0-255的范围内。如果选择零值,则灵敏度阈值将等于电流范围。 LB -设置在指标计算中使用的背景深度。此参数的有效值也在0到255的范围内。如果它等于零,则将考虑所有具有自学习控制的历史数据。并且,如果此参数等于1,则指标将仅标记FS参数指定的价格偏差。 其余参数使您可以配置图表上指标的显示。 Width -设置单个指示器线的粗细。 Color -指标线的颜色。 Style -指标显示样式。

«SMART EXIT» - уникальный индикатор высокой точности, созданный для профессиональной торговли на рынке Forex. Индикатор может работать на более чем 20 валютных парах и обеспечивает до 85% успешных сделок ежедневно. В среднем около 30 точных сигналов в неделю, никаких перерисовок или запаздываний. В своей стратегии индикатор использует лучший профессиональный алгоритм с уникальной логикой, который является эксклюзивной авторской разработкой среди всех существующих алгоритмов. Это торговая методик

Trading system for scalping. The indicator shows the direction of the price, the amplitude (channel) of its movement and the pivot point. The system automatically analyzes the market using the tick volume averaging algorithm for a certain period of time. After that, Scalper Thunder compares the data with other analysis indicators to identify potential pivot points. As soon as such a point is found, the indicator shows the price reversal and its current direction on the chart. The essence of trad

This is a convenient tool if you are used to trading on a clean chart, but sometimes you need to look at this indicator. If you are not sure how to determine the inflection point of a trend and are concerned about how to draw trend lines, then this indicator is for you. From now on, you do not need to sit near the computer and analyze the price, use this indicator carefully.
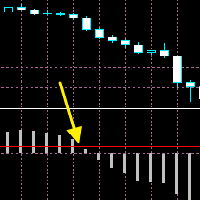
The moment when the MACD line crosses the signal line often leads to a significant price movement and trend changes. MACD Cross Prediction is an indicator that uses OSMA(MACD oscillator) and a red line. You can change the level of the red line on the indicator setting popup(and the red line moves up and down). The alerts(email, mobile push, sound, MT5 alert) will be sent when the MACD histogram touches the red line, which means the alerts can be sent just before/around the time when the MACD lin

This is a multicurrency and multitimeframe indicator that calculates the angle between two points. Points for measuring the angle can be taken from the ZigZag (the last two points), or from the Moving Average (between two given bars), or it can be the closing prices of bars.
Angle measurement is possible in degrees or in radians. You can select the scale for the calculation. For a better understanding of the indicator, you can study the free Angle High Low indicator. In the parameters you can

KT CCI Divergence shows the regular and hidden divergence created between the price and CCI oscillator. Divergence is one of the vital signals that depicts the upcoming price reversal in the market. Manually spotting the divergence between price and CCI can be a hectic and ambiguous task.
Limitations of KT CCI Divergence
Using the CCI divergence as a standalone entry signal can be risky. Every divergence can't be interpreted as a strong reversal signal. For better results, try to combine it
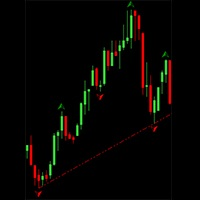
Классический фрактал отличается от остальных тем, что в бычьем фрактале экстремумы предыдущих баров последовательно растут, а экстремумы следующих баров последовательно снижаются. В медвежьем фрактале экстремумы предыдущих баров последовательно снижаются, а экстремумы следующих баров последовательно растут. На основании этих фракталов строятся трендовые линии, где сплошная линия является новой трендовой линией, а пунктирная, "пробитой" трендовой линией.
Параметры: История - Количество баров в

Not a logical continuation of the ZigZag indicator series is an indicator cut to an absolute minimum.
An important property of this indicator is that it will never redraw the value of a completed bar.
Based on previous indicator algorithms, e.g. ( https://www.mql5.com/ru/market/product/37975 ). Parameters: Depth - is depth of search of a local extremum in bars; On minute calc - is switching ON/OFF of calculation on minute bar (it is switched off - calculation on each tic).

This is a hybrid trend indicator, as it is based on the signals of elementary indicators and a special algorithm for analysis. The smart algorithm of the indicator determines the trend, filters out market noise and generates input signals. The indicator uses a color alarm: blue - when changing from descending to ascending, and red - on the contrary, to descending. You can use the indicator as the main indicator for determining the trend. The indicator can work both for entry points and as a filt

引入 布林带成交量突破检测器 ,这是一个强大的技术指标,旨在增强流行的 布林带突破策略 。该指标通过结合交易量数据将趋势跟踪提升到一个新的水平,有效地减少错误信号。该工具秉承“以量定价”的原则,使交易者能够识别伴随着成交量显着增加的价格突破,从而确保更准确的交易决策。该指标的可定制性使交易者能够利用大量数据微调他们自己的策略。 该指标的主要特点之一是其完全可定制的布林带,可根据个人喜好进行定制。此外,成交量数据的整合通过与移动平均线 (MA) 的颜色编码战斗直观地表示,从而可以轻松识别与 22 天平均线相关的成交量突破。交易者可以通过移动提醒、弹出消息和电子邮件提醒接收通知,通知他们成交量突破 22 天平均线以及价格突破上轨和下轨。可以根据偏好单独激活或停用每种通知方法。 为了进一步协助交易者,该指标在附加数据面板中显示相关数据,提供对市场动态的宝贵见解。此外,这种多功能工具适用于各种符号的应用,确保其在各种交易场景中的实用性。 该指标的参数提供了灵活性和对交易决策的控制。 Bollinger Signal Filter 允许用户选择移动平均线 (MA) 方法和 Applied Pri
True Pattern - индикатор автоматически ищет и анализирует фигуры технического анализа на графике такие как Флаг, Вымпел, Клин, Двойная вершина/дно. Отображает фигуру паттерном 1-2-3 и показывает потенциальные цели. Данный индикатор является хорошим помощником для торговли как новичку так и профессионалу. Помогает анализировать рынок, благодаря данному индикатору проще находить фигуры на графике. Определение момента входа и выхода производится самим трейдером, индикатор в данном вопросе может пр

KT Heiken Ashi Smoothed is a smoothed version of the standard Heiken Ashi. Moreover, it also plots buy/sell arrows on a trend change. A buy arrow is plotted when it change to a bullish state from bearish state. A sell arrow is plotted when it change to a bearish state from bullish state. Mobile notifications, Email, Sound and Pop-up alerts included.
What exactly is Heiken Ashi Smoothed? It filters out the false signals and noise in the standard Heiken Ashi. It applies the set of two moving a
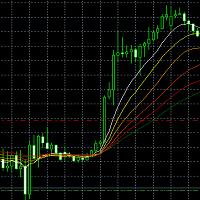
该指标为瀑布线指标,能较好的指示出当前趋势,适用于各个时间段,通过比较各个线之间的距离及倾斜程度可以判断当前趋势的强弱,也可以利用该曲线进行止盈止损的设定,需要更多拓展功能欢迎私信我。 瀑布线(PBX)是 欧美 国家九十年代初,广泛应用于金融领域中的判断 股价 运行趋势的主要分析方法,因此经由 汇聚 向下发散时呈瀑布状而得名。属于传统大势价格 趋势线 ,它的真正名称叫做非线性 加权移动平均线 ,是由六条非线性加权移动平均线组合而成,每条平均线分别代表着不同时间周期的股价成本状况,方便进行对比分析。 瀑布线是一种中线指标,一般用来研究股价的中期走势,与普通均线系统相比较,它具有反应速度快,给出的买卖点明确的特点,并能过滤掉盘中主力震仓洗盘或下跌行情中的小幅反弹,可直观有效地把握住大盘和个股的运动趋势,是目前判断大势和个股股价运行趋势颇为有效的均线系统。 瀑布线的优点还在于其不会类似其他指标那样频繁发出信号,瀑布线的买卖信号出现并不多,如果瀑布线给出了买入或卖出信号,只要按照其应用原则去做,就一定会取得较好的投资收益。 在趋势明显的上涨或下跌趋势中

本指标可回溯历史交易,可以一目了然的看到交易位置,交易类型及盈亏情况,还有统计信息。 showlabel用于是否显示统计信息,summary_from是订单统计的开始时间,该参数以订单开仓时间为准。 回溯历史可以帮助我们纠正曾经错误的交易习惯,对于学习手动交易的新手极为重要。 本指标适用于各个时间周期,通过交易标识和划线能非常明显地看出各个订单的具体交易情况,可作为信号卖家的辅助工具使用。 即使加载到当前图标中也能实时看到当前订单的下单位置及盈亏情况。 即使加载到当前图标中也能实时看到当前订单的下单位置及盈亏情况。 本指标可回溯历史交易,可以一目了然的看到交易位置,交易类型及盈亏情况,还有统计信息。 showlabel用于是否显示统计信息,summary_from是订单统计的开始时间,该参数以订单开仓时间为准。 回溯历史可以帮助我们纠正曾经错误的交易习惯,对于学习手动交易的新手极为重要。 本指标适用于各个时间周期,通过交易标识和划线能非常明显地看出各个订单的具体交易情况,可作为信号卖家的辅助工具使用。

KT MA Crossover draws the buy and sell arrows based on the crossover of chosen moving averages. Moreover, it also generates the appropriate alerts and displays the MFE (Most Favorable Excursion) for each successive signal. The moving average crossover is one of the primary strategies followed by traders around the world. Usually, it consists of a fast and slow moving average to find a buy and sell entry signal according to the crossover direction. Buy signal - when fast MA crosses above the slo

EZT Trade History This is a great tool to analyze past trades or follow current ongoing trades, especially when you using an EA to manage your transactions. You will see the exact candle where the trade was opened and closed. Collapsible floating panel on the chart, free to move anywhere with your mouse. When you using multiple EA’s with different magic numbers, you have 5 options to separate those trades, so you will know which EA opened specific transactions. You can set the day limits how fa
The proposed indicator is based on the ZigZag Mini Extra indicator ( https://www.mql5.com/ru/market/product/42632 ).
Unlike the prototype can be built at the price of Close or High-Low with the established timeframe.
The prices of the current timeframe will be used when calculating the indicator on the highest timeframes at Close price, .
Indicator parameters:
ZigZag TimeFrame = PERIOD_CURRENT - operating time frame (must be equal or more than current timeframe);
Depth = 12 - depth of

KT Round Numbers plots the round number levels which are also commonly known as psychological levels in the Forex world. In the context of Forex trading, round number levels are those levels in which there are two or more zeroes at the end. They are named as 00 levels on the chart.
Some traders also consider the halfway points as a valid round number level. They are named as 50 levels on the chart.
Use of round number levels in trading Round number levels work as strong support and resistan
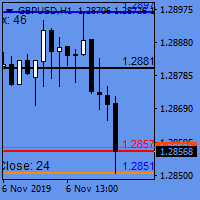
Open close levels
Open close levels - is an indicator for MetaTrader 4, which displays High/Low, Open/Close, ATR levels (set manually) of the day, week, month on the chart. Marks round levels, signs the days of the week, numbers every week. All levels are marked with price tags with a price symbol. Also, the indicator automatically calculates and displays on the chart the distance that the price has passed from High to Low and from Open to Close by day, week and month.
The indicator display
the best indicator to put your own fingerprint on your products, put your signature and protect your rights easily and simply. You can customize any program (indicator, Expert or script) by choosing your own signature and your favorite color, adjust the indicator properties to suit your needs, and change your signature at any moment you want with this wonderful indicator.
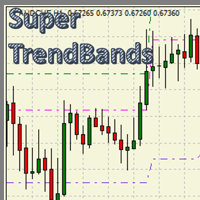
Super Trend Bands An indicator based on MaSuperTrend , taking advantage of the calculations obtained in order to logically distribute a series of channels that accompany the price during its tour, thus facilitating trade areas with a calculated risk and objective. With great adaptability in any type of financial asset and with a potential for visual simplification in the chart, which will make the chart a simple worktable. A custom indicator: - For MT4 desktop platform. - Great for Day trading,
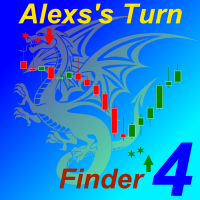
This indicator finds local extremes and indicates the beginning of a new short-term trend. A great tool for intraday and short-term trading.
The indicator finds the likely pivot points of the price and shows them on the chart with asterisks. After confirming the reversal, arrows are displayed on the chart that serve as Buy and Sell signals.
Both asterisks and arrows are formed only after the candle or bar closes. This reduces the number of false signals and significantly increases the a
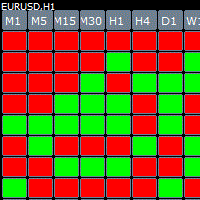
Cube indicator represents the original candle stick chart but in a top down cube form in order to see previous patterns in the markets more easy. The indicator has build in alert once there is a consecutive 3,4,5 bars in a row you get an message.
Parameters Bars_Limit = total visible cubes
TF_M1 = true; TF_M5 = true; TF_M15 = true; TF_M30 = true; TF_H1 = true; TF_H4 = true; TF_D1 = true; TF_W1 = true; TF_MN1 = true; Table_Position_X = 20; Horizontal shift Table_Position_Y = 40; Vertica
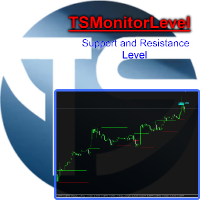
Indicator, which draws supports and resistances. Algorithm that calculates the entry zone of the position and the possible target. The benefits you get: Never redesigns, does not retreat, never recalculates. Works on forex and CFD, timeframe from M1 to Weekly. Integrated pop-up, push notification and sound alerts. Easy to use.
Parameters: SENSIBILITY = indicates the importance of levels, we recommend a minimum value of 1.0
PERIOD_BAR = indicates how many bars are considered for volatility,
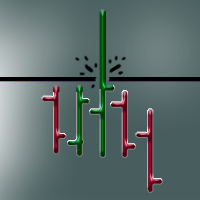
Панель предназначена для быстрого визуального нахождения и отображения ложных пробоев по всем периодам и на любых выбранных валютных парах одновременно . Цвет сигнальных кнопок , указывает на направление возможного движения . По клику на сигнальную кнопку , осуществляется открытие графика с данным паттерном . Отключить не используемые периоды , можно кликом по его заголовку . Кнопка "All" открывает графики всех сигналов по данному периоду . Имеется поиск в истории ( по предыдущим барам ). Прокру

The indicator calculates the saturation levels of the price chart. A signal to exit the resale area is a buy signal. A signal to exit the overbought area is a sell signal. Usually, you need to set relative values for the overbought and oversold levels of Bottom and Top - for this indicator.
Most often, a good trend is visible on the price chart visually. But an experienced trader must clearly understand the current balance of power in the market before entering. And the indicator will help

This indicator can track the steady price movement in a certain direction. In this case, the movement itself can be downward, upward or lateral, when the market movement does not have a pronounced focus. The indicator works on the basis of two moving average as well as an oscillator. Using the signal search algorithm, the indicator generates signals in the form of arrows.
Benefits. Allows you to determine the current trend. You can quickly enough understand which particular trend is currently

Dolphin Bands indicator works equally well on any timeframes. For medium-duration trends, it is recommended to use the standard setting. To study long-term trends, it is recommended to use an indicator value greater than the standard. To analyze short-term trends, it is better to use a lower indicator value. Most often, an exponential method is used to calculate the indicator, but other varieties can also be used.
Dolphin Bands is a collection of lines. The two center lines of the indicator a

Special Volume - Volume indicator, in the Forex market volumes are peculiar (teak). Why is Forex not possible to track normal volumes? The fact is that it is an OTC market. Therefore, it is practically not realistic to calculate the volume of purchases and sales by one instrument. Many Forex traders completely abandon volume indicators in their work. But for those who want to use them, there are some interesting tools, and one of them is Special Volume. The Special Volume indicator shows the ave

Martingals indicator works on all currency pairs and on all timeframes. The arrows indicate the optimal entry points for future Martingale averaging, even with a zero exponent. The indicator shows a signal to close the series only if all previous signals can be closed in profit. After closing a series in profit, you need to immediately open an order in the direction of the signal. Thus, the close signal is at the same time the reverse opening point to the other side of the new order. The probabi
Introduction
Ultimate Arrows Prognosis is a unique indicator, in which the signals are actually rendered without delay! This fact, unlike other indicators, allows traders to respond to the current market situation and achieve to high quality and efficient analyzes.
This indicator does not redraw and never changes the previous signals! And so, you know, that every signals, which is possible to see in history, will this unique indicator show exactly the same in the future. With this indicato

Direction Trend indicator. Shows the direction of the current trend. Colors bars in red and blue. It works on all currency pairs and on all timeframes. Do not forget that the approach should be comprehensive, indicator signals require additional information to enter the market. The principle of the indicator is that when placed on a chart, it automatically determines the current state of the market, analyzes historical data, based on historical data.
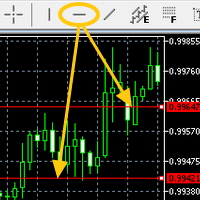
Attach the indicator on the chart and draw the red line from the button on MT4's built-in menu bar then the alert will be sent to you(push,email,popup and sound)
Hi You all know the red line (the MT4 built-in red line) drawn from the menu bar on MT5. It is often used to check the resistance etc.....It is very useful but it is little troublesome to get an alert(sound, push, email and popup) when the red line is touched by the price. Here is Price Touch Alert indication, just use the button t

A unique multicurrency and multi-timeframe strategy developed by a team of LATAlab specialists. Strategy Profit Creator by LATAlab has been tested and verified by our team. This will allow you to earn maximum profit comfortably and efficiently. Strategy features Profit Creator by LATAlab never redraws. Works on any trading symbol. Time frame - from M1 to MN. Automatically detects Buy, Sell, Take Profit, Stop Loss levels. The indicator is equipped with a convenient information panel in which all

Galactic Volume spread analysis (VSA), is an indicator designed for the visualization of the Volume, and the proportion in which it affects the volatility of the spread of the different pairs.
The strategy consists of the following:
Bull Trend: Always going in favor of the trend, open buying operations at the lows of the trend, provided that it coincides with a high volume shown by the Galactic VSA indicator. Downtrend: Always going in favor of the trend, open sales operations at the highs

Despite the popularity of inside bar pattern among the traders, using it as a standalone signal doesn't provide any edge in the market.
KT Inside Bar Advanced indicator solves this problem by combining the classic inside bar pattern with the "ECE" cycle and Fibonacci extensions. Using this indicator in place of our classic inside bar indicator will provide a tremendous advantage and edge in the market.
What is the ECE cycle?
In financial markets, the price never moves in a straight line bu

Auto redrawn Pivot support resistance horizontal lines with signal of Buy/Sell possibilities with SL level and with trend support resistance lines too used for all symbols and time frames you can adjust inputs parameters (only 2) and test it on various symbols and time frames input number of bars for calculation and moving average for signal accuracy example : use it on M30 time frame with input 200 for bars count and 100 for MA

Smart and simple Indicator based on wolves waves reversal pattern also near to falling and rising wedge and butterfly patterns with Stoploss and entry signal preferred time frame M30 : with parameters bars count used for calculation = 200 and moving average for accuracy = 100; you can try it for other higher or lower parameters and try your own set of inputs higher timeframe = lower input !!! important note ::: Indicator don't back draw when first installed on Chart
once installed wait for new

This Indicator provides Buy/Sell Signal based on calculations on Higher frame (Trend) and Lower frame(Entry signals) * You should select the higher and lower frame for indicator calculations * You select the Trend line colors as you prefer * Enable or disable Alerts! Trend lines UP/Down are drawn when a trend is detected Wait for small arrows for entry : *Normally an UP arrow in an UP Trend is a BUY signal : ---you Close the BUY position IF a Reverse DOWN Trend signal appears Or when Up trend li

Trend Sniper Super Indicator is one of the best indicator which can provide you will perfect signals for short term and long term trades. This indicator is suitable for both scalping and swing trading strategies. The indicator is over 85% accurate. It uses terminal Message Alerts, Emails and Push notifications to your mobile device to inform you about the new trading opportunities and it will calculate the take profit and stop loss level for you. All you will need to do is to place a trade. Subs
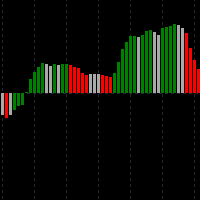
Hybrid MacdAO - индикатор, сделанный на базе двух популярных индикаторов: MACD + AO. Он вобрал в себя их лучшие качества, но при этом лишен недостатков. Предназначен для ручной торговли по тренду. Отлично показывает усиление, замедление текущего движения цены. Также будет хорошим помощником, кто торгует по дивергенциям (довольно точно показывает нужную точку входа в позицию сменой цвета гистограммы). Есть алерт-система (чтобы вы не сидели постоянно возле монитора). Преимущества перед стандартны

The universal indicator Diamond Grail which received such a name is not so simple!
The indicator has been tested for over a year by our experts!
One of the best arrow indicators that is perfect for binary options and forex trading,
If you trade on binary options, the best ragtime for it is from 3 minutes to a maximum of 5 minutes
An arrow appears on the previous candle.
If you trade forex, then the opening time from candle to candle
Forex result From 40 To 1324 pips!
Profitability
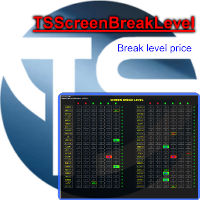
Indicator, which draws supports and resistances that have been broken. Intelligent algorithm for scalper and intraday traders. Multi time frame and multi currency panel. The benefits you get Never redesigns, does not retreat, never recalculates. Works on forex and CFD, timeframe from M5 to Daily. Integrated pop-up, push notification and sound alerts. Easy to use. Parameters input int Number_Instrument = 10; Number of crosses present in your panel SENSIBILITY = 1; indicates the imp
Smart Breakout Indicator determines support and resistance levels and also shows the breakout points of the levels in the form of a histogram.
The program contains two indicators in one: 1-support and resistance lines, 2-histogram indicator based on high price fluctuations. The indicator autonomously calculates the best support and resistance levels and also in the form of a histogram shows the best moments of the breakdown of the lines.
The histogram indicator is based on the action of
MetaTrader市场是 出售自动交易和技术指标的最好地方。
您只需要以一个有吸引力的设计和良好的描述为MetaTrader平台开发应用程序。我们将为您解释如何在市场发布您的产品将它提供给数以百万计的MetaTrader用户。
您错过了交易机会:
- 免费交易应用程序
- 8,000+信号可供复制
- 探索金融市场的经济新闻
注册
登录