适用于MetaTrader 4的付费技术指标 - 45

vIntelligent algorithm of the indicator TrendWX with accuracy generates input signals and output levels. Strategy for trading on trend, filtering and all the necessary functions built into one tool! The principle of the indicator is to automatically determine the current state of the market, analyze historical data, based on historical data, and display to the trader instructions for further actions. The system itself shows in the form of arrows when to buy and when to sell.
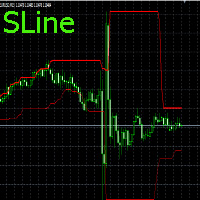
Входные параметры отсутствуют.По индикатору просто определять направление движения цены.Если линии сходятся,то используем ордера на пробой,если расходятся используем SELL,BUY,SELLLIMIT,BUYLIMIT.Работает на любых периодах.С любыми парами.Для нахождения минимального и максимального расстояния между линиями,нужно использовать инструмент"перекрестие".Для пары EURUSD на периоде М15,можно применять значения :для схождения <80 п.п.,а максимальное >500-800 п.п. Удачи в торговле!!! There are no input
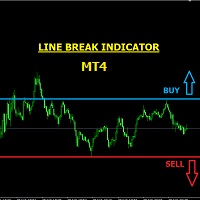
LINE BREAK INDICATOR This is a semi-automatic indicator that shows buy and sell arrows when your trendline (or horizontal line) is broken. You must first draw your lines, it will alert you of breaks through email, pop-ups, etc. It is important that you use just two main lines to avoid confusion, because the indicator signals BUY when the upper trendline or upper horizontal line is broken, and it signals SELL when the lower trendline or lower horizontal line is broken. It can be used for any curr

This indicator show you the begin of the Trend by drawing (Up/Down) arrow. It works using compatibility of current fame and the next 3 frames to make it more professional and more profitable. Features:- Simply it gives you entry point as arrow (Buy / Sell) after candle closed. You can use it on time frames ( M1 , M5 , M15 , M30 ) are more profitable. You can use it on any currencies pair. It is historical indicator. No Repaint. No additional indicator needed. Easy to use.
Indicator parameters:

A technical indicator that displays information about the trading volume in the form of a histogram of distribution by price levels. It is used as an independent indicator that helps to evaluate the current objective situation of the instrument, as well as in the format of integration with other methods of analysis, to confirm or filter when making trading decisions. Key Features:
Interactive profile update, real-time work Five modes of histogram calculation The possibility of separating the vo
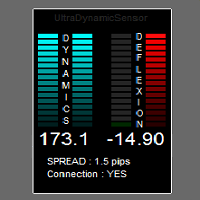
The purpose of the indicator is to measure the dynamics of price movement, capturing sudden acceleration,
and examination of the direction in which the price is moving.
Indicator due to its nature, is dedicated to TimeFrame M1, but it can be freely used on higher TF'ach.
Calculation and display will be identical to the M1.
Indicator all calculations done on ticks, ie single price movements.
Are not taken into account the conditions candle (the color of the candle, the candle shape, values
DAY BREAK INDICATOR
NB: THIS INDICATOR SHOWS MUCH DETAILS AND CORRECT SIGNALS ONLY ON THE CURRENT DAY'S CHART. PAST CHARTS AND STRATEGY TESTER DOESN'T SHOW MUCH POTENTIAL. It is an indicator for the current day's market purposely. This is an arbitrary Asian support and resistance breakout indicator for the current day only. Signals are no more valid for the next day ONLY FOR SCALPING AND INTRADAY TRADING. It signals in the direction of only the intraday trend. It should never be used for swing
首先,我要感謝大家“Adamant Levels Logic A”取得的巨大成功
有關邏輯A的更多詳細信息,請參閱以下鏈接:
https://www.mql5.com/en/market/product/36082
在成功之後,我很有信心,這個“Adamant Levels Logic B”指標也將在您成功的交易運營商中發揮重要作用。
堅定級別簡介:
免責聲明: 如果您正在尋找一個花哨,色彩鮮豔,引人注目的指示,請遠離。
沒有考慮價格可以保持,反彈或突破的水平,任何交易者都不能成為一個好交易者。
這些水平幫助交易者以更便宜的價格進入市場。它們可以是支撐阻力,需求供給,支點,斐波納契水平等。
經過多年對價格圖表的研究和分析,我發現很少有復雜的算法和邏輯來找出未來可能的價格行為。
在某些價格點上應用這些邏輯和算法,我達到了價格可以反彈或突破的水平。
我將它們命名為“Adamant Levels”。
是的,它們本質上是堅定的和靜態的。
價格被這些水平吸引並擊退。
這些是未來的價格行為水平,交易者

该指标是基于中值和移动平均特性的组合的顺序混合滤波器。
使用中值允许滤除价格序列值中的异常异常值和随机脉冲。同时,中值滤波器不会对价格变动的趋势起作用,而是保持不变。 由于中值滤波器是非线性的,因此使用简单移动平均值进行平均来平滑其值。这种方法使我们不仅可以更准确地识别趋势,还可以更准确地识别价格变动中的周期性成分。此外,它还增加了指标对价格变化的敏感度,并减少了价格序列与指标读数之间的延迟。因此,指标可以相当准确地警告新趋势的开始,以及旧趋势的结束。
您可以使用 FL 参数调整滤波器的深度及其灵敏度。其允许值为0到63.同时, 2 * FL + 1 条用于计算指标值。因此,FL值越大,指标显示价格图表的趋势越强。

This indikator is used as a supporting indicator. its function is to find out the position of the price reflection position, but he cannot work alone, requires another set of indicators which will immediately be sold separately
The principle of Supply And Demand can be used as a forex trading analysis tool. One way to use it is to rely on the balance zone as zone stops Supply And Demand and the trading system applied, as well as the legal basis for general supply and demand.

Arrow indicator, for timely entry on price reversals The arrow appears on the closed bar and does not disappear. Allows you to enter the transaction at the very beginning of the movement Can be used on any currency pairs, metals and cryptocurrency Suitable for working with binary options
Distinctive features Does not redraw; Determines the price correction; Advanced settings for fine tuning; Works on all timeframes and on all symbols; Suitable for trading currencies, metals, options and crypto

Demark Sequential - is an indicator that shows a structure of the trend, its start point and main turning points. And it check it's conditions on the beginning of the candle, so it will be never repainted.
This indicator hasn't any complex formulas, only some bars countdown, but it can be very helpful, especially with some levels indicator such as Fibo or Gann levels (like this ). Algorithm is so simple, but powerful: Setup - starting when current bar closed higher (or lower for short) then clo

Pattern Explorer is a reliable tool for applying all the power of the most popular Japanese Candlestick Patterns . It uses Machine Learning algorithms to confirm all the patterns. What is the most impressive thing about it? Select Take Profit and Stop Loss and click on “Backtest your strategy” button to backtest your strategy in real time and to see according to your selection: Total signals Testable signals (signals that are reliable to be tested) Profitable signals (%) Loss signals (%) T

T-Explorer is a Real Time Optimized MetaTrader 4 tool that provides tradable information based on the 10 of the most popular and reliable technical indicators in many timeframes. Our machine learning models calculate the optimum rules and configuration for each indicator in order to provide high probability signals of success. Users are able to customize T-Explorer by selecting suitable timeframes and mode ( FAST, MEDIUM, SLOW ) for the indicators to be used. T-Explorer aggregates an

Currency Explorer is the absolute tool for traders that want to know with quantified certainty the currency strength & weakness of each currency and to trade these by using applicable strategies. Our machine learning models run and provide the strength/weakness of each currency based on multiple factors besides price action. It provides the trader with a QUANTIFIED result for the strength of the 8 most popular and major currencies (EUR, USD, JPY, GBP, AUD, NZD, CAD and CHF) with a scale

Introducing AMAN Signals.
An MT4 Indicator that predicts the trend where the prices are heading!
Indicator parameters Period 1 : the number of bars used for the indicator calculations. Proper values - Above 21. Multiplier 1 : Proper values - from: 5. Period 2 : the number of bars used for the indicator calculations. Proper values - Above 21. Multiplier 1 : Proper values - from: 5. Using the AMAN Signals FAST Indicator: Green: Buy or Bullish Candle Red: Sell or Bearish Candle Strength Percent

该指标是两个改进的Lanczos滤波器的组合。 第一个过滤器用于推断价格。根据过去的价值,他预测当前柱内可能的价格变动。也就是说,它表明如果过去的趋势保持不变,价格会是多少。 第二个过滤器,用于平滑和平均窗口内的价格,由过滤器的级别决定。由于选择了权重,此过滤器最积极地响应价格变动中存在的周期性组件。 可以使用EF和IF参数调整指标。通过选择 EF 和 IF 的值,您可以获得有关趋势价格变动开始的信号。 EF - 指数滤波器的窗口大小。有效值为 EF = 0 ... 255 。并且在计算期间处理的条数是 2 * EF + 1 。该参数越大,价格序列的过去价值的影响越大。结果以实线绘制。 IF - 调整平均窗口的大小。 IF = 0 ... 255 的值。要计算的条数是 2 * IF + 1 。 IF 值越大,使用此过滤器检测到价格变动的较长时段。结果以虚线显示在图表上。
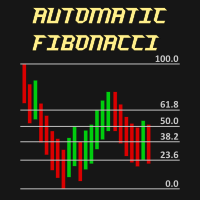
Automatic Fibonacci is an indicator for automatic Fibonacci Levels drawing. It is fully customizable by user. User can also select different Fibobonacci Levels by user settings or can use multiple Automatic Fibonacci indicator in one chart.
All details can be found >>HERE<<
Instructions Move Indicator to the chart (simply drag and drop) When pop up window appears select desired settings. Confirm settings and enjoy the Automatic Fibonacci indicator.
Features Any chart Any time-frame C

Speed Master - трендовый индикатор, сигналы которого отображаются в виде гистограммы, и нескольких видов стрелок на ценовом графике. Показания индикатора основаны на идентичных расчетах индикатора Speed Trend - https://www.mql5.com/ru/market/product/36524#!tab=tab_p_overview , за исключением того, что данный индикатор рассчитывает вместо одного, три указанных периода на текущем таймфрейме, и на их основе отображает сигналы в направлении от старшего периода к меньшему. Speed Master - подходи
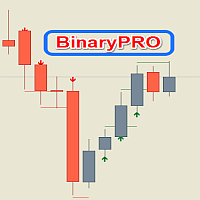
BinaryPRO- is a multi-currency and multi-timeframe signal indicator, created according to the author's algorithm. It produces high-quality and timely trading signals in the form of arrows on any financial assets traded on Meta Trader 4. It is a good alternative to paid signal services. The indicator can be used with any broker (with 4/5-digit quotes). The received trading signals can and should be used when trading binary options and cryptocurrency.
Advantages of BinaryPRO: accurately shows th

ShangXia-指标适合所有的周期使用,也适合所有的市场品种。
【ShangXia】向上的箭头是(Buy)信号。 【ShangXia】向下的箭头是(Sell)信号。 【ShangXia】可以在参数里面设置(Alert、Send mail、Send notification),设置为(true)就可以发送即时信号到警报窗口、电子邮件、即时消息。 参数设置说明: 【alert_NO_OFF】:这是警报开关,设置成true,如果出现箭头就会自动警报提示;设置成false,则不会警报提示。 【sendmail_NO_OFF】:这是发送邮件的开关,设置成true,如果出现箭头就会发送邮件到你在MT4设置好的邮箱里面;设置成false,则不会发邮件。 【sendnotification_NO_OFF】:这是发送即时消息的开关,设置成true,如果出现箭头就会发送消息到你的移动设备;设置成false,则不会发消息。 更多好用的指标网址: https://www.mql5.com/en/users/zhengqiuyang/seller

Intraday Volume Profile Forex MT4 Intraday Volume Profile - This is a visualization tool for understanding the high activity zone and low activity zone, as part of the D1 senior timeframe. The volume profile provides an excellent visual image of supply / demand at each price for the selected timeframe. Introducing POC - Point of Control, which indicates the price at which the maximum volume was sold, as well as Value Area - the area where 68% of the instrument's assets are traded. POC -

【ZhiBiCCI】指标适合所有的周期使用,也适合所有的市场品种。 【ZhiBiCCI】绿色实线是逆转看涨背离。绿色虚线是经典的看涨背离。 【ZhiBiCCI】向红色实线是反向看跌背离。红色虚线是古典看跌背离。 【ZhiBiCCI】可以在参数里面设置(Alert、Send mail、Send notification),设置为(true)就可以发送即时信号到警报窗口、电子邮件、即时消息。 参数设置说明: 【displayAlert】:这是警报开关,设置成true,如果出现箭头就会自动警报提示;设置成false,则不会警报提示。 【sendmail_NO_OFF】:这是发送邮件的开关,设置成true,如果出现箭头就会发送邮件到你在MT4设置好的邮箱里面;设置成false,则不会发邮件。 【sendnotification_NO_OFF】:这是发送即时消息的开关,设置成true,如果出现箭头就会发送消息到你的移动设备;设置成false,则不会发消息。 更多好用的指标网址: https://www.mql5.com/en/users/zhengqiuyang/seller
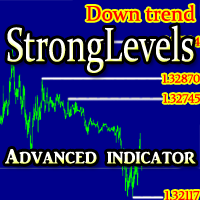
The indicator determines and reflects the significant support / resistance levels based on the algorithm for determining the volatility and the pattern in which the body of the candle is more than 2 times smaller than the size of the candle.
In addition, based on the received data, the indicator determines the prevailing current market movement. Settings: TimeFrame - timeframe to calculate; Candles in history - How many candles to take for analysis; Line color - the color of the support / resi

Scalping monster - ready trading system in the form of an indicator. Scalping monster is designed for the Metatrader4 platform. When placed on a forex chart, the indicator automatically analyzes the market using an adaptation algorithm and displays the signals to the trader in the form of red and blue dots. The indicator also shows in the upper right corner information about potential profit / loss.
Our other products at https://www.mql5.com/en/users/master-mql4/seller
How to trade usi
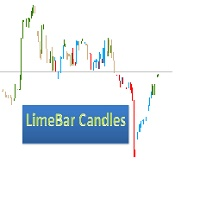
Colored candlesticks showing the trend. Based on the price action, it shows the trend and the possible moment of reversal.
No settings required. You can change the colors according to your preference.
Red and green show a trend beginning. The other two colors indicate a withdrawal or a contratrend. The indicator is used with resistance or support analysis. Make sure you use SL and TP, according to the price action.
KijunSen vs Price Ichimoku Strategy MM Description in English and Italian =
This Indicator is based on one of the Strategies with Ichimoku Indicator, in particular is the cross of the KijunSen with the Current Price; it will give you of Buy and Sell when they Cross, with Arrows and Alerts.
When you attach the indicator on the chart , a window will open where , in the INPUT section, you can also choose to change the main Ichimoku values.
SIGNAL INPUT =
· BUY = when Price cross above

The principle of the indicator. A simple moving average (SMA) with an averaging period (2n + 1) of bars is always obtained lagging by n bars. If SMA or other types of moving averages are the basis for making trading decisions, then their strong delay does not allow to open positions in time and close positions, which leads to losses. The Estimation moving average without lag ( EMAWL ) indicator calculates the non-lagging moving average, which is calcula

BeST_Chande TrendScore Indicator points the start of a trend with high degree of accuracy and it is amazing for scalping on the 1min timeframe. It is also a simple way to rate trend strength. It indicates both the direction and strength of a trend and can be easily combined with various trend-following, swing and scalping strategies. As of a trend’s direction and strength a value of +10 signals a strong uptrend while a value of -10 signals a strong downtrend. Generally a positive score show
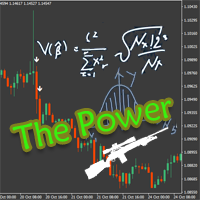
The Power 通过价格突破幅度与前期一段行情平均振幅比值计算多空力量强度,力度较强时则在图表上出现信号提示,以此预估下一波行情的涨跌方向。 指标没有未来函数,所有的信号出现后都不会移动或者消失,具有很好的实盘参考价值。 指标参数允许用户做个性化调整。 来自作者的更多EA和指标 https://www.mql5.com/zh/users/chenshaofei/seller
指标优势: 1、带有通道突破计算方案,短期的反弹不会干扰信号方向,有效过滤回调行情。 2、突破力度需要达到一定强度才会出信号,有效过滤假突破行情。 3、通道计算带平移指数,可有效识别巨幅V型反转。
参数说明:
FastMove - 短期波动幅度 SlowMove - 长期波动幅度 Shift - 平移指数(长期波幅统计偏移K线数) Power - 波动力量系数 BreakoutRange - 有效突破范围

Каждый трейдер должен периодически проводить анализ результатов своей работы на валютном рынке, чтобы выявить сильные и слабые стороны своей системы. Для этого было бы не плохо видеть всю статистику в понятных глазу цифрах, желательно объединенных в табличную форму, чтобы оценка стала более детальной, была возможность узнать текущую доходность, просадку, профит фактор и многие другие характеристики. Существует множество серверов в интернете, которые могут создать мониторинг вашей торговли, обр

This indicator displays entry points in the market where to open your positions. The indicator is based on Parabolic, SuperTrend and Bollinger Bands to increase profitability and reduce the number of losing trades. It helps to find breakout of the support or resistance line and shows where to enter the market. The dashboard shows the results of the indicator (total pips win, loss, % of win and so on). The notification of entry points comes to the phone. It uses closed bars, no tick data. When yo
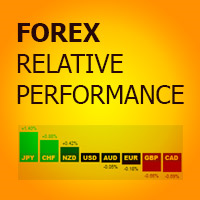
Forex Relative Performance indicator This indicator calculates the relative strength of major currencies against the US dollar. The basic idea behind this indicator is "to buy strong currency and to sell weak currency". This indicator allows you to quickly identify the best forex pair to trade according to your trading style (Intraday, Scalping, Swing, or Long Term) For demo testing please use MT5 version, because MT4 does not support Multicurrency Testing https://www.mql5.com/en/market/product/

SpeedChan Leading indicator. Marks in the future two price channels - if the price comes into the channel, then the quote changes with the speed specified in the parameters. In these areas, price reversals are most likely. Two price channels are displayed - one on top, showing the growth rate; the second one - below, shows the speed of the fall. Channels are displayed as a solid center line and two borders drawn with a dotted line. In many cases, the area between the channels is not important fo

the indicator showed excellent results in the scalping trade, and the same excellent results in the trading of exact instruments led to the fact that of these indicators showed themselves perfectly during the exit from the news with an during low volatility, This instrument has been tested for more than 1 month. What can we say about the number? It is reliable, accurate, at any time of trading. Atom Pro Maximum, this indicator showed excellent results in scalping trading. The accuracy of this
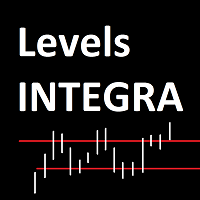
Levels_INTEGRA - это алгоритм глубокого сканирования рынка и вычленения наиболее важных ценовых уровней.
Параметры HISTORY_D1 - Глубина сканирования на Дневном графике. Color_Levels - Цвет уровней. Width_Levels - Толщина уровней. Selection_PRIORITY - Возможность выделения цветом приоритетных уровней (true - уровень выделен, false - выделение отсутствует). Color_PRIORITY - Цвет выделе

Это продвинутая версия продукта, бесплатная версия находится здесь .
Индикатор предназначен для торговли внутри дня. Строит канал по пробою крайних уровней которого вы можете открывать ордер на покупку или продажу. Во флетовом рынке работа ведётся на отбой от этих уровней. Для фильтрации входов используется цветная гибридная скользящая средняя. Настройки по умолчанию предназначены для терминального времени GMT +3 (подходит для большинства брокеров). Индикация канала и уровней ADR появляется нач

This is a Binary Options signal indicator. Extremely powerful for the 1 min chart. The signals are based on my personal tweak (based on real trial and error & backtested) of the RSI, ADX and Ichimoku and my observation on how price moves. It turns out, 2 candles expiry is the most consistent with this set up. How to use: 1. Wait for arrow signal to show. 2. Place a 2 candle expiry right after the close of the signal candle. So if you are trading a 1 min chart, place an expiry for 2 mins... if yo

Several years of observing the principles of the operation of the Super Zone market worked, then and now, because the indicator allows you to see the trading range of the week and even the month that large market participants use. We are very easy to use on the H4 in the weekly range ( in the tester it not work in the demo mode ) - we sell from the upper zones and buy from the lower zones. Marks zones from the beginning of the week (month) that do not redraw , works on almost all currency pairs

WaveAnalyzer works on the basis of the ZagZag indicator. When a wave formation appears on the chart, which can be chosen from the list in the program settings, it informs the trader in the following ways:
- Starts Alert.
- Informs by voice.
- Sends a letter.
- Sends a push notification to a smartphone.
- Makes a screenshot, which can be viewed in the MQL4 / Files folder.
In the future we plan to expand the functionality of this indicator.
Thus, by placing on the chart several indic

User friendly indicator. This indicator will help you catch the trend an fast as possible. Indicator developed based on moving averages. User can select which type of moving averages they want to use. Indicator draws an arrow when the moving average crosses. The moving average cross over arrow can be filtered with RSI, OsMA, and Parabolic Sar. There are options for selecting specific criteria for the filters. Such as period of Rsi and Rsi levels. OsMA and Parabolic Sar criteria can also be sel

The principle of the indicator.
The Strong Trend Flat Signal (STFS) indicator is the intersection of two, developed by the author, non-lagging moving averages with averaging periods 21 and 63. A simple moving average (SMA) with an averaging period (2n + 1) of bars is always obtained lagging by n bars. If SMA or other types of moving averages are the basis for making trading decisions, then their strong delay does not allow to open positions in time and close positi

圓點表示強烈的運動方向。它不會自動工作,您需要手動打開交易並關閉它。看到自己的利潤點,我想你可以在屏幕截圖中弄清楚。我每 150-200 點後關閉。指標訂閱可以作為預測單獨協商。寫信給您的私人消息,或您的個人資料中指定的聯繫人。我只交易外匯股票,其他東西也可以接受。盈利或虧損取決於您如何使用它。從現在開始租賃。沒有關於測試儀的報告,因為該指標僅給出信號並顯示趨勢的強度。在出現第 2 個藍色圓圈後,您可以在 2 個黃色圓圈后買入或打開賣出訂單。
已經做出改變!!!
23.07.2021年
朋友們下午好!應買家的要求,現在當滿足買入或賣出條件時,指標將發送警報和推送通知。只要您安裝了 MQL 應用程序,推送通知就會傳到手機上。您只需要在應用程序中輸入您的 MetaQuoteID。您可以在 MT4 平台的服務 - 設置 - 通知部分找到它。
我在截圖1-2照片部分以截圖的形式展示了信號的條件。同樣在第三張照片中,您可以看到信號並標記在圖表上。
BYU 信號的條件
1. 燭台向上穿過 MA 線並以綠色圓圈收於該線上方。
2. 上一根蠟燭收盤後,下一根蠟燭預計將以綠

The indicator shows the potential trend direction by cyclical-wave dependence. Thus, all the rays of the intersection will be optimal rays, in the direction of which the price is expected to move, taking into account the indicator period. Rays can be used as a direction for potential market movement. But we must not forget that the approach must be comprehensive, the indicator signals require additional information to enter the market.

This indicator shows the pivot points of corrections, trends and trends. Matrix calculation system shows 8 types of reversal of the currency pair chart.
Signal classification:
Category 1 - the basic signal . Provides corrective movement between the phases of the graph. On the D1 timeframe it is possible to apply for trading on each bar.
Category 2 - the most basic signal on the graph. In a calm market with a small ATR (for example, night trading), its signals will be major. In impulse

Advanced Trend Finder Lite follow trend. Color change trend changed.
Works in EURUSD/GBPUSD/XAUUSD/USOIL/US500/USDJPY/USDCAD/JP225/USDTRY/USDMXN and all pairs
Best timeframes 5M/15M/1H/4H/DAILY
Signal on close of a bar.
DOES NOT repaint. DOES NOT repaint. DOES NOT repaint. DOES NOT repaint.
DOES NOT recalculate. DOES NOT recalculate. DOES NOT recalculate. DOES NOT recalculate NOTE : TREND CHANGED FOLLOW ARROW
Settings : No Settings, change color

The Quantum GBPX is the latest addition to our suite of currency indices, and one which we have been asked for many times, and even more so since Brexit. It is an index which has taken us some time to develop, and through a series of complex calculations draws its primary data from a basket of currencies based on the old style dollar index, the Dixie. This is converted to a chart for the British pound. The result is an accurate index which describes strength and weakness for the GBP currency in

The indicator was developed with one purpose - adequate processing on stories and the maximum approach to the original (it was required for development of more difficult indicator and use in the expert). I think, everything who tried to get history from the original indicator understood that in it there is information only on extrema and nothing more. It is not sure that similar does not exist, but mine is found on other than original to an algorithm: - for one pass (programmers will understand)

Trend Hero is an indicator that generates trend signal. It generates trend signal with its own algorithm. These lines give buying and selling signals. Can be used in all pairs. Sends a signal to the user with the alert feature.
Trade rules Enter the signal when the buy and sell signal arrives. Processing should only be initiated when signal warnings are received. It is absolutely necessary to close the operation when an opposite signal is received. Or the user has to stop the damage and put t

Trend Chase is an indicator that generates trade arrows. It generates trade arrows with its own algorithm. These arrows give buying and selling signals. The indicator certainly does not repaint. The point at which the signal is given does not change. You can use it in all graphics. You can use it in all pairs. This indicator shows the input and output signals as arrows and alert. When sl_tp is set to true, the indicator will send you the close long and close short warnings. It tells you that you
The indicator is constructed on the basis of ZigZagHistory ( https://www.mql5.com/ru/market/product/37376 ). At the same time calculated on the current timeframe and on the specified high. The history of the high timeframe is displayed by hollow squares. The history of a current timeframe is displayed by rhombuses. Colors and the sizes of signs can be adjusted. Attention! The Price noise parameter - has significant effect on formation of extrema. Parameters:
High TimeFrame (HTF) - the high ti
Average Daily Range with factor target and more functions (ADR)
Hello traders,
The upgraded ADR dashboard is much more better and more convenient for day trader, try it to experience the good things!
How to use Average Daily Range (ADR) Indicator? ADR is just a simple indicator tool to help trader identify the daily average range of an instrument. So for example we have the pairs EURUSD and that pairs usually makes a peak and bottom during the trading day and the point from the bottom to

本指标设计用于显示28个主要货币对,在三个常用指标RSI,Stochastic,CCI中的强弱顺序。 三个指标的强弱值由弱到强排序,从最弱到最强。 较弱货币对: 出现在顶排三行内至少2次。 较强货币对: 出现在顶排三行内至少2次。 用户可以附加一个品种,即本指标可以计算 28+1 个品种。 使用建议: https://www.mql5.com/zh/blogs/post/729879 基于本指标的免费EA: https://www.mql5.com/zh/blogs/post/732968
参数: Forex Suffix -- 28个主要品种的后缀,如果有则填写,没有则不写 Additional Symbol Settings --- 附加品种的设置 Additional Symbol(without suffix) -- 附加品种名称,不要包括后缀,后缀单独写 Suffix for Additional Symbol -- 附加品种的后缀,没有则不写 Hide CandleStick -- 是否隐藏图表K线,true则隐藏。 =========RSI Sett

Implementation of the channel on the MetaTrader 4, with real image of the lines.
The channel itself consists of two lines, equally spaced from above and below from the trend line. The indicator is not redrawn and not late. The principle of operation of the indicator is that, when placed on the chart, automatically determine the current state of the market, analyze historical data, based on historical data and display the trader directions to further actions.
或 DBD%。该指标由彩色带组成,根据两个 Bermaui Deviation Oscillator (BD%) 和两个移动平均线显示交易信号。 Bermaui Deviation Percent 是一种波动率指数,以百分比而非点数来衡量波动率。 BD% 的想法是根据在 0% 和 100% 之间移动的经典标准偏差 (CSD) 创建一个索引。 重要信息
DBD% 专家顾问示例: https://www.mql5.com/en/blogs/post/731145
如果您想了解更多关于 BD% 的信息, 请阅读下一篇博文: https://www.mql5.com/en/blogs/post/718182 DBD% 由两个信号带组成,一个是快的,另一个是慢的。当快速和慢速看涨时,就会出现买入信号。当快速和慢速都看跌时,就会出现卖出信号。 DBD% 特点
两个不同时期的两个 BD% 的组合有助于捕捉不同的市场周期。
使用 BD% 作为趋势过滤器是一个很大的优势,因为 BD% 可以作为市场低波动性运动的过滤器。
在满足买入/卖出条件后的第一次开盘时出现信号。
精心设计的参数

Indicator for effective binary options trading.
Complete lack of redrawing The arrow indicates the direction of the next candle and the possible direction.
signal accuracy. Complete lack of redrawing. works great with support and resistance levels
it has an alert, it can be turned on or off in the settings
the accuracy of this tool is perfect
All successful trading.
Also see my other indicators

can recognize candlestick patterns
he also recognizes the lows and highs of the price for a certain time.
MTF works on all currency pairs in futures and sulfur, cryptocurrency does not redraw. his work can be seen in the test.
you can trade at any time of the day but the preferred trading time during the European American session ----------------------------------------------------------------------------------------------------------------------------------------------------------

ZhiBiSmart适合所有市场品种的所有图表周期。它利用趋势回调用做反弹波段,这样会更好的预测了波段和趋势。 Buy the order:出现绿色向上的箭头的标记; Buy the close:出现绿色的叉的标记; Sell the order:出现黄色向下的箭头的标记; Sell the close:出现黄色的叉的标记; 参数设置: 【TrendPeriod】:趋势线的周期; 【SignalPeriod】:信号线的周期; 【TrendSpread】:趋势线最后的确定点差; 【Alert_No_Off】:弹窗消息的开或关;true=开、false=关; 【SendMail_No_Off】:电子邮件的开或关;true=开、false=关; 【SendNotification_No_Off】:消息推送到移动终端的开或关;true=开、false=关; 【UpArrowMessage】:出现向上的箭头的时候,发送的消息的内容; 【DownArrowMessage】:出现向下的箭头的时候,发送的消息的内容; 【UpCloseMessage】:出现关闭向上的订单的叉的时候,发送的消息的内容;

All those involved in trading do certainly know that Moving Average Crossovers for being tradable should be reliable and also they need to have minimal lag.
BeST_Vervoort Zero Lagging MAs Strategy is a Metatrader Indicator that can help you to achieve it and is based on S.Vervoort's work about Reliable and of Zero Lag MAs Crossovers as described in his TASC_05/2008 article " The Quest For Reliable Crossovers ". It's a Multipotentiality Indicator as it can display of either simply the Zero Laggi
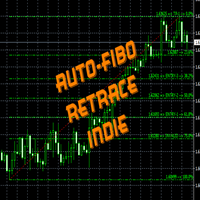
FiboRetrace Indie is a custom indicator created for those using Fibonacci indicator for trading. It enables the traders to use it independently and without limitations. This is created as an automated Fibonacci custom indicator that automatically plots itself when a trader attaches it to his chart, it will scan the chart and locate the recent trend direction either upward trend or downtrend and plot itself the way it should be. So there is no hassles looking for trend direction by the users, thi
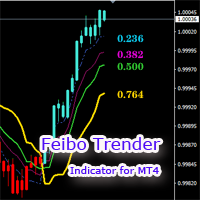
Feibo Trender 是一款基于黄金分割的 趋势跟踪指标 。 1.价格处于 上升趋势K线变蓝 ,考虑做多,价格处于下 降趋势K线变红 ,考虑做空。 2.通道的分割区域用不同颜色的线标识出来了,这些线可以 作为支撑或者压力参考位置,回调加仓 。 3.价格 突破了黄线,就标志着趋势反转 ,停止加仓,处理套单。 指标参数都可以自定义,设置简单。 如果有不清楚的方面,请通过MQL5咨询我,乐于为你提供帮助。 更多来自作者的EA和指标 https://www.mql5.com/zh/users/chenshaofei/seller
参数说明:
period - 通道周期 support1 - 支撑位1回调比例 support2 - 支撑位2回调比例 support3 - 支撑位3回调比例 reserve - 趋势反转回调比例 downcolor - 下降趋势K线颜色 upcolor - 上升趋势K线颜色

The indicator simplifies the decision-making process by recognizing the reversals using the built-in algorithm, and then confirms the signals at the support / resistance levels. In this way, the indicator tracks the market trend with unsurpassed reliability, ignoring the sharp fluctuations in the market and the noise around the average price. The indicator can be used for both small periods and long-term trading. The indicator is not redrawn and not late. 94% of deals are profitable. Take profit

Multi-timeframe indicator perfectly determines when there will be a rollback from the level ideal for binary options. of correct true signals Forex Stop Loss trading can be dragged behind the line thereby moving the deal to breakeven there is a signal in the indicator. The indicator showed excellent results during testing. Test in the test and make sure it is accurate. For any questions, suggestions, please always communicate with you.
Provides maximum revenue from trends.
You can receive signals from Zigzag, Front Fibonacci Retracement, Back Fibonacci Retracement and Stochastic Oscillator indicators. You can run these indicators in the background. It will give you a warning at the levels you set. You can change all levels from the settings. Designed to help you get the most out of trends. Fibo Level : 38.2 / 61.8 / 76.4 Stochastic : 20 / 80

This is the author's product of the trading-investment company Algorithmic Capital, which specializes in professional investor capital management and the creation of trading and analytical software. The Channel Enslaver indicator is created on an “all inclusive” basis. Its program code includes several important blocks at once: • A set of professional technical indicators that independently analyze quotes and generate trading signals. • An alert system that gives special signals (including Email

Mars 1 is a Box Break is a powerful indicator of Break Zone for any par and any timeframe. It doesn't requires any additional indicators for the trading setup.The indicator gives clear signals about opening and closing trades.This Indicator is a unique, high quality and affordable trading tool.
Perfect For New Traders And Expert Traders Low risk entries. Never repaints signal. Never backpaints signal. Never recalculates signal. For MT4 Only Great For Scalping Great For Swing Trading Arrow Ent

Description Very precise patterns to detect: entry signals as well as breakout, support and resistance reversal patterns. It points out zones in which, with a high probability, institutional orders with the potential to change the price’s direction and keep moving towards it, have been placed. KEY LINKS: Indicator Manual – How to Install – Frequent Questions - All Products How is this indicator useful? It will allow you to trade on the order’s direction, once its direction has been id

The principle of the indicator. The StatChannel ( SC ) indicator is a development of the Bollinger Bands indicator ( ВВ ). BB is a moving average, on both sides of which two lines are drawn, separated from it by standard deviations std multiplied by the corresponding coefficient. At the same time, a moving average with an averaging period (2n + 1) bars is always obtained lagging behind n bars. Sliding std is also lagging behind on n bars, also calculated by (2n + 1) points. Such
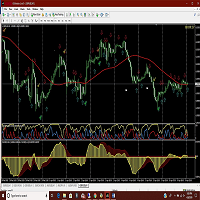
Amac indicator will give you alerts when the ADX crosses and also when the two MACD indicators cross. Helps in determining the trend direction, good for scalping against the main trend as well. Get mobile alerts and email in addition to the platform alerts. Arrows indicate MACD direction and Check marks show ADX turns. Works on all time frames but you can get more pips by using the 30 min and above. Be sure to view the photos!
multi-timeframe indicator. Ideal for both the Forex market and binary options. Good accuracy of this tool the indicator showed excellent results during testing. test it in a tester and make sure it is accurate.... complete lack of redrawing. You can choose absolutely any instrument. the indicator will provide many profitable and accurate signals. advantages of the indicator: advanced signals. high signal accuracy. frequency of occurrence of signals.
MetaTrader市场是独有的自动交易和技术指标商店。
阅读MQL5.community用户备忘更多地了解我们提供给交易者的独特的服务:复制交易信号,自由职业者开发的自定义应用程序,通过支付系统完成的自动付款和MQL5云网络。
您错过了交易机会:
- 免费交易应用程序
- 8,000+信号可供复制
- 探索金融市场的经济新闻
注册
登录