适用于MetaTrader 4的付费技术指标 - 49

Mars 8 is a TREND indicator is a powerful indicator of TREND DIRECCTION for any par and any timeframe. It doesn't requires any additional indicators for the trading setup.The indicator gives clear signals about opening and closing trades.This Indicator is a unique, high quality and affordable trading tool. Can be used in combination with other indicators Perfect For New Traders And Expert Traders Low risk entries. Never repaints signal. Never backpaints signal. Never recalculates signal. For

Great news from today you can test indicator within1 week absolutley for free! FREE version of indicator https://www.mql5.com/en/market/product/41465 We present you an indicator - Insider Scalper by LATAlab developed by the LATAlab team, that allows you to bring scalping trading to a whole new level of quality! With our strategy you can: Insider Scalper by LATAlab displays a hidden tick chart that is not available in the basic tools of the terminal. Automatically detects and draws strong level

Chart Linker This tool is indicator for linking charts in Metatrader 4. Thanks to this tool you have to change symbol only in the main window and all other change automatically. Add this tool to all charts that you want to be linked with each other. Set one chart as a main. Change symbol in the main window and linked windows change automatically to the new symbol.
Compare to https://www.mql5.com/en/market/product/30048 Chart linker can work simultaniously with other indicators and/or expe

Automatic redrawing of Trend Supports and resistances levels and Possible Wedge pattern formation to indicate price breaking of Rising Wedge (signal SELL) or price breaking of falling Wedge (signal BUY) Very simple and smart indicator ALERTS AND MOBILE NOTIFICATIONS availavle !!! you can edit the calculation bars of the bars count for formation of the trend lines and the initial shift from current price Smaller values for bars /shift inputs when using Higher Time frames (D1-H4) and the reverse
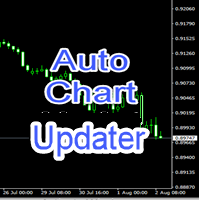
Auto Chart Updater Indicator is created to update the window chart for any indicator, expert or any trading program receive fresh data retrieval at xx period interval set by the user as a preference. It is laced with on-chart Candle clock to give the user the sense of time when the updater would refresh the chart or the remaining time for the candle/session to end. It also has an option for the user to choose when exactly does he/she wants the Updater to update the chart. The User can also selec
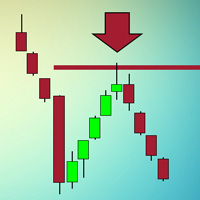
Индикатор, который ищет качественные точки входа в рынок и отображает их в виде стрелок. Действует по сложному алгоритму. Сначала ищет на графике специальные уровни, которые обязательно должны быть пробиты импульсом. Если цена возвращается к этому уровню в виде свечи с длинной тенью и маленьким телом и касается уровня только тенью - возникает точка входа. Не перерисовывается! Лучше всего выглядит и отрабатывает на Н1.
Может использоваться как: Индикатор уровней, где цена будет останавлива

MM Trend Direction follow trend. Color change trend changed. Works in EURUSD/GBPUSD/AUDUSD/USDCHF/EURNZD/NZDUSD/SILVER/USOIL/US500/AUS200/USDTRY/EURTRY and all pairs
Best timeframe 15M
Signal on close of a bar.
DOES NOT repaint. DOES NOT repaint. DOES NOT repaint. DOES NOT repaint.
DOES NOT recalculate. DOES NOT recalculate. DOES NOT recalculate. DOES NOT recalculate NOTE : COLOR CHANGED TREND CHANGED
Settings : No Settings
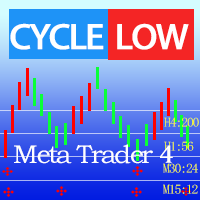
做事、做交易讲究天时地利人和,平常我们大多数时候只关心在哪个价位开仓、在哪个价位止损、在哪哪个价位止盈,这叫地利。很少去关注在什么时候去开仓、止损、止盈,这个叫天时。 这个指标可以帮助您去寻找什么时候去做交易,什么时候应该关了电脑去陪家人、旅游、和玩乐。 不管您是图表交易者,趋势交易者,日内短线交易者,或是剥头皮交易者,相信这个指标会对您大有帮助。 比如画趋势线时去连接对应时间框架内的低点,这回您会发现趋势线变得更有趣了。 其他的我这里不做赘述,您可以根据您的交易策略发现这个指标的其他很有意思的用处。 指标没有外部参数,不会根据回溯柱的个数不同而使结果不一致,所有使用的条件都完全来自市场,也就是市场怎么说咱就怎么做,永远跟随市场的脚步。
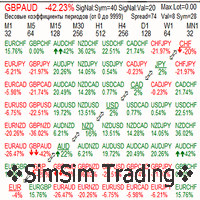
SimSim Tournament Currency Strength Table This is a multi-currency indicator; it shows the relative strength of the currency and 28 major currency pairs. There are many similar indicators on the market, but let there be one more. In this indicator, unlike others, you can specify weighting factors for each timeframe.
Weighting factors. Why are they? Each trader prefers to work with a specific time frame, which is the main one for him, and the signals from him are most important. Examples of

Ultra Arrows Scalper Pro Ultra Arrows Scalper pro indicator for efficient binary options trading ----------- complete lack of redrawing -----------... ....... ... An arrow is formed on the current candle and indicates the direction of the next candle and the possible direction of the trend in the future. Enter the deal is on the next candle. its advantages: signal accuracy. complete lack of redrawing. You can choose absolutely any tool. the indicator will provide many profitable and accurate
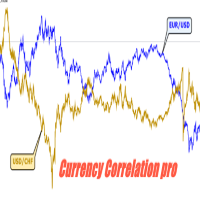
Currency Correlation pro
Currency correlation happens when the price of two or more currency pairs moves in conjunction with one another. There can be both positive correlation, where the price of the currency pairs moves in the same direction and negative correlation, where the price of the currency pairs moves in opposite directions. this indicator put the price of 5 pairs on sub-windows so you see what happens in one chart.
How to use Correlation Indicator?
You can simply choose curren
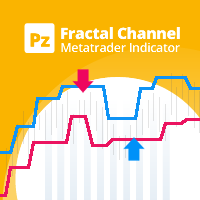
这是交易可变分形周期突破的非常简单但有效的指标。分形是奇数数量条的价格形态,中间条是形态的最高或最低价格点。这些价格充当短期支撑和阻力位,该指标用于绘制价格通道并显示突破。 [ 安装指南 | 更新指南 | 故障排除 | 常见问题 | 所有产品 ] 容易交易 分形突破可以开始长期趋势 分形通道是一种很好的尾随止损方法 它是不可重涂和不可重涂的 它实现了各种警报 可自定义的颜色和尺寸 较高的期限会导致更可靠的突破,但出现的频率会降低。该指标应通过更高时限的分析来确认。通常,您需要为较低的时间范围增加分形周期,为较高的时间范围减少分形周期。
输入参数 周期:用于计算分形的条形数量。必须为奇数 突破:启用或禁用突破 颜色:自定义箭头的颜色和大小 警报:启用或禁用各种警报
作者 ArturoLópezPérez,私人投资者和投机者,软件工程师和Point Zero Trading Solutions的创始人。
Fast Signal Fx This indicator is working very simple. The indicator will detect the swing pattern and find the return point. The main structure was combined with Stochastic Oscillator level for return point and moving average calculation for confirm the direction. The important strategy is making fast signal for scalper trading technique with high frequency trade. Indicator Installation Attach this indicator to the chart window of currency pairs. The recommended currencies are EURUSD, GBPUSD, U

Indicator is used for: defining price probability distributions. This allows for a detailed representation of the channel and its borders and forecast the probability of a price appearing at each segment of its fluctuations; defining the channel change moment. Operation principles and features Indicator analyzes a quote history on lower timeframes and calculates a price probability distribution on higher ones. Forecast algorithms allow the indicator to calculate probability distributions and m
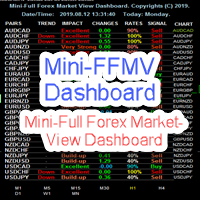
MINI FFMV Dashboard MINI FFMV Dashboard is a MINIATURE custom indicator of FULL FOREX MARKET-VIEW DASHBOARD created to give the Traders a full view of what is going on in the market. It uses a real time data to access the market and display every bit of information needed to make a successful trading. It shows as many as 30 currency pairs or as allowed to display in the Market Watch of your MT4 USAGE: For Solo Trading For Basket Trading (See the screenshot on how) COMPONENTS: Trend: Overall tren

Mini Forex Market-View Dashboard and Mini-CSM Mini Full Forex Market View Dashboard is a miniature creation of FULL FOREX MARKET_VIEW Custom indicator created to give the Traders a full view of what is going on in the market but in a partial matter to make it conscise. It is useful most especially for those who don't like bogus indicators or those who have a PC with limited screen size. It uses a real time data to access the market and display every bit of information needed to make a successful

This indicator calculate the minimum,maximum,average and relative (to points of the bar) spread in the chart applied period. The indicator must be applied to one or more different period on a Pair and analyze the spread for all the Pairs available by the Broker. The csv output for one minute chart is something like this https://gofile.io/?c=K5JtN9 This video will show how to apply the indicator https://youtu.be/2cOE-pFrud8

An Indicator that calculates the Pivot Point line, along with the 2 levels of support and resistance lines, known as S1, S2, R1, R2 respectively.
The formulas for calculation are as follows:
Pivot point (PP) = (High + Low + Close) / 3
First level support and resistance: First resistance (R1) = (2 x PP) – Low First support (S1) = (2 x PP) – High
Second level of support and resistance: Second resistance (R2) = PP + (High – Low) Second support (S2) = PP – (High – Low)
The trader can adj

该系统是一个简单的系统,旨在为初学者交易者生成一致的条目。当找到相同方向的两个连续条并且确认ADR和ADX指示器时,放置一个输入箭头。我们的想法是,人们不是在寻找系统的圣杯,而是使用一个系统来进入市场。人们应该关注金钱和风险管理。 建议使用枢轴点作为目标线来确定可能的条目是否有空间增长到利润,然后如果奖励/风险比率最小为2比1则进入市场。因此,从您的进入位置到下一个枢轴线的空间必须至少是从您的进入到止损线的空间的两倍。 风险是货币的止损金额,应该是您账户价值的0.5-1.0%。开始使用的风险更低,可能为0.2%。这似乎很少,因为利润也很少,但你学会连续几次亏损是非常重要的。对于所有良好的交易系统,你会发现一系列的损失和赢家,因为你无法承受一组损失而退出使用系统将是一种耻辱。 将您的位置尺寸缩小到足够小,以便止损足够大,不会太快取出。 Gāi xìtǒng shì yīgè jiǎndān de xìtǒng, zhǐ zài wèi chū xuézhě jiāoyì zhě shēngchéng yīzhì de tiáomù. Dāng zhǎodào xiāngtóng fā

Mars 9 is a TREND indicator is a powerful indicator of TREND DIRECCTION for any par and any timeframe. It doesn't requires any additional indicators for the trading setup.The indicator gives clear signals about opening and closing trades.This Indicator is a unique, high quality and affordable trading tool. Can be used in combination with other indicators
Perfect For New Traders And Expert Traders Low risk entries. Never repaints signal. Never backpaints signal. Never recalculates signal.

Insider Scalper Binary This tool is designed to trade binary options.
for short temporary spends. to make a deal is worth the moment of receiving the signal and only 1 candle if it is m1 then only for a minute and so in accordance with the timeframe.
for better results, you need to select well-volatile charts....
recommended currency pairs eur | usd, usd | jpy ....
the indicator is already configured, you just have to add it to the chart and trade .... The indicator signals the next can

该指标建立当前报价,可以与历史报价进行比较,并在此基础上进行价格走势预测。指示器有一个文本字段,用于快速导航到所需日期。
选项:
符号 - 选择指标将显示的符号;
SymbolPeriod - 选择指标从中获取数据的时段;
IndicatorColor - 指示器颜色;
HorisontalShift - 由指标绘制的报价移动指定的柱数;
Inverse - true 反转引号,false - 原始视图;
ChartVerticalShiftStep - 图表垂直移动(键盘上的向上/向下箭头);
接下来是文本字段的设置,您可以在其中输入日期,您可以通过按“回车”立即跳转到该日期。 接下来是文本字段的设置,您可以在其中输入日期,您可以通过按“回车”立即跳转到该日期。
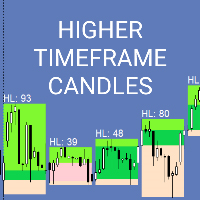
The indicator draws candles of the selected high timeframe on the current chart. It supports both standard timeframes and custom ones set in minutes. Built-in support for displaying the size of the candle, its body, as well as the upper and lower shadows. Alerts when High / Low breaks the previous candlestick of the selected timeframe. Customized types of elements for the simultaneous operation of several indicators on the same chart.

Auto redrawn Pivot support resistance horizontal lines with signal of Buy/Sell possibilities with SL level and with trend support resistance lines too used for all symbols and time frames you can adjust inputs parameters (only 2) and test it on various symbols and time frames input number of bars for calculation and moving average for signal accuracy example : use it on M30 time frame with input 200 for bars count and 100 for MA

Price Predictor is an indicator that shows precise price reversals taking into account a higher time frame and a lower time frame candle patterns calculations it is great for scalping and swing trading . Buy and sell arrows are shown on the chart as for entry signals. BIG Arrows indicates the trend - SMALL Arrows signal a trade (BUY/SELL) - A Green BIG UP Arrow with a support green line indicates a Bull Market : wait for buy signal - A Green SMALL Up Arrow after a BIG green arrow is

works great with the trend, ideal for traders who trade using the scalping system. This is a pointer indicator. how to make deals. when the blue one appears, you need to open a trade to increase by 1 candle if the timeframe is m1 then for 1 minute, etc. if a red dot appears, you should make a deal to reduce it by 1 candle. Indicator signals appear along with a new candle; the working candle is the one on which the signal is located.

The easiest indicator to know to which address the price is MOVED: taking into account other indicators to measure the exact price direction more accurately and with less noise. it is useful to know when to perform a BUY operation one from SELL

Level Scanner 指标是一个强大的工具,旨在自动识别图表上的 较高 和 较低 区域,以及所有 支撑和阻力位 。它结合了 赫尔移动平均线 的使用,以提供更清晰、更平滑的真实趋势表示。该指标以惊人的速度运行,使交易者能够快速识别感兴趣的关键领域并做出更明智的交易决策。 Level Scanner 的突出特点之一是它的多功能性。它可以应用于任何交易品种和时间框架,使其适用于范围广泛的交易策略。该指标有效地生成信号,使交易者能够迅速识别潜在的交易设置。此外,它还提供用户友好的参数,这些参数可以完全自定义以符合个人交易策略和偏好。 交易者可以通过自己的周期、CCI、RSI 和随机指标过滤信号,进一步完善他们的信号。此功能使交易者能够根据他们的特定要求和市场分析方法定制指标的输出。通过结合这些额外的指标,交易者可以增强他们的决策过程并更深入地了解市场状况。 此外,该指标包括趋势参数,使交易者能够设置移动平均线周期、方法和价格常量。此功能有助于趋势识别并使交易决策与当前市场方向保持一致。 为了让交易者了解情况并保持警惕,Level Scanner 为已识别的高低区域以及支撑位和阻力位提供通
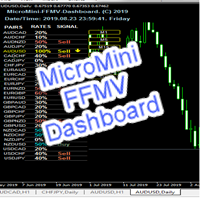
MicroMini FFMV Dashboard This is a custom indicator created to give Traders a full view of what is going on in the market. It uses a real time data to access the market and display every bit of information needed to make successful trading. THIS IS A MicroMini size of the FULL FOREX MARKET VIEW DASHBOARD INDICATOR. This is for those who don't like the Indicator to cover all the charts and for those who don't like BOGU S things. They practically perform the same operation but MicroMini FFMV Dashb
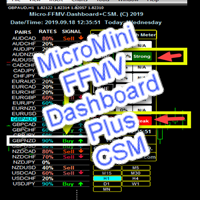
MicroMini FFMV Dashboard+CSM This is a custom indicator created to give Traders a full view of what is going on in the market. It uses a real time data to access the market and display every bit of information needed to make successful trading. To add value to the trading operation, Currency Strength Meter is added to it in order to consolidate the effective work of this indicator.
THIS IS A MicroMini size of the FULL FOREX MARKET VIEW DASHBOARD INDICATOR with CSM added. This is for those who
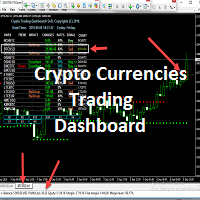
Micro Crypto Trading Dashboard
This is a custom indicator created to give CRYPTO TRADERS a full view of what is going on in the Crypto market. It uses a real time data to access the market and display every bit of information needed to make successful trading. This is a Micro size of the Compact Crypto Market Trading Dashboard Indicator created mainly for trading Crypto Currencies Markets for a living.
They practically perform the same operation but MicroMini FFMV Dashboard has a few feature

+Pips is a simple indicator which was design with FIVE trading confirmations in mind that works on all pairs and time frame. It's great for scalping, as it is a powerful indicator on its own. This indicator can be used by any type of trader(new or experience). The choice of sending notification to your mobile device and sounding alerts is up to the user as this is an optional setting. This is all you need no more cluster to your charts. If high probability and low risk trades, that alerts and se

A simple Approach to Elliot waves patterns Signal generated on trend continuation when breaking the "5" level or on corrective direction after 1-5 waves detected 1-5 labeled points arrows used for signal UP/DOWN direction Chaotic patterns in Blue are drawn all times until a 1-5 Elliot wave pattern detected 1-5 Red pattern in Bull Market : UP arrow in BULL trend continuation OR DOWN arrow as a reversal DOWN direction as pattern correction 1-5 Green pattern in Bear Market :DOWN arrow in BEAR tr

The TRs indicator works by using the waveform function. Thus, all entry points will be the optimal points at which motion changes. Entry points should be used as points of potential market reversal. The indicator settings by default are quite effective most of the time. You can customize them based on your needs. But do not forget that the approach should be comprehensive, the indicator signals require additional information to enter the market.
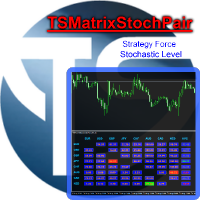
TSMatrixStochasticPair Indicator for currency strength trading, through the Stochastic indicator. Intelligent algorithm for scalper and intraday traders. The benefits you get: Never redesigns, does not retreat, never recalculates. Works on forex, timeframe from M1 to D1. Integrated pop-up, push notification and sound alerts. Easy to use. Parameters: KPeriod: k_ stochastic parameter. DPeriod: D_ stochastic parameter. Slowing: stochastic parameter. MA_Method:
Multicurrency RSI indicator that works on any set of timeframes. The set of symbols is chosen from the Market Watch of the terminal. The table is customizable (color, width, font size, line height, column width) Alerts and sending push-notification on a smartphone.
Adjustable Parameters: Signal_Bar - choose a bar for analysis (current or closed) 6 switches for timeframe sets Indicator_Period - period of the RSI indicator Level_Signal - the level of the indicator value to generate signal (the o

SSA stands for 'Singular Spectrum Analysis'. It combines elements of classical time series decomposition, statistics, multivariate geometry, dynamical systems and signal processing. SSA decomposes time series into a sum of components (ETs), with each component representing a lower smoothing, using several SVD (Singular Value Decompositions).
It is a powerful filtering process used in many fields of research (climatology, biomedical, aerospace, etc), where high quality forecasting and smoothin

SSA stands for ' Singular Spectrum Analysis '. It combines elements of classical time series decomposition, statistics, multivariate geometry, dynamical systems and signal processing. SSA decomposes time series into a sum of components (ETs), with each component representing a lower smoothing, using several SVD ( Singular Value Decompositions ).
It is a powerful filtering process used in many fields of research (climatology, biomedical, aerospace, etc), where high quality forecasting and smoo
Mars 10 is a Oscillators indicator is a powerful indicator of CHANGE DIRECCTION for any par and any timeframe. It doesn't requires any additional indicators for the trading setup.The indicator gives clear signals about opening and closing trades.This Indicator is a unique, high quality and affordable trading tool. Can be used in combination with other indicators
Perfect For New Traders And Expert Traders Low risk entries. Never repaints signal. Never backpaints signal. Never recalculat
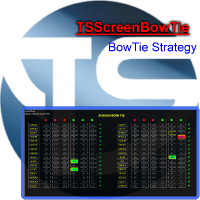
Expert for trading with the BowTie strategy. Intelligent algorithm for scalper and intraday traders. Multi time frame and multi currency panel. The benefits you get: Easy-to-use panel that alerts you to crossings of moving averages, like strategy, on each currency. Possibility to choose your favorite crosses. Possibility to choose to activate only the preferred time frames. Never redesigns, does not retreat, never recalculates. Works on forex and CFD, timeframe from M5 to D1. Integrated pop-up

KT Asian Breakout indicator scans and analyzes a critical part of the Asian session to generate bi-directional buy and sell signals with the direction of a price breakout. A buy signal occurs when the price breaks above the session high, and a sell signal occurs when the price breaks below the session low. MT5 Version is available here https://www.mql5.com/en/market/product/41704
Things to remember
If the session box is vertically too wide, a new trade should be avoided as most of the price

The current Rise and Fall is judged from the Commodity Channel Index (CCI) of the three cycles and displayed in a panel by color coding.
The second and third of the three cycles are changed according to the correction factor multiplied by the first cycle (minimum cycle).
In addition, each CCI is displayed with ATR (Average True Range) corrected for variation.
When two of the three CCI are complete, Trend_1 is displayed. When all three are complete, Trend_2 is displayed.
// ---
Sq
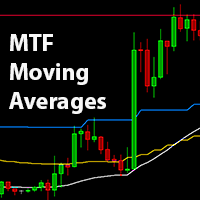
MTF Moving Averages is an useful indicator that brings you data from fully customizable higher timeframe Moving Averages on your charts, you can add multiple Moving Averages to use even more data of current market conditions. Check the indicator in action [Images below]
What MTF Moving Averages does apart from showing higher timeframe MA's?
Time saver , having all your higher timeframe MA's in just one chart, time is key, avoid switching between timeframes. Enter Trends precisely, easy to fol

This Momentum Seeker indicator is super simple! It is based in a few indicators to give you a quick entry to the Market. Once candle is closed and if parameters are all in place, an arrow is drawn in the chart, so there is no repainting! It works with any instrument! Risk management and trading skills are still needed! Inputs: Sensitivity: It is based in Periods, so the lower the number, more signals will come to screen but accuracy will decrease also. Recommended is 9 and above Audible_Alerts:

HEDGING MASTER line indicator It compares the power/strength lines of two user input symbols and create a SMOOTHED line that indicates the degree of deviation of the 2 symbols Strategy#1- FOLLOW THE INDICATOR THICK LINE when CROSSING O LEVEL DOWN --- TRADE ON INDICATOR THICK LINE (TREND FRIENDLY) !! Strategy#2- TRADE INDICATOR PEAKS (Follow indicator Reversal PEAKS Levels)!! you input - the index of calculation ( 10/20/30....) - the indicator Drawing start point (indicator hi
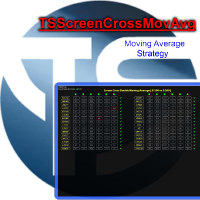
indicator for trading with the strategy with two moving averages. Intelligent algorithm for scalper and intraday traders. Multi time frame and multi currency panel. The benefits you get : Easy to use panel that alerts you to crossings of moving averages, as per strategy, on each currency. Possibility to choose your favorite crosses. Possibility to choose to activate only the preferred time frames. Never redesigns, does not retreat, never recalculates. Works on forex and CFD, timeframe from M

Infinity Oscillators Ultimate 是一个包罗万象的 OSCI-KIT ,旨在增强使用 RSI、随机指标、MACD、CCI 和交易量策略的交易者的交易体验。凭借其全面的功能,该指标提供了一个强大的工具集来分析市场趋势、识别反转和回撤、使用 ATR 计算日内目标以及随时了解重要的交易事件。 该指标的突出特点之一是它能够将最流行的 5 个振荡指标整合到一个指标窗口中。每个震荡指标都用不同的颜色表示,使交易者一眼就能轻松识别趋势、反转和回撤。通过结合这些振荡器,Infinity Oscillators Ultimate 提供了市场动态的整体视图,使交易者能够做出明智的交易决策。 为了确保交易者及时了解市场动态,该指标提供了一个快速可靠的通知系统。交易者可以直接在他们的移动设备上、通过电子邮件或带有声音的弹出式警报接收警报。激活或停用每种通知方法的灵活性使交易者能够根据他们的个人喜好定制警报系统。 此外,该指标在图表上提供清晰的“买入”和“卖出”信号,使交易者能够快速执行他们的交易策略。凭借其卓越的速度和响应能力,Infinity Oscillators Ulti

Welcome to my new indicator. It is a simple trend indicator, suitable for all instruments and timeframes. You should adjust it to your taste and you will know this product it's trustworthy. Trading skills and risk management, as usual are needed! There is not a perfect indicator in the market but you can find great helpers, and I think this is one of them. Inputs: SupRes_Interval Original setting is 5 and works very well with Indices. Lower numbers are more sensitive and suitable for scalpin

The Quadro Trend indicator works stably, correctly, and gives great flexibility when analyzing prices. There are many similar indicators, but Quadro Trend , unlike most of them , gives pretty good signals.
A great tool for working inside the day. On charts with a period of less than a day will help you see the daily candle in its usual form.
U-turn occurs when an arrow of the corresponding color appears. There is a parameter in the indicator to enable the supply of alerts when the color cha

All time zones. But I use it daily and 4 hours continuously. When trading in small time zones it is necessary to check the top time zones and especially 4 hours and logs. Red Arrow - SELL Green Arrow - BUY When the Green Arrow is lit while the Bar is Blue (Check the overall trend rise) - Buy When the Red Arrow is lit while the Bar is Red (Check general trend downtrend) - Sales NO RE-PAINTING GOOD TRADE
Monitoring of real trading on this system https://www.mql5.com/ru/signals/632726 Guru Pro Signal does not repaint! Guru Pro Signal is an original indicator, developed for the work of employees of one of the large funds! It is the best tool that can be added to your chart!
Guru Pro Signal signals about price reversal with the highest degree of accuracy, the best tool for both scalping and position trading. The entry signal is shown by the BUY and SELL arrows. It is possible to receive noti

KT MACD Divergence shows the regular and hidden divergences build between the price and oscillator. If your trading strategy anticipates the trend reversal, you can include the MACD regular divergence to speculate the potential turning points. And if your trading strategy based on the trend continuation, MACD hidden divergence would be a good fit.
Limitations of KT MACD Divergence
Using the macd divergence as a standalone entry signal can be a risky affair. Every divergence can't be interpr

it is an indicator for trading on the forex market and binary options, it is a trend tool with which you can take it most often when the first signal appears, open a trade in the indicated direction stop loss set above the arrow if the signal is lower or below the arrow if the buy signal when signals appear in the same direction where the transaction is open, you can enter into additional stop loss orders; we also set up trading without take profit; you need to close the transaction when a signa
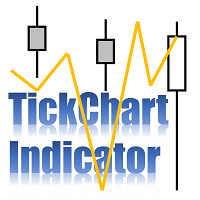
TickChart Indicator plots tick line on the main window of MetaTrader. ( Free version is "TickChart Indicator Lite" )
The tick-line shows the most detailed, fastest and real-time activities of the market, which are usually hidden in bars or candles longer than 1 minute. Usually, several new tick-line segments appear while a bar of M1 time frame is completed. After the release of an important economic indicator, the number of ticks per bar may exceeds 100. This indicator overlays the tick-line o

Scalping Modulator is a scalping trading system. The indicator consists of several analytical modules. It automatically analyzes the market and shows the trader all the necessary information for trading. Scalping Modulator draws two trend lines on the chart. One line shows the long-term direction of the price, the second line shows the medium-term direction of the price. The indicator also draws red and blue dots on the chart. They indicate a likely change in price movement. In order to open a
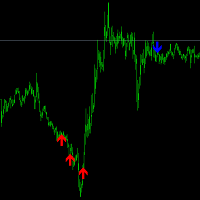
This index doesn't disappear, it doesn't get rewritten, the way it's calculated is to look for a trend shift, when the arrow comes up, there's a high probability that the trend will change. It is recommended to use a larger cycle, but you can also use the 5 minute cycle, the larger the cycle, the higher the winning rate. Indicators in the form of arrows, blue down arrow short, red up arrow do, in a large trend may appear in a continuous arrow, every arrow appears, is an opportunity to add positi
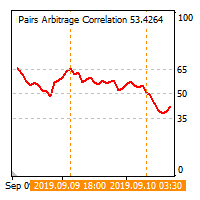
The cross-correlation indicator calculates the relationship between the specified pairs for the previous period. Automatically selects the instruments with the highest and the lowest correlation, and then simulates trading on the selected pairs on the same test period. Then indicator displays the pairs that have shown the best trading results. Visualizes the PAC (Pairs Arbitrage Correlation) criterion for the pairs selected by the trader. The signal to open trades is set by the PAC levels. When

The most handy indicator for searching classical and hidden divergences either between price chart and an oscillator-type indicator or between two oscillator-type indicators.
Just drop the indicator on the chart at which 1 or 2 oscillators are executed (see the video below).
The indicator doesn't require setting-up. You have just to choose the operation mode: to search divergences between price chart and an oscillator or between two oscillators..
Switch between classical and hidden divergen
Индикатор отображает 4 текущих уровня между, которыми находится цена. Уровни вычисляются на основе диапазона предыдущей недели. Количество и значение уровней произвольное и выражается в процентах . Положение уровней отсчитывается от минимума предыдущего дня (пример можно посмотреть в описании параметров). Целесообразно размещать уровни в строке настроек по порядку, тем не менее индикатор сам их отсортирует и если обнаружатся уровни отстоящие менее чем на 1% выдаст ошибку. Индикатор работает н
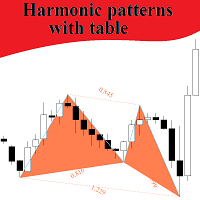
This indicator searches harmonic patterns on different TFs, and can track patterns in real time on all TFs for seted symbols. High and Low points for patterns defined by Bill Williams method, not by Zigzag or Fractals, it's more clear signals. Important input parameters: Where patterns search : "Current symbol" - searches patterns on the current symbol; "Seted symbols" - indicator creates table with seted symbols. Allowable percent of deviation : percent of deviation from perfect pattern Sym
Ни для кого не секрет, что для того чтобы, заработать на финансовых рынках необходимо движение цены инструмента. И чем движение сильнее тем больше возможностей предоставляется для торговли трейдеру. Для поиска сильных движений цены и был разработан PulseScanner. Панель предназначена для быстрого визуального нахождения и отображения сильных движений цены по всем периодам и на любых выбранных валютных парах одновременно. Индикатор имеет несколько режимов поиска и визуального отображения сигналов.
Mars 11 is a Trend indicator is a powerful indicator of FOLLOW DIRECCTION for any par and any timeframe. It doesn't requires any additional indicators for the trading setup.The indicator gives clear signals about opening and closing trades.This Indicator is a unique, high quality and affordable trading tool. Can be used in combination with other indicators Perfect For New Traders And Expert Traders Low risk entries. Never repaints signal. Never backpaints signal. Never recalculates signal.
Gladiator Signal indicator for binary options can be used in the forex market...
a signal appears when you open a new candle, we need to wait for it to close.. and at the time of opening a new one if the signal is to open a deal for one candle of the current timeframe works great on all time frames... in the settings you can enable turn off the alert and sound vision...

此指标可让您确定价格达到一个或另一个级别的可能性。它的算法非常简单,并且基于对特定货币对的价格水平的统计数据的使用。由于收集的历史数据,可以确定价格在当前柱形期间的变化程度。 尽管简单,但该指标可以为交易提供宝贵的帮助。因此,在其帮助下,可以确定交易头寸的TakeProfit和StopLoss水平。它可以帮助确定挂单的价格和确定TrailingStop的价格水平。 此外,该指标可以纳入现有战略。例如,您使用某种日内策略。然后,通过在D1时间框架上设置此指标,您可以在克服已经不希望开启新交易头寸之后获得水平。 该指标的主要缺点是它完全依赖于历史数据,并且不会以任何方式对某些当前的市场变化作出反应。 通过选择输入参数-L1 ... L4来执行该指标的设置 - 每个输入参数确定从每个柱的开盘价达到价格价格的概率。每个参数的值必须在99 ... 0之内,并且以下每个参数必须严格小于前一个参数。 尼古拉·尼古拉耶维奇(Nikolai Nikolaevich)是创造这个指标的意识形态灵感,如果你喜欢这个指标,那就写下几句话,我会告诉他。

DO NOT STOP OCCUPY THE POWER OF THE UNION OF VARIOUS TIME FRAMES. From now on you can see the RSI that you use for your trading analysis in a single window without having to be opening others to form very graphic and easy. Color settings Possibility of deactivating the timeframes you want. Up or down arrows in relation to the previous sail. We also have Multiframe MACD and Momentum version available. Visit My signals https://www.mql5.com/es/signals/620506

Комплексный индикатор который работает на основе 4-х стандартных индикаторов МТ4: Moving Average, Stochastic, Bollinger Bands, RSI (в дальнейшем список индикаторов будет расширятся). Показания индикаторов берутся из 7-и тайм фреймов от М1 до D1. Строка Average показывает средние значения индикаторов в разрезе тайм фреймов. Сигналы индикаторов: Moving Average: быстрая скользящая выше медленной скользящей - покупка; быстрая скользящая ниже медленной скользящей - продажа; данные берутся из последне
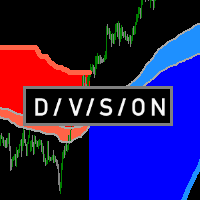
Определения текущей тенденции одна из самых важных задач трейдера не зависимо от стиля торговли. Индикатор Division поможет с достаточно высокой вероятностью это сделать. Division - индикатор распознавания тенденции, использующий в качестве источника данных подобие скользящих средних, в расчете которых используются объемы. От этих средних строятся границы, которые служат сигнализатором для смены текущей тенденции. Показания индикатора не изменяются не при каких условиях. При желании можно вкл

The Ceres Trend Indicator displays polynomial regression on history and in the current time.
In the indicator settings: module - degree of regression (1 - linear, 2 - parabolic, 3 - cubic, etc.) koeff is the standard deviation channel multiplier.
The main direction of application of this indicator is the ability to determine the likelihood of further growth. If there is an intersection of the linear regression line from below, then this indicates a trend inhibition and a possible reversal.

The OMEGA PIP is a unique revolutionary semi -automated software which change the game entirely to your favor.This product developed from years of research in the FX Market is embedded with complex algorithms which filters off false signals, generating only accurate valid signals which is immediately printed on your chart , thus it guarantees profit anytime its installed on your computer. Due to this significant feat, the daunting and the strenuous effort a traders goes through during

MetaTrader市场是您可以下载免费模拟自动交易,用历史数据进行测试和优化的唯一商店。
阅读应用程序的概述和其他客户的评论,直接下载程序到您的程序端并且在购买之前测试一个自动交易。只有在MetaTrader市场可以完全免费测试应用程序。
您错过了交易机会:
- 免费交易应用程序
- 8,000+信号可供复制
- 探索金融市场的经济新闻
注册
登录