专家: 两条均线差异
我认为该指标需要在 OnInit () 中使用 ArraySetSeries (mf, true) 和 (ms, true) 才能正常工作。
所有操作符
if (flg == 0) / / initialise on first pass
      {
       ArrayInitialize (ag, EMPTY_VALUE);
       ArrayInitialize (bg, EMPTY_VALUE);
       ArrayInitialize (cg, EMPTY_VALUE);
       hi = 0;
       I = 0;
       trend = 0;
       flg = 1;
       }
在 OnInit () 中会更有效,而不必使用 "flg"。
关于......使用 MACD 的 EA 认为其策略算法简化如下:
开仓买入:MACDcurrent>MACDprev && MACDcurrent<0; buyed = true。
平仓买入: buyed && MACDcurrent<MACDprev && MACDcurrent>0; buyed = false
用于出售反向操作。
如果我们在不操作 EA 时使用 SL 和 TP,我可以根据趋势(慢速 MA)说 "买入 "或 "卖出",然后等待新信号。
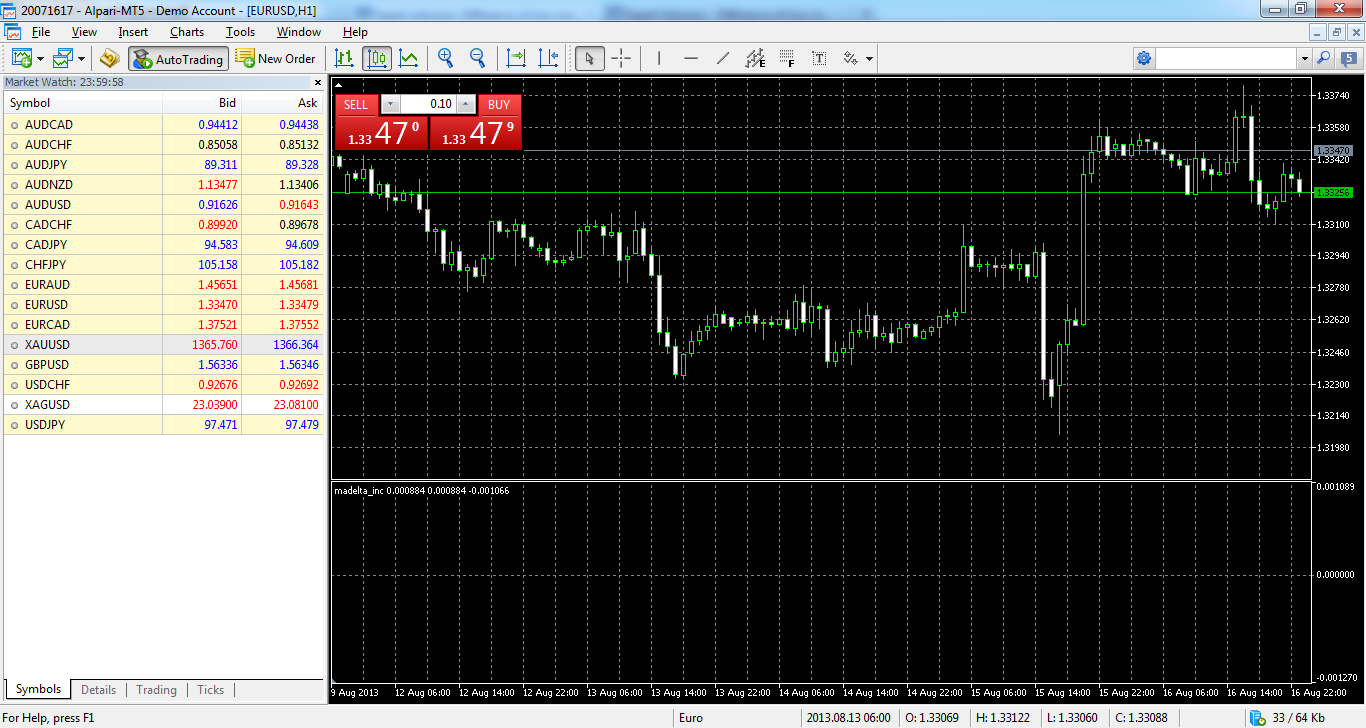
您好,我不知道为什么这个指标:madelta_inc.mq5 在我将其附加到图表时什么也画不出来。我在这里给您附上一张图片,您可以看看我说了些什么。此外,我还在代码下方添加了josemiguel1812 建议的修改,即不要使用标志:"flg",并将部分代码移至 OnInit() 事件。我没有使用ArraySetAsSeries (mf, true) 和 ArraySetAsSeries (ms, true),因为 "mf "和 "ms "都是只有一个元素的数组,我认为这种更改不会产生影响,而且 MT5 也不允许对静态数组使用此函数。但我想知道的是,为什么不画指标线?您能试试下面的代码并测试一下吗?
谢谢,Cyberglassed。
//+------------------------------------------------------------------+
//|madelta_inc | |
//|2013 温斯顿版权所有
//+------------------------------------------------------------------+
#property copyright "Winston 2013"
#property version "1.10"
#property description "madelta_inc"
#property indicator_separate_window
#property indicator_buffers 4
#property indicator_plots   3

#property  indicator_type1   DRAW_COLOR_LINE
#property  indicator_color1  White,Yellow,Red
#property  indicator_style1  STYLE_SOLID
#property  indicator_width1  2

#property  indicator_type2   DRAW_LINE
#property  indicator_color2  Yellow
#property  indicator_style2  STYLE_DOT
#property  indicator_width2  1

#property  indicator_type3   DRAW_LINE
#property  indicator_color3  Red
#property  indicator_style3  STYLE_DOT
#property  indicator_width3  1

input double d = 0.00195;                       //三角洲
input double m = 39.2;                          //多

input int F = 26;                               //快速移动平均线
input ENUM_MA_METHOD FM = MODE_SMA;             //快速平均模式
input ENUM_APPLIED_PRICE FP = PRICE_WEIGHTED;   //快价模式

input int S = 51;                                     //慢速移动平均线
input ENUM_MA_METHOD SM = MODE_EMA;                 //慢速平均模式
input ENUM_APPLIED_PRICE SP = PRICE_MEDIAN;        //慢价模式

int Ms, Mf, trend;
double px, hi, lo;
double ms[1], mf[1];
double ag[], bg[], cg[], ac[];

//+------------------------------------------------------------------+
//||
//+------------------------------------------------------------------+
void OnInit() {
        SetIndexBuffer(0, ag, INDICATOR_DATA);
        ArraySetAsSeries(ag, true);                    //信号

        SetIndexBuffer(1, ac, INDICATOR_COLOR_INDEX);
        ArraySetAsSeries(ac, true);                    //信号趋势颜色

        SetIndexBuffer(2, bg, INDICATOR_DATA);
        ArraySetAsSeries(bg, true);                    //hi 临界值

        SetIndexBuffer(3, cg, INDICATOR_DATA);
        ArraySetAsSeries(cg, true);                    //lo 临界值

        ArrayInitialize(ag, EMPTY_VALUE);
        ArrayInitialize(bg, EMPTY_VALUE);
        ArrayInitialize(cg, EMPTY_VALUE);
        hi = 0;
        lo = 0;
        trend = 0;

        Mf = iMA(NULL, PERIOD_H1, F, 0, FM, FP);
        Ms = iMA(NULL, PERIOD_H1, S, 0, SM, SP);

}

//+------------------------------------------------------------------+
//||
//+------------------------------------------------------------------+
int OnCalculate(const int rates_total,           // 价格[]数组的大小
                                const int prev_calculated,               // 上一次呼叫处理的条形图
                                const int begin,                          // 重要数据的起始位置
                                const double &price[])              // 要计算的数组
{

        CopyBuffer(Mf, 0, 0, 1, mf);                   //快速移动平均值

        CopyBuffer(Ms, 0, 0, 1, ms);                   //慢速移动平均值

        px = pow(m * (mf[0] - ms[0]), 3);                //放大差值并将其立方化


        if (px > hi) {                               //确定趋势
                hi = px;
                lo = hi - d;
                trend = 1;
        }
        if (px < lo) {                               //有颜色变化
                lo = px;
                hi = lo + d;
                trend = 2;
        }

        ag[0] = px;
        bg[0] = hi;
        cg[0] = lo;
        ac[0] = trend;

        return (rates_total);
}

//+------------------------------------------------------------------+
您好,我不知道为什么这个指标:madelta_inc.mq5 在我将其附加到图表时什么也画不出来。我在这里给您附上一张图片,您可以看看我说了些什么。此外,我还在代码下方添加了josemiguel1812 建议的修改,即不要使用标志:"flg",并将部分代码移至 OnInit() 事件。我没有使用ArraySetAsSeries (mf, true) 和 ArraySetAsSeries (ms, true),因为 "mf "和 "ms "都是只有一个元素的数组,我认为这种更改不会产生影响,而且 MT5 也不允许对静态数组使用此函数。但我想知道的是,为什么不画指标线?您能试试下面的代码并测试一下吗?
非常感谢,Cyberglassed。
您的预期是什么?只有指标缓冲区索引 0 的值才会被设置。
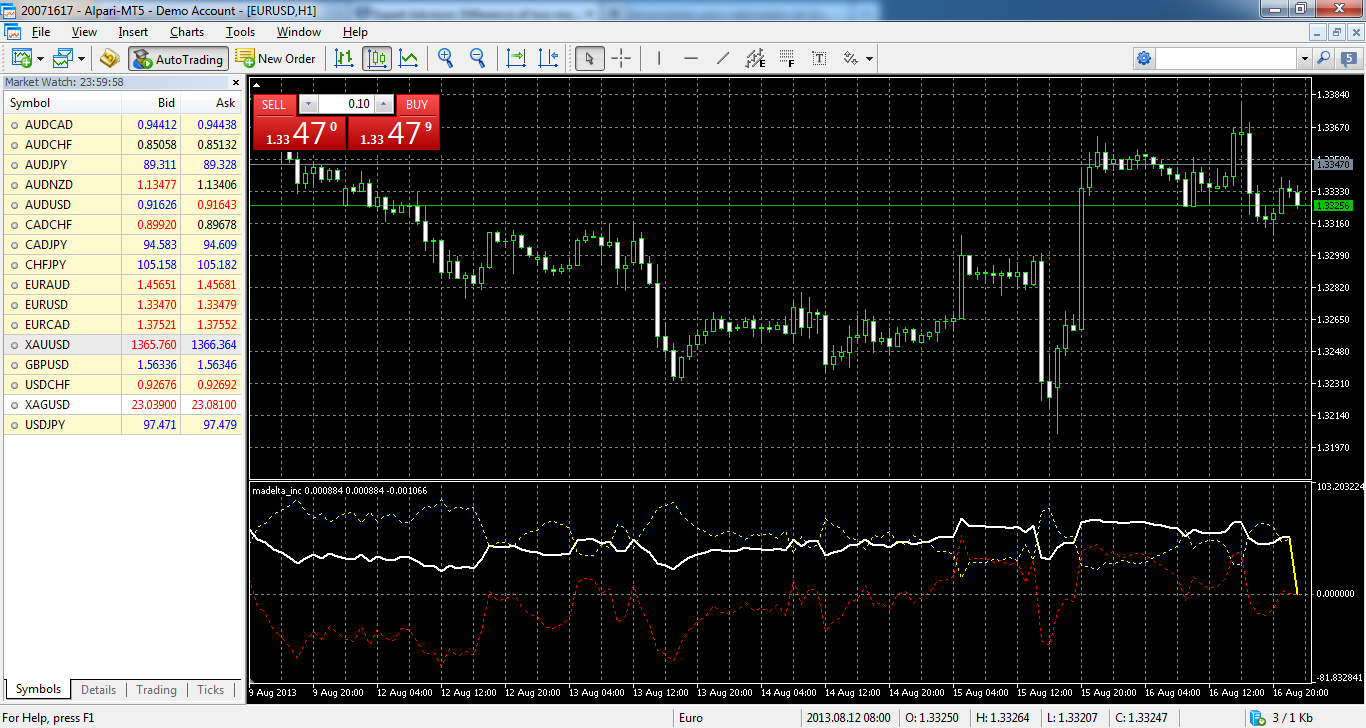
缓冲区的索引 0 总是被分配的,这让我有点困惑,所以我希望 ArraySetAsSeries 可以改变直观的行为(反向)或类似的东西,我是 mql5 的初学者。总之,由于其他一些原因,我不得不重新启动电脑,并再次尝试了该指标,现在它能像我一开始预期的那样绘制线条了。我附上一张图片。
谢谢你,Cyberglassed。
两条均线差异:
一款基于两条均线差异的 EA。
作者: Winston