- 显示:
- 7760
- 等级:
- 已发布:
- 已更新:
-
需要基于此代码的EA交易或指标吗?请在自由职业者服务中订购 进入自由职业者服务
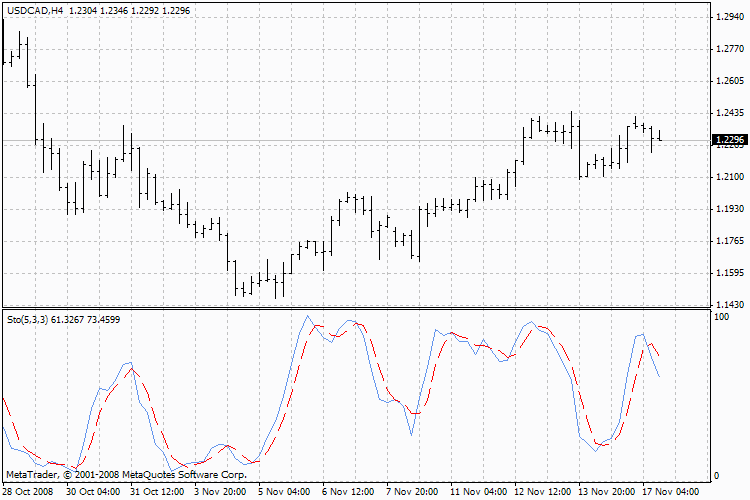
The Stochastic Oscillator Technical Indicator compares where a security’s price closed relative to its price range over a given time period. The Stochastic Oscillator is displayed as two lines. The main line is called %K. The second line, called %D, is a Moving Average of %K. The %K line is usually displayed as a solid line and the %D line is usually displayed as a dotted line.

Stochastic Oscillator, Stochastic
There are several ways to interpret a Stochastic Oscillator. Three popular methods include:
Buy when the Oscillator (either %K or %D) falls below a specific level (e.g., 20) and then rises above that level. Sell when the Oscillator rises above a specific level (e.g., 80) and then falls below that level;
Buy when the %K line rises above the %D line and sell when the %K line falls below the %D line;
Look for divergences. For instance: where prices are making a series of new highs and the Stochastic Oscillator is failing to surpass its previous highs.
The Stochastic Oscillator has three variables:
%K periods (Pk). This is the number of time periods used in %K calculation. By default is 5;
%K Slowing Periods (Sk). This value controls the internal smoothing of %K. A value of 1 is considered a fast stochastic; a value of 3 is considered a slow stochastic. By default is 3;
%D periods (Pd). This is the number of time periods used when calculating a moving average of %K. By default is 3;
The formula for %K is:
%K = 100*SUM (CLOSE - MIN (LOW, Pk), Sk) / SUM (MAX (HIGH, Pk) - MIN (LOW, Pk)), Sk)
Where:
CLOSE — is today’s closing price;
MIN (LOW, Pk) — is the lowest low in Pk periods;
MAX (HIGH, Pk) — is the highest high in Pk periods;
SUM (CLOSE - MIN (LOW, Pk), Sk) — amount composed CLOSE - MIN (LOW, Pk) for period Sk;
SUM (MAX (HIGH, Pk) - MIN (LOW, Pk)), Sk) — amount composed HIGH (Pk)) - MIN (LOW, Pk) for period Sk.
The %D moving average is calculated according to the formula:
%D = SMA (%K, Pd)
Where:
Pd — is the smoothing period for %K;
SMA — is the Simple Moving Average.
Technical Indicator Description
Full description of Stochastic is available in the Technical analysis: Stochastic Oscillator
由MetaQuotes Ltd译自俄语
原代码: https://www.mql5.com/ru/code/7792
 相对强弱指数指标(Relative Strength Index, RSI)
相对强弱指数 (RSI) 技术指标是在0到100之间跟随价格的震荡指标.
 抛物线止损与反转指标(Parabolic SAR, Parabolic)
抛物线止损与反转指标的开发是用于分析市场的趋势变化的.
