• Genel bakış
  • İncelemeler (2)
  • Yorumlar (12)
  • Yenilikler

Ichimoku Trend Finder MT5

5

40% off. Original price: $50  (Ends in May 15th)

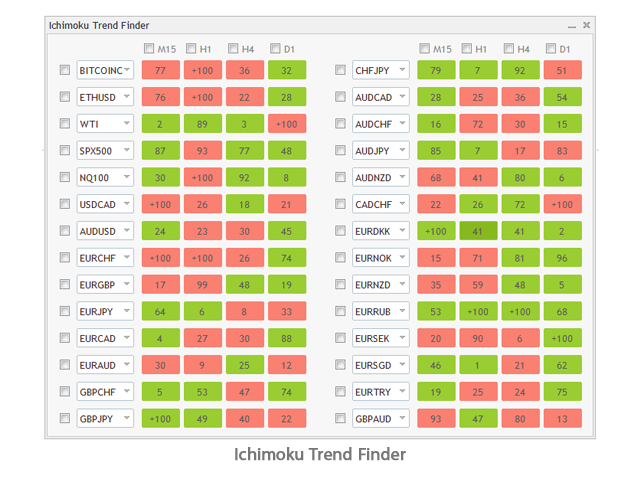
Ichimoku Trend Finder is a multi symbol multi timeframe trend dashboard that helps traders to monitor and identify potential market trends from one chart.

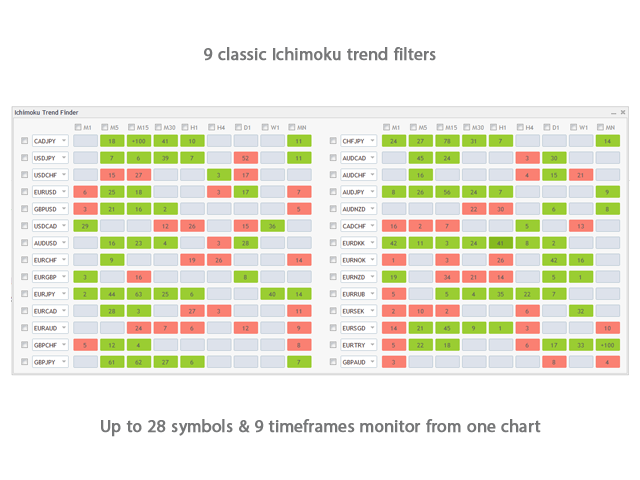
This panel scans the Ichimoku Kinko Hyo indicator in 28 configurable instruments and 9 timeframes for classic Ichimoku trend signals with a deep scan feature to scan all market watch symbols (up to 1000 instruments!).    


Download Demo here (Scans only M1 and M6)

Settings description here

MT4 version here


After the purchase, don't forget to message me to receive a copy of the MT4 full version for 1 trading account as a bonus.


Ichimoku Trend Finder features:

  • Multi timeframe, multi symbol customizable scan of the Ichimoku indicator. 
  • Scans Ichimoku cloud, Tenkan sen(Conversion Line), Kijun sen(Base Line), Senkou span A, Senkou span B, and Chikou span relative to price, and more.
  • Deep Scan mode to scan all market watch symbols for Ichimoku trend in a chosen timeframe.
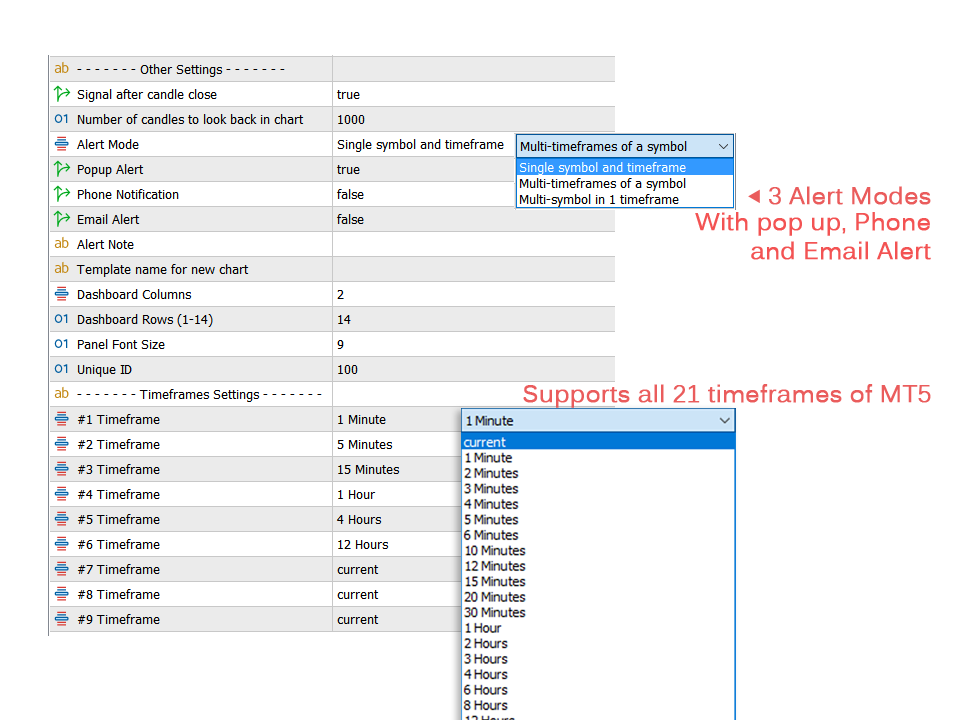
  • You can choose between 3 alert modes: 
  1. Single symbol and timeframe
  2. Multiple timeframes of a symbol
  3. Multiple symbols for a timeframe
      • Support all 21 timeframes of MT5.
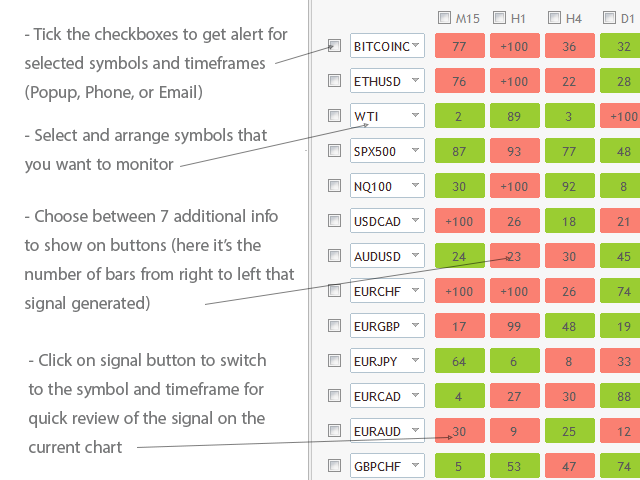
      • Quick review of signals on the same chart by clicking on signal buttons.
      • Easy setup and arrange of symbols in any order with any instrument that your broker provides.
      • Popup, email, and phone notification alerts for selected symbols and timeframes.


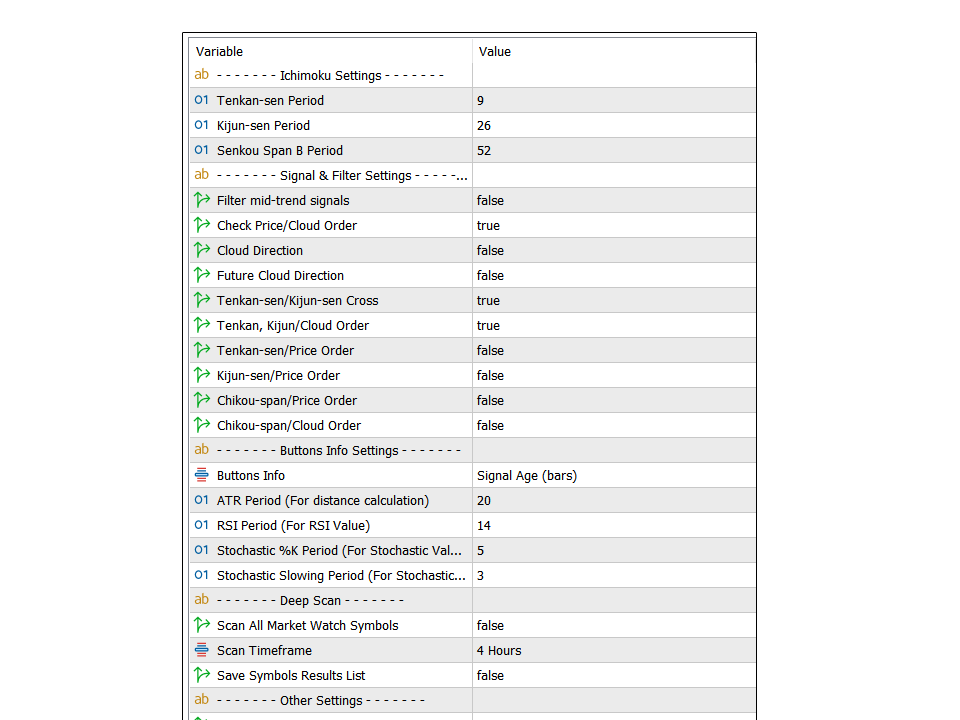
      There are 9 classic Ichimoku trend filters you can enable/disable in settings, when these conditions are met dashboard cell turns "green/red":

      Price/Cloud Order: Checks the price position relative to the cloud.

      Cloud Direction: Checks the current cloud color to see if its direction turned yet or not (Senkou span A and B order).

      Future Cloud Direction: Checks if the future cloud direction matches the price/cloud position (Shifted Senkou span A and B order).

      Tenkan-sen/Kijun-sen Cross: Checks if Tenkan sen crossed Kijun sen in the direction of the trend.

      Tenkan, Kijun/Cloud Order: Checks if both Tenkan sen and Kijun sen are above the cloud in an uptrend or below the cloud in a downtrend.

      Tenkan-sen/Price Order: Checks if price is above Tenkan sen in uptrend or below Tenkan sen in downtrend.

      Kijun-sen/Price Order: Checks if price is above Kijun sen in uptrend or below Kijun sen in downtrend. 

      Chikou-span/Price Order: Checks if Chikou span is above price in uptrend or below price in downtrend. 

      Chikou-span/Cloud Order: Checks if Chikou span is above the cloud in uptrend or below the cloud in downtrend. 


      Dashboard buttons:

      By clicking on dashboard signals you can open the symbol and timeframe of the signal on the current chart. You can also choose between 6 information about the signal to show on dashboard buttons:

      1. Cloud Height, based on ATR  value of the symbol and timeframe.
      2. Price to Cloud Distance, based on ATR.
      3. Price vs Cloud Cross Age, which shows the number of the bar from right to left that price crossed the cloud.
      4. Price to Kijun-sen Distance, based on ATR like above.
      5. RSI Value of RSI indicator.
      6. Stochastic Value of Stochastic indicator.
      7. Signal age shows the number of the bar from right to left that signal occurred.

      Note that button info doesn't work as a signal filter and it's just additional information.


      Some Notes:

      1. The signals of this Ichimoku scanner are not Buy/Sell signals. They indicate a potential market trend that should be checked. If you have a particular Ichimoku trading system you can set up the indicator accordingly to get buy/sell signals.
      2. If you want to monitor more than 28 instruments in Ichimoku dashboard you can load the indicator on another chart, set a different "Unique ID" in the indicator settings and set different symbols for it.
      3. The symbols that you want to add to the dashboard must be visible in the MetaTrader market watch window. The first time you run the indicator or load a new symbol in the dashboard it might take a few seconds to update its data and show signals.


      If you trade strong price moves or any type of consolidation breakouts, you may want to try the Reward Multiplier tool.


      İncelemeler 2
      Roman Zakurdaiev
      85
      Roman Zakurdaiev 2022.11.02 17:48 
       

      Perfect

      Önerilen ürünler
      The Expert Advisor and the video are attached in the Discussion tab . The robot applies only one order and strictly follows the signals to evaluate the indicator efficiency. Pan PrizMA CD Phase is an option based on the Pan PrizMA indicator. Details (in Russian). Averaging by a quadric-quartic polynomial increases the smoothness of lines, adds momentum and rhythm. Extrapolation by the sinusoid function near a constant allows adjusting the delay or lead of signals. The value of the phase - wave s
      PZ Trend Trading MT5
      PZ TRADING SLU
      3.67 (3)
      Trend Trading is an indicator designed to profit as much as possible from trends taking place in the market, by timing pullbacks and breakouts. It finds trading opportunities by analyzing what the price is doing during established trends. [ Installation Guide | Update Guide | Troubleshooting | FAQ | All Products ] Trade financial markets with confidence and efficiency Profit from established trends without getting whipsawed Recognize profitable pullbacks, breakouts and early reversals The ind
      MACDivergence MTF MT5
      Pavel Zamoshnikov
      4.17 (6)
      Advanced ideas of the popular MACD indicator: It detects and displays classic and reverse divergences (two methods of detecting divergences). It uses different color to highlight an uptrend and a downtrend. Two methods of determining a trend: а) MACD crosses the 0 level (classic signal); б) MACD crosses its own average (early signal). This is a multi-timeframe indicator: it can display MACD data from other timeframes. Two methods of drawing: classic histogram and line. It generates sound and vis
      To get access to MT4 version please click   here . This is the exact conversion from TradingView: "Schaff Trend Cycle" by "everget". This is a light-load processing indicator. This is a non-repaint indicator. Buffers are available for processing in EAs. All input fields are available except fillings(due to graphical aesthetics). You can message in private chat for further changes you need. Thanks for downloading
      Gekko MACD Plus
      Rodrigo Galeote
      3 (3)
      Type: Oscillator This is Gekko's Cutomized Moving Average Convergence/Divergence (MACD), a customized version of the famous MACD indicator. Use the regular MACD and take advantage of several entry signals calculations and different ways of being alerted whenever there is potential entry point. Inputs Fast MA Period: Period for the MACD's Fast Moving Average (default 12); Slow MA Period: Period for the MACD's Slow Moving Average (default 26); Signal Average Offset Period: Period for the Signal
      An oscillator that shows price changes and identifies areas of overbought and oversold. It can also show trend reversal points. WaveTrend Oscillator is a port of a famous TS /MT indicator. When the oscillator is above the overbought band (red lines) and crosses down the signal (solid line), it is usually a good SELL signal. Similarly, when the oscillator crosses above the signal when below the Oversold band (green lines), it is a good BUY signal. Good luck.
      MetaCOT 2 is a set of indicators and specialized utilities for the analysis of the U.S. Commodity Futures Trading Commission reports. Thanks to the reports issued by the Commission, it is possible to analyze the size and direction of the positions of the major market participants, which brings the long-term price prediction accuracy to a new higher-quality level, inaccessible to most traders. These indicators, related to the fundamental analysis, can also be used as an effective long-term filter
      This is Gekko's Cutomized Relative Strength Index (RSI), a customized version of the famous RSI indicator. Use the regular RSI and take advantage two entry signals calculations and different ways of being alerted whenever there is potential entry or exit point. Inputs Period: Period for the RSI calculation; How will the indicator calculate entry (swing) signals: 1- Produces Exit Signals for Swings based on RSI entering and leaving Upper and Lower Levels Zones; 2- Produces Entry/Exit Signals fo
      An Ultimate Tool  for quick and efficient market analysis. Unique combination of solid indicators defining market direction for trend tracking and filtration designed for you to stay on the   right   side of the market. Market Rider Oscillators  gives you access to one of the most used from professional trades indicators on worldwide, which were not build in for MT4 and MT5 terminals . These are unique non-repainting oscillators designed to be used on all time frames for all instruments class
      Технический индикатор Universal Oscillator является комбинацией торговых сигналов самых популярных и широко используемых осцилляторов. Индикатор представлен гистограммами, а также линиями fast и slow MA, что позволяет расширить список получаемых торговых рекомендаций и работать как по тренду, так и в боковом движении рынка. Таким образом, гистограммы позволяют определить момент пробоя ценовых значений и движение в новой фазе рынка, а линии указывают на зоны перекупленности и перепроданности.  Ос
      Reservoir is a reversal indicator and is part of a special category of instruments. The indicator not only analyzes the price movement, but also indicates the points of possible reversals. This contributes to the quick and optimal opening of buy or sell orders (depending on the current situation). In this case, the historical data of the analyzed asset is necessarily taken into account. It is the correct implementation of such actions that in many ways helps traders make the right decision in t
      25% off. Original price: $40 (Ends in May 15th) Stochastic Scanner is a multi symbol multi timeframe Stochastic dashboard that monitors the indicator for price entering and exiting overbought and oversold in up to 28 symbols and 9 timeframes. Download Demo here  (Scans only M1, M5 and M10) Settings description   here MT4 version   here Stochastic Scanner features: Signals price entering and exiting the overbought and oversold zones. Monitors up to 28 customizable instruments and 9 timeframe
      Description : Rainbow EA MT5 is a simple Expert advisor based on   Rainbow MT5 indicator witch is based on Moving average with period 34. The indicator is incorporated in the EA, therefore, it is not required for the EA to operate, but if you wish, you can download it from   my product page . The Expert Advisor settings are as follows : Suitable for Timeframes up to H1 The parameters below can be set according to your trading rules. StopLoss ( Stop Loss in pips) TakeProfit ( Take Profit in pi
      GIVE A LOOK TO MY OTHER PRODUCTS ! 100 % PER MONTH PROFIT---- MY NEW SIGNAL HERE ------->   https://www.mql5.com/en/signals/2162238?source=Site+Signals+My# BROKEN TRENDLINE ALERT IS A SIMPLE TOOL INDICATOR. JUST DRAW IN YOUR CHART A DYNAMIC OR STATIC TRENDLINE,AND THE INDICATOR WILL SEND YOU ALERT WHENEVER THE PRICE CROSSES BELOW OR ABOVE YOUR DRAWN TRENDLINE. IT WORKS IN ANY TIMEFRAME AND ANY CHART YOU WANT.JUST GOT A VPS AND DON'T STRESS IN FRONT OF YOUR COMPUTER. FOR ANY KIND OF QUESTION
      Gartley Projections D
      Oleksandr Medviediev
      3 (2)
      The indicator identifies the harmonic patterns (XABCD) according to developments of H.M.Gartley ( "Profits in the Stock Market" , 1935г). It projects D-point as a point in the perspective projection (specify ProjectionD_Mode = true in the settings). Does not redraw. When a bar of the working timeframe closes, if the identified pattern point has not moved during Patterns_Fractal_Bars bars, an arrow appears on the chart (in the direction of the expected price movement). From this moment on, the ar
      MACD ( M oving   A verage   C onvergence/ D ivergence) is a widely used indicator in technical analysis. What makes the MACD such a valuable tool for technical analysis is that it effectively combines two indicators into one. It can help to identify trends and measure momentum simultaneously. SX Advanced MACD for MT4 is available   here . SX Advanced MACD   indicator takes this concept further by plotting two distinct MACD indicators on a single chart, facilitating clear visual correlation betwe
      [ MT4 Version ] Order Block Indicator MT5 Order Block Indicator MT5 is currently the most accurate and customizable indicator in the market. It has been developed to facilitate the analysis of operations based on Order Blocks and Supply and Demand Zones. These zones are possible reversal points of a movement. Order Blocks indicate a possible accumulation of orders in one area. The price usually gets to reach and react strongly to those areas. The most relevant levels for this reaction are the c
      MACD Divergence on MT5
      KEENBASE SOFTWARE SOLUTIONS
      KT MACD Divergence shows the regular and hidden divergences build between the price and oscillator. If your trading strategy anticipates the trend reversal, you can include the MACD regular divergence to speculate the potential turning points. And if your trading strategy based on the trend continuation, MACD hidden divergence would be a good fit. Limitations of KT MACD Divergence Using the macd divergence as a standalone entry signal can be a risky affair. Every divergence can't be interpr
      The moment when the MACD line crosses the signal line often leads to a significant price movement and trend changes. MACD Cross Prediction is an indicator that uses OSMA(MACD oscillator) and a red line. You can change the level of the red line on the indicator setting popup(and the red line moves up and down). The alerts(email, mobile push, sound, MT5 alert) will be sent when the MACD histogram touches the red line, which means the alerts can be sent just before/around the time when the MACD
      Paula Bollinger Bands Strategy
      Francisco Gomes Da Silva
      4 (2)
      Bollinger bands out/in strategy A strategy created by Joe Ross, and very useful for finding trades when the market is overloaded. Indicator You don't need to find where there are entries on the chart, this indicator shows them for you. The entrance The trade is confirmed when the price closes outside the bollinger bands on a candle and the candle after the price closes inside the bands. comment I want to improve this indicator, so you can help me sending me your reviews and comments, thanks :).
      FREE
      SuperTrend Indicator for MT5
      Vijaykumar Jayantilal Panchal
      Supertrend, Olivier Sebam tarafından yatırımcıların eğilimleri belirlemelerine ve bir finansal varlığı ne zaman alıp ne zaman satacaklarını bilmelerine yardımcı olmak için - yukarıda belirtildiği gibi - geliştirilen nispeten popüler olmayan bir teknik göstergedir. Gösterge, TradingView ve MetaTrader'da varsayılan olarak bulunmaz. Yine de piyasada özel yapım Supertrend göstergelerini bulabilirsiniz. Bir grafiğe uygulandığında, süper trend göstergesi iki rengiyle görünür. Değiştirilebilir olsal
      To get access to MT4 version please click here . This is the exact conversion from TradingView: "[SHK] Schaff Trend Cycle (STC)" by "shayankm". This is a light-load processing indicator. This is a non-repaint indicator. Buffers are available for processing in EAs. All input fields are available. You can message in private chat for further changes you need. Thanks for downloading
      The Antique Trend Indicator is a revolutionary trend trading and filtering solution with all the important features of a trend tool built into one tool! The Antique Trend indicator is good for any trader, suitable for any trader both for Forex and binary options. There is no need to configure anything, everything has been perfected by time and experience, it works great during flats and trends. The Antique Trend indicator is a tool for technical analysis of financial markets, reflecting curre
      Surf Board
      Mohammadal Alizadehmadani
      Benefits of the Surfboard indicator : Entry signals without repainting If a signal appears and is confirmed, it does NOT disappear anymore, unlike indicators with repainting, which lead to major financial losses because they can show a signal and then remove it. perfect opening of trades The indicator algorithms allow you to find the Peak and floor position to enter a deal (buy or sell an asset), which increases the success rate for each and every trader using it. Surfboard works with any asse
      Very special indicator of Joe Dinapoli which is a derivative  of a Detrended Oscillator. Through a set of parametric equations, a predicting oscillator is created that forecasts, one period ahead of time, overbought and oversold conditions. The resulting predictor values are expressed as bands on the bar chart, both above and below the market. It may be mistaken as a Bollinger Band but has no resemblance to it whatsoever. The Predictor bands may be used in a variety of ways to aid in entering an
      DYJ süper eğilim dalgaları çok kesin bir dalga ve dalga ticareti sistemidir Bu işaretçi piyasadan çıktığında mum hattının en yüksek ve en düşük noktasını arar Giriş fiyatı en yüksek veya en düşük noktaya yakın Sinyal uyarı türü dyj supertrend'e eklendi Çok boyutlu bir sinyal oluşturduğunuzda Aşağıdaki türden uyarı sinyalleri kullanılabilir: Alert mailSend, MobilePush Receive Input InpSignalPeriod = 10 BarDistance = 24 InpIsAlert = true
      To get access to MT4 version please click here . - This is the exact conversion from TradingView: "Stochastic Momentum Index" By "UCSgears". - This is a popular version of stochastic oscillator on tradingview. - This is a light-load processing and non-repaint indicator. - Buffers are available for the lines on chart. - You can message in private chat for further changes you need. Thanks for downloading
      Elliott Wave Trend was designed for the scientific wave counting. This tool focuses to get rid of the vagueness of the classic Elliott Wave Counting using the guideline from the template and pattern approach. In doing so, firstly Elliott Wave Trend offers the template for your wave counting. Secondly, it offers Wave Structural Score to assist to identify accurate wave formation. It offers both impulse wave Structural Score and corrective wave Structure Score. Structural Score is the rating to sh
      Xtrade Trend Detector
      Dago Elkana Samuel Dadie
      Xtrade Trend Detector is an indicator capable of finding the best opportunities to take a position in any stock market. Indeed, it is a great tool for scalpers but also for Daytraders. You could therefore use it to identify areas to trade, it fits easily on a chart. I use it to detect trends on Big timeframes and take positions on Small timeframes. Don't hesitate to give me a feedback if you test it.
      Gartley Hunter Multi
      Siarhei Vashchylka
      5 (5)
      Gartley Hunter Multi - An indicator for searching for harmonic patterns simultaneously on dozens of trading instruments and on all classic timeframes: (m1, m5, m15, m30, H1, H4, D1, Wk, Mn). Manual (Be sure to read before purchasing) | Version for MT4 Advantages 1. Patterns: Gartley, Butterfly, Shark, Crab. Bat, Alternate Bat, Deep Crab, Cypher 2. Simultaneous search for patterns on dozens of trading instruments and on all classic timeframes 3. Search for patterns of all possible sizes. Fr
      Bu ürünün alıcıları ayrıca şunları da satın alıyor
      Öncelikle, bu Ticaret Sistemi'nin Non-Repainting, Non-Redrawing ve Non-Lagging Göstergesi olduğunu vurgulamak önemlidir, bu da hem manuel hem de robot ticareti için ideal hale getirir. "Smart Trend Trading System MT5", yeni ve deneyimli tüccarlar için özelleştirilmiş kapsamlı bir ticaret çözümüdür. 10'dan fazla premium göstergeyi birleştiriyor ve 7'den fazla sağlam ticaret stratejisi sunuyor, bu da çeşitli piyasa koşulları için esnek bir seçim yapar. Trend Takip Stratejisi: Trendleri etkili bir
      Öncelikle belirtmek gerekir ki bu Ticaret Göstergesi Yeniden Çizim Yapmaz, Gecikmez ve Gecikme Göstermez, bu da hem manuel hem de robot ticareti için ideal hale getirir. Atom Analisti, Piyasada Daha İyi Bir Avantaj Bulmak İçin Fiyatın Gücünü ve Momentumunu Kullanan PA Fiyat Hareketi Göstergesidir. Gürültüleri ve Yanlış Sinyalleri Kaldırmaya ve Ticaret Potansiyelini Artırmaya Yardımcı Olan Gelişmiş Filtrelerle Donatılmıştır. Birden fazla katmanlı karmaşık göstergeler kullanarak, Atom Analisti
      Quantum Trend Sniper
      Bogdan Ion Puscasu
      5 (37)
      Tanıtım       Kuantum Trend Keskin Nişancı Göstergesi   , trend tersine dönmeleri belirleme ve ticaret yapma şeklinizi değiştiren çığır açan MQL5 Göstergesi! 13 yılı aşkın ticaret tecrübesine sahip deneyimli tüccarlardan oluşan bir ekip tarafından geliştirilmiştir.       Kuantum Trend Keskin Nişancı Göstergesi       trend dönüşlerini son derece yüksek doğrulukla belirlemenin yenilikçi yolu ile ticaret yolculuğunuzu yeni zirvelere taşımak için tasarlanmıştır. ***Kuantum Trend Keskin Nişancı Gö
      Trend Screener Pro MT5
      STE S.S.COMPANY
      4.87 (62)
      Trend Göstergesi, Trend Alım Satım ve Filtreleme için Çığır Açan Benzersiz Çözüm, Tüm Önemli Trend Özellikleriyle Tek Bir Araç İçinde Yerleştirildi! Forex, emtialar, kripto para birimleri, endeksler ve hisse senetleri gibi tüm sembollerde/araçlarda kullanılabilen %100 yeniden boyamayan çoklu zaman çerçevesi ve Çoklu para birimi göstergesidir. Trend Screener, grafikte noktalarla ok trend sinyalleri sağlayan etkili bir trend trend göstergesidir. Trend analizörü göstergesinde bulunan özellikler: 1.
      FX Volume MT5
      Daniel Stein
      4.94 (17)
      Sabah Brifingimiz aracılığıyla ayrıntılar ve ekran görüntüleri ile günlük piyasa güncellemenizi alın burada mql5 ve on Telegram ! FX Volume, bir brokerin bakış açısından piyasa duyarlılığı hakkında GERÇEK bir fikir veren İLK ve TEK hacim göstergesidir. COT raporlarından çok daha hızlı bir şekilde, brokerlar gibi kurumsal piyasa katılımcılarının Forex piyasasında nasıl konumlandıklarına dair harika bilgiler sağlar. Bu bilgileri doğrudan grafiğinizde görmek, ticaretiniz için gerçek oyun değiştir
      Öncelikle, bu Ticaret Aracının Non-Repainting, Non-Redrawing ve Non-Lagging Gösterge olduğunu vurgulamakta fayda var, bu da onu profesyonel ticaret için ideal hale getiriyor. Akıllı Fiyat Hareketi Kavramları Göstergesi, hem yeni hem de deneyimli tüccarlar için çok güçlü bir araçtır. İleri ticaret fikirlerini, Inner Circle Trader Analizi ve Smart Money Concepts Ticaret Stratejileri gibi 20'den fazla kullanışlı göstergeyi bir araya getirerek bir araya getirir. Bu gösterge, büyük kurumların tica
      Advanced Supply Demand MT5
      Bernhard Schweigert
      4.53 (15)
      Herhangi bir Acemi veya Uzman Tüccar için En İyi Çözüm! Bu gösterge benzersiz, yüksek kaliteli ve uygun fiyatlı bir ticaret aracıdır çünkü bir dizi tescilli özelliği ve yeni bir formülü bir araya getirdik. Bu güncelleme ile çift zaman dilimi dilimlerini gösterebileceksiniz. Yalnızca daha yüksek bir TF gösteremeyeceksiniz, aynı zamanda TF grafiğini ve ARTIK daha yüksek TF'yi de gösterebileceksiniz: YUVARLAK BÖLGELERİ GÖSTERMEK. Tüm Arz Talebi tüccarları buna bayılacak. :) Önemli Bilgiler Açıkland
      AW Trend Predictor MT5
      AW Trading Software Limited
      4.76 (55)
      Tek bir sistemde trend ve kırılma seviyelerinin kombinasyonu. Gelişmiş bir gösterge algoritması piyasa gürültüsünü filtreler, trendi, giriş noktalarını ve olası çıkış seviyelerini belirler. Gösterge sinyalleri, sinyal geçmişinin etkinliğini gösteren en uygun enstrümanların seçilmesine izin veren bir istatistiksel modüle kaydedilir. Gösterge Kâr Al ve Zararı Durdur işaretlerini hesaplar. Kılavuz ve talimatlar ->   BURAYA   / MT4 versiyonu ->   BURAYA Gösterge ile nasıl ticaret yapılır: Trend Pre
      TPSpro TRENDPRO  - is a trend indicator that automatically analyzes the market and provides information about the trend and each of its changes, as well as giving signals for entering trades without redrawing! The indicator uses each candle, analyzing them separately. referring to different impulses - up or down impulse. Exact entry points into transactions for currencies, crypto, metals, stocks, indices!  -  Version MT4                  DETAILED DESCRIPTION        /       TRADING SETUPS       
      A key element in trading is zones or levels from which decisions to buy or sell a trading instrument are made. Despite attempts by major players to conceal their presence in the market, they inevitably leave traces. Our task was to learn how to identify these traces and interpret them correctly. Reversal First Impulse levels (RFI)   -  Version MT4                  INSTRUCTIONS                 RUS                 ENG                         R ecommended to use with an indicator   -  TREND PRO  
      Top indicator for MT5   providing accurate signals to enter a trade without repainting! It can be applied to any financial assets:   forex, cryptocurrencies, metals, stocks, indices .  Watch  the video  (6:22) with an example of processing only one signal that paid off the indicator! MT4 version is here It will provide pretty accurate trading signals and tell you when it's best to open a trade and close it. Most traders improve their trading results during the first trading week with the help of
      RelicusRoad Pro MT5
      Relicus LLC
      4.82 (22)
      Şimdi 147 $ (birkaç güncellemeden sonra 499 $ 'a yükseliyor) - Sınırsız Hesaplar (PC'ler veya Mac'ler) RelicusRoad Kullanım Kılavuzu + Eğitim Videoları + Özel Discord Grubuna Erişim + VIP Durumu PİYASAYA BAKMAK İÇİN YENİ BİR YOL RelicusRoad, forex, vadeli işlemler, kripto para birimleri, hisse senetleri ve endeksler için dünyanın en güçlü ticaret göstergesidir ve yatırımcılara kârlı kalmaları için ihtiyaç duydukları tüm bilgileri ve araçları sağlar. Başlangıç ​​seviyesinden ileri seviyey
      Noize Absorption Index - is the manual trading system that measures the difference of pressure between bears forces and bulls forces. Green line - is a noize free index that showing curent situation. Zero value of index shows totally choppy/flat market.Values above zero level shows how powerfull bullish wave is and values below zero measures bearish forces.Up arrow appears on bearish market when it's ready to reverse, dn arrow appears on weak bullish market, as a result of reverse expectation.
      FX Power MT5 NG
      Daniel Stein
      5 (5)
      Sabah Brifingimiz burada mql5 ve on Telegram! FX Power MT5 NG , uzun zamandır çok popüler olan döviz gücü ölçerimiz FX Power'ın yeni neslidir. Peki bu yeni nesil güç ölçer ne sunuyor? Orijinal FX Power hakkında sevdiğiniz her şey PLUS GOLD/XAU güç analizi Daha da hassas hesaplama sonuçları Ayrı ayrı yapılandırılabilir analiz dönemleri Daha da iyi performans için özelleştirilebilir hesaplama limiti Özel çokluDaha fazlasını görmek isteyenler için örnek ayarlar Her grafikte en sevdiğiniz renkler i
      ICT, SMC, SMART MONEY CONCEPTS, SMART MONEY, Smart Money Concept, Support and Resistance, Trend Analysis, Price Action, Market Structure, Order Blocks, BOS/CHoCH,   Breaker Blocks ,  Momentum Shift,   Supply&Demand Zone/Order Blocks , Strong Imbalance,   HH/LL/HL/LH,    Fair Value Gap, FVG,  Premium  &   Discount   Zones, Fibonacci Retracement, OTE, Buy Side Liquidity, Sell Side Liquidity, BSL/SSL Taken, Equal Highs & Lows, MTF Dashboard, Multiple Time Frame, BigBar, HTF OB, HTF Market Structure
      MetaForecast M5
      Vahidreza Heidar Gholami
      5 (2)
      MetaForecast, fiyat verilerindeki harmonileri kullanarak herhangi bir piyasanın geleceğini tahmin eder ve görselleştirir. Piyasa her zaman tahmin edilemezken, fiyatlarda bir desen varsa, MetaForecast geleceği mümkün olduğunca doğru bir şekilde tahmin edebilir. Benzer ürünlere göre, MetaForecast piyasa eğilimlerini analiz ederek daha kesin sonuçlar üretebilir. Giriş Parametreleri Past size (Geçmiş boyut) MetaForecast'ın gelecekteki tahminler oluşturmak için kullandığı çubuk sayısını belirtir. M
      Professional Scalping Tool on Deriv Attention! The indicator will be sold in limited quantities!!! The previous 5 copies were sold for $250 The next 5 copies will be sold for $350 The next price is $500 Description: This trading indicator is designed for professional traders focused on scalping. Designed with the market in mind, it provides highly accurate spike trading signals. It works on the M1 timeframe and supports the following symbols: Boom 300 Index, Boom 500 Index, Boom 1000 Index,
      The Volume by Price Indicator for MetaTrader 5 features Volume Profile and Market Profile TPO (Time Price Opportunity). Get valuable insights out of currencies, equities and commodities data. Gain an edge trading financial markets. Volume and TPO histogram bar and line charts. Volume Footprint charts. TPO letter and block marker charts including split structures. Versatile segmentation and compositing methods. Static, dynamic and flexible ranges with relative and/or absolute visualizations. Lay
      Black Dragon indicator mt5
      Ramil Minniakhmetov
      4.82 (56)
      Trend algılama göstergesi, herhangi bir stratejiyi tamamlayacak ve bağımsız bir araç olarak da kullanılabilir. ÖNEMLİ! Talimatlar ve bonus almak için satın alma işleminden hemen sonra benimle iletişime geçin!   Faydalar Kullanımı kolay; grafiği gereksiz bilgilerle aşırı yüklemez. Herhangi bir strateji için filtre olarak kullanma yeteneği. Hem kar elde etmek hem de zararı durdurmayı ayarlamak için kullanılabilen, yerleşik dinamik cupport ve direnç seviyeleri içerir. Mum kapandıktan sonra g
      Quantum Heiken Ashi PRO MT5
      Bogdan Ion Puscasu
      4.5 (8)
      Quantum Heiken Ashi PRO ile   tanışın Pazar eğilimleri hakkında net bilgiler sağlamak üzere tasarlanan Heiken Ashi mumları, gürültüyü filtreleme ve yanlış sinyalleri ortadan kaldırma yetenekleriyle ünlüdür. Kafa karıştırıcı fiyat dalgalanmalarına veda edin ve daha sorunsuz, daha güvenilir bir grafik sunumuna merhaba deyin. Quantum Heiken Ashi PRO'yu gerçekten benzersiz kılan şey, geleneksel şamdan verilerini okunması kolay renkli çubuklara dönüştüren yenilikçi formülüdür. Kırmızı ve yeşil çubukl
      IX Power MT5
      Daniel Stein
      5 (2)
      IX Power   nihayet FX Power'ın rakipsiz hassasiyetini Forex dışı sembollere getiriyor. En sevdiğiniz endeksler, hisse senetleri, emtialar, ETF'ler ve hatta kripto para birimlerindeki kısa, orta ve uzun vadeli eğilimlerin yoğunluğunu doğru bir şekilde belirler. Terminalinizin sunduğu   her şeyi analiz   edebilirsiniz. Deneyin ve işlem yaparken   zamanlamanızın   nasıl   önemli ölçüde iyileştiğini   deneyimleyin. IX Power Temel Özellikler 100 hassas, yeniden boyanmayan hesaplama sonuçları -
      Fiyat tersine döndükçe ve geri çekildikçe piyasa yapısından elde edilen kâr değişir. Piyasa yapısını tersine çevirme uyarısı göstergesi, bir trendin veya fiyat hareketinin ne zaman tükenmeye yaklaştığını ve tersine dönmeye hazır olduğunu tanımlar. Genellikle bir geri dönüş veya büyük bir geri çekilme meydana gelmek üzereyken meydana gelen piyasa yapısındaki değişiklikler konusunda sizi uyarır. Gösterge, olası bir tükenme noktasının yakınında her yeni yüksek veya düşük oluştuğunda, başlangıçta
      Blahtech Supply Demand MT5
      Blahtech Limited
      4.57 (14)
      Was: $299  Now: $99   Supply Demand uses previous price action to identify potential imbalances between buyers and sellers. The key is to identify the better odds zones, not just the untouched ones. Blahtech Supply Demand indicator delivers functionality previously unavailable on any trading platform. This 4-in-1 indicator not only highlights the higher probability zones using a multi-criteria strength engine, but also combines it with multi-timeframe trend analysis, previously confirmed swings
      Italo Volume Indicator MT5
      Italo Santana Gomes
      4.73 (15)
      BUY INDICATOR AND GET EA FOR FREE AS A BONUS + SOME OTHER GIFTS! ITALO VOLUME INDICATOR  is the best volume indicator ever created, and why is that? The Indicator works on all time-frames and assets, indicator built after 7 years of experience on forex and many other markets. You know many volume indicators around the internet are not complete, does not help, and it's difficult to trade, but the Italo Volume Indicator is different , the Italo Volume Indicator shows the wave volume, when market
      Tanıtım       Quantum Breakout PRO   , Breakout Bölgeleri ile ticaret yapma şeklinizi değiştiren çığır açan MQL5 Göstergesi! 13 yılı aşkın ticaret tecrübesine sahip deneyimli tüccarlardan oluşan bir ekip tarafından geliştirilmiştir.       Kuantum Breakout PRO       yenilikçi ve dinamik koparma bölgesi stratejisiyle ticaret yolculuğunuzu yeni zirvelere taşımak için tasarlanmıştır. Kuantum Breakout Göstergesi, size 5 kar hedefi bölgesi ile kırılma bölgelerinde sinyal okları ve kırılma kutusuna
      Auto Order Block with break of structure based on ICT and Smart Money Concepts Futures Break of Structure ( BoS )             Order block ( OB )            Higher time frame Order block / Point of Interest ( POI )    shown on current chart           Fair value Gap ( FVG ) / Imbalance   ,  MTF      ( Multi Time Frame )    Volume Imbalance     ,  MTF          vIMB Gap’s Equal High / Low’s     ,  MTF             EQH / EQL Liquidity               Current Day High / Low           HOD /
      XQ Indicator MetaTrader 5
      Marzena Maria Szmit
      5 (1)
      Step into the realm of Forex trading with confidence and precision using XQ, a cutting-edge Forex indicator designed to elevate your trading game to unprecedented heights. Whether you're a seasoned trader or just stepping into the world of currency exchange, XQ Forex Indicator empowers you with the insights and signals needed to make informed trading decisions. The signal conditions are a combination of three indicators, and XQ Forex Indicator only display  medium and long-term trends . The ind
      Owl Smart Levels MT5
      Sergey Ermolov
      4.49 (37)
      MT4 versiyonu  |  FAQ Owl Smart Levels Indicator , Bill Williams'ın gelişmiş fraktalları , piyasanın doğru dalga yapısını oluşturan Valable ZigZag ve kesin giriş seviyelerini gösteren Fibonacci seviyeleri gibi popüler piyasa analiz araçlarını içeren tek gösterge içinde eksiksiz bir ticaret sistemidir. pazara ve kar elde edilecek yerlere. Stratejinin ayrıntılı açıklaması Gösterge ile çalışma talimatı Baykuş Yardımcısı ticaretinde Danışman Yardımcısı Kullanıcıların özel sohbeti -> Satın aldıktan
      Good day! I present to you a trading technical indicator for Deriv broker synthetic indices. This indicator ONLY works with the following indices: Boom 300 Index Boom 500 Index Boom 1000 Index Crash 300 Index Crash 500 Index Crash 1000 Index The indicator was created to give signals to open medium-term trades in the direction of Spikes. But you can open trades in the opposite direction to Spikes, at your own risk. Trade only on M1. Other TFs do not guarantee the correct operation of the indic
      Eng Gold
      Ely Alkrar Xshkaky
      ENG-GOLD Scalper It is an auxiliary indicator that identifies potential targets and determines the place of entry with a stop loss that works on Heiken Ashi candles  The green lines are usually the targets, the red lines are the stop loss, and the yellow lines are the entry location.  This file is recognized on small and medium frames, usually less than the watch frame I highly recommend using XAUUSD US100 US30 USOIL 
      Yazarın diğer ürünleri
      50% off. Original price: $60 (Ends in May 15th) MACD Divergence Scanner is a multi-timeframe and multi-symbol dashboard and alert that checks all timeframes and symbols to find regular and hidden divergences between price chart and MACD indicator. This divergence scanner is integrated   with support and resistance zones so you can check the MACD divergences in the most important areas of the chart to find trend reversals in the price chart. Download demo version   (works on M4,M5,M6,M12,H3,H8
      50% off. Original price: $60 (Ends in May 15th) RSI Divergence Scanner is a multi-timeframe and multi-symbol dashboard and alert that checks all timeframes and symbols to find divergences between price chart and RSI indicator. This divergence scanner is integrated with support and resistance zones so you can check the RSI divergences in the most important areas of the chart to find trend reversals in the price chart. Download demo version   (works on M 1,M5,M30,W1 timeframes) Full description
      40% off. Original price: $50   (Ends in May 15th) Support and Resistance Dashboard for MT5 is a multi-timeframe and multi-symbol scanner and alert system that finds S/R zones and pivot points for all timeframes and symbols and alerts when price has interaction with them. If you are using support and resistance (or supply and demand) zones in your trading strategy, this dashboard and its alert and filtering system is a big time saver for you. Download demo version   (works on M4,M5,M6,M12,H3,H8 
      50% off. Original price: $60 (Ends in May 15th) Candlestick Pattern Scanner is a multi-timeframe and multi-symbol dashboard and alert system that checks all timeframes and currency pairs for different candlestick patterns that are formed in them. Scanner is integrated   with support and resistance zones so you can check the candlestick patterns in most important areas of the chart to find breakout and reversal patterns in the price chart. Download demo version   (works on M4,M5,M6,M12,H3,H8 tim
      RSI divergence indicator finds divergences between price chart and   RSI   indicator and informs you with alerts (popup, mobile notification or email). Its main use is to find trend reversals in the chart. Always use the divergence indicators with other technical assets like support resistance zones, candlestick patterns and price action to have a higher possibility to find trend reversals. Three confirmation type for   RSI   divergences: RSI   line cross 50 level Price returns to previous H/L C
      FREE
      50% off. Original price: $375  (Ends in May 15th) Reward Multiplier is a semi-automatic trade manager based on pyramid trading that opens additional orders with the running profit of your trades to maximize return exponentially without increasing the risk. Unlike other similar EAs, this tool shows potential profit/loss and reward to risk ratio before even entering the first trade! Download Demo here  (starting lot is fixed at 0.01) Guide + tips here MT5 version   here You only open the firs
      50% off. Original price: $60 (Ends in May 15th) RSI Divergence Scanner is a multi-timeframe and multi-symbol dashboard and alert that checks all timeframes and symbols to find regular and hidden divergences between price chart and RSI indicator. This divergence scanner is integrated with support and resistance zones so you can check the RSI divergences in the most important areas of the chart to find trend reversals in price chart. Download demo version   (works on M4,M5,M6,M12,H3,H8 timeframes
      50% off. Original price: $375 (Ends in May 15th) Reward Multiplier is a semi-automatic trade manager based on pyramid trading that opens additional orders with the running profit of your trades to maximize return exponentially without increasing the risk. Unlike other similar EAs, this tool shows potential profit/loss and reward to risk ratio before even entering the first trade! Download Demo here  (starting lot is fixed at 0.01) Guide + tips here MT4 version   here You only open the first ord
      40% off. Original price $50 (Ends in May 15th) ATR Scanner Pro is a multi symbol multi timeframe volatility scanner that monitors and analyzes Average True Range indicator value in up to 28 symbols and 9 timeframes in 3 modes : ATR value:  As a volatility dashboard it shows the ATR indicator value in all pairs and timeframes and signals when the ATR value reaches a maximum or minimum in a given duration. Short term ATR/Long term ATR ratio:  It shows ratio of 2 ATRs with different periods. It's
      25% off. Original price: $40 (Ends in May 15th) Order Manager is a trade assistant with money manager that helps traders open, modify and close manual trades in a simple way to help them focus more on their market analysis and open orders with just a few clicks. Download Demo here  (It only works on demo accounts) Full guide   here MT5 version here Order Manager features: Works on all instruments such as currency pairs, CFD, metals, cryptocurrencies, etc. Proper money management with a buil
      RSI divergence indicator finds divergences between price chart and RSI   indicator and informs you with alerts (popup, mobile notification or email). Its main use is to find trend reversals in the chart. Always use the divergence indicators with other technical assets like support resistance zones, candlestick patterns and price action to have a higher possibility to find trend reversals. Three confirmation type for RSI   divergences: RSI   line cross 50 level Price returns to previous H/L Creat
      FREE
      MACD divergence indicator finds divergences between price chart and MACD indicator and informs you with alerts (popup, mobile notification or email) . Its main use is to find trend reversals in the chart. Always use the divergence indicators with other technical assets like support resistance zones, candlestick patterns and price action to have a higher possibility to find trend reversals. Three confirmation type for MACD divergences: MACD line cross zero level Price returns to previous H/L Crea
      FREE
      Ichimoku Trend Alert is the Ichimoku Kinko Hyo indicator with Alerts and signal filters. Ichimoku Trend Alert features: Optional check of Ichimoku cloud, Tenkan sen(Conversion Line), Kijun sen(Base Line), Senkou span A, Senkou span B, and Chikou span relative to price, and more. Popup, email, and phone notification alerts for selected symbols and timeframes. There are 9 classic Ichimoku trend filters you can enable/disable in settings: Price/Cloud Order:   Checks the price position relative
      FREE
      50% off. Original price: $60 Triangle Finder is a multi symbol multi timeframe dashboard that finds symmetrical triangle pattern in 28 symbols and 9 timeframes with a deep scan feature to scan all market watch symbols (up to 1000 instruments!). Download Demo here  (Scans only M1, M5 and M10) Settings description   here MT4 version   here Triangle Finder features: Realtime monitoring of 28 customizable instruments and 9 timeframes at the same time. Deep scan mode to scan all market watch sym
      Moving Average Trend Alert is a triple MA indicator that helps traders to identify potential market trends based on 3 MAs alignment and crossover. Moving Average Trend Alert features: Customizable short-term, medium-term, and long-term MAs. Option to filter signals based on a minimum distance between moving averages to avoid premature MAs alignment. Optional Filter of signals with RSI indicator overbought/oversold levels. Optional Filter of signals with ADX indicator. Popup, email, and phone n
      FREE
      50% off. Original price: $60 (Ends in May 15th) Ichimoku Assistant is a multi-timeframe panel and alert system that scans all timeframes for multiple rules related to different ichimoku strategies. The Ichimoku indicator has 5 different lines, including Tenkan-sen, Kijun-sen, Senku Span A, Senku Span B and Chikou Span. This scanner checks the status of these lines compared to each other and gives alert based on your selected rules. If you are using ichimoku kinko hyo in your trading strategy, t
      25% off. Original price: $40 (Ends in May 15th) Order Manager is a trade assistant with money manager that helps traders open, modify and close manual trades in a simple way to help them focus more on their market analysis and open orders with just a few clicks. Download Demo here  (It only works on demo accounts) Full guide   here MT4 version here Order Manager features: Works on all instruments such as currency pairs, CFD, metals, cryptocurrencies, etc. Proper money management with a buil
      40% off. Original price: $50 (Ends in May 15th) Advanced Bollinger Bands Scanner is a multi symbol multi timeframe Bollinger bands dashboard that monitors and analyzes the Bollinger Bands indicator from one chart. This panel monitors the Bollinger bands indicator in up to 28 configurable instruments and 9 timeframes for price overbought/oversold, price consolidation (Bollinger bands squeeze), and consolidation breakout (squeeze break)  with a deep scan feature to scan all market watch symbols (
      50% off. Original price: $60  (Ends in May 15th) Candlestick Pattern Scanner is a multi-timeframe and multi-symbol dashboard and alert system that checks all timeframes and currency pairs for different candlestick patterns that are formed in them. Scanner is integrated with support and resistance zones so you can check the candlestick patterns in the most important areas of the chart to find breakout and reversal patterns in the price chart. Download demo version   (works on M1,M5,M30,W1 timefr
      MACD divergence indicator finds divergences between price chart and MACD indicator and informs you with alerts (popup, mobile notification or email). Its main use is to find trend reversals in the chart. Always use the divergence indicators with other technical assets like support resistance zones, candlestick patterns and price action to have a higher possibility to find trend reversals. Three confirmation type for MACD divergences: MACD line cross zero level Price returns to previous H/L Creat
      FREE
      40% off. Original price: $50 (Ends in May 15th) Support and Resistance Dashboard for MT4 is a multi-timeframe and multi-symbol scanner and alert system that finds S/R zones and pivot points for all timeframes and symbols and alerts when price has interaction with them. If you are using support and resistance (or supply and demand) zones in your trading strategy, this dashboard and its alert and filtering system is a big time saver for you. Download demo version   (works on M 1,M5,M30,W1   timef
      Ichimoku Trend Alert is the Ichimoku Kinko Hyo indicator with Alerts and signal filters. Ichimoku Trend Alert features: Optional check of Ichimoku cloud, Tenkan sen(Conversion Line), Kijun sen(Base Line), Senkou span A, Senkou span B, and Chikou span relative to price, and more. Popup, email, and phone notification alerts for selected symbols and timeframes. There are 9 classic Ichimoku trend filters you can enable/disable in settings: Price/Cloud Order: Checks the price position relative to
      FREE
      40% off. Original price: $50 (Ends in May 15th) Moving Average Trend Scanner is a multi symbol multi timeframe triple MA crossover dashboard that helps traders to monitor, and identify potential market trends from one chart. This panel scans 3 moving averages in up to 28 configurable instruments and 9 timeframes for triple moving average alignment and moving average crossover  with a deep scan feature to scan all market watch symbols (up to 1000 instruments!). Download Demo here  (Scans only
      Moving Average Trend Alert is a triple MA indicator that helps traders to identify potential market trends based on 3 MAs alignment and crossover. Moving Average Trend Alert features: Customizable short-term, medium-term, and long-term MAs. Option to filter signals based on a minimum distance between moving averages to avoid premature MAs alignment. Optional Filter of signals with RSI indicator overbought/oversold levels. Optional Filter of signals with ADX indicator. Popup, email, and phone n
      FREE
      50% off. Original price: $60 (Ends in May 15th) MACD Divergence Scanner is a multi-timeframe and multi-symbol dashboard and alert that checks all timeframes and symbols to find regular and hidden divergences between price chart and MACD indicator. This divergence scanner is integrated with support and resistance zones so you can check the MACD divergences in the most important areas of the chart to find trend reversals in the price chart. Download demo version   (works on M 1,M5,M30,W1   timefr
      40% off. Original price: $50 (Ends in May 15th) Moving Average Trend Scanner is a multi symbol multi timeframe triple MA crossover dashboard that helps traders to monitor, and identify potential market trends from one chart. This panel scans 3 moving averages in up to 28 configurable instruments and 9 timeframes for triple moving average alignment and moving average crossover with a deep scan feature to scan all market watch symbols (up to 1000 instruments!).   Download Demo   here   (Scans o
      Reward Multiplier is a semi-automatic trade manager based on pyramid trading that opens additional orders with the running profit of your trades to maximize return exponentially without increasing the risk.Unlike other similar EAs, this tool shows potential profit/loss and reward to risk ratio before even entering the first trade! Download full version here  ( In the mini version. Starting lot is fixed at 0.01 (or minimum allowed lot size ) Guide + tips here MT4 version   here You only open the
      FREE
      50% off. Original price: $60   (Ends in May 15th) Support and Resistance zones indicator for MT5 is a multi-timeframe panel and alert that finds support and resistance zones and pivot points for all timeframes of MetaTrader 5 and gives alert when price has interaction with them. Download demo version (works on GBPUSD, EURJPY and NZDUSD symbols) Read the full description of scanner parameters in the blog page . Many unique features in one indicator: Integrating support and resistance zones and p
      50% off. Original price: $60 Triangle Finder is a multi symbol multi timeframe dashboard that monitors and finds symmetrical triangle pattern in 28 symbols and 9 timeframes with a deep scan feature to scan all market watch symbols (up to 1000 instruments!). Download Demo here  (Scans only M1 and M5) Settings description   here MT5 version   here Triangle Finder features: Realtime monitoring of 28 customizable instruments and 9 timeframes at the same time. Deep scan mode to scan all market w
      Reward Multiplier is a semi-automatic trade manager based on pyramid trading that opens additional orders with the running profit of your trades to maximize return exponentially without increasing the risk. Unlike other similar EAs, this tool shows potential profit/loss and reward to risk ratio before even entering the first trade! Download full version here  ( In the mini version. Starting lot is fixed at 0.01 (or minimum allowed lot size ) Guide + tips here MT5 version   here You only open the
      FREE
      Filtrele:
      Roman Zakurdaiev
      85
      Roman Zakurdaiev 2022.11.02 17:48 
       

      Perfect

      Marek Stachowski
      33
      Marek Stachowski 2022.10.07 15:36 
       

      I am disappointed. The program loses the settings regarding currency pairs. Saved settings do not turn them over. It's a waste of time to configure, since the program crashes and there is no way to return to the settings.

      Amir Atif
      59422
      Geliştiriciden yanıt Amir Atif 2022.10.12 16:37
      I'm really sorry about your bad experience with the saving pairs list problem.
      I will fix the issue and release a new update soon.
      Regards Edit: Fixed and updated.
      İncelemeye yanıt
      Sürüm 4.0 2023.09.26
      - Alert system upgraded: 2 new alert modes added:
      1. Multi-timeframe alert for a symbol
      2. Multi-symbol alert in a timeframe

      - Minor improvements and bug fixes.
      Sürüm 3.2 2023.06.19
      - New option " Alert Note" added to the indicator settings. You can type a text (unique name or comment to be added at the beginning of the alert messages.

      - In the indicator settings position of the "Filter mid-trend signals" option is rearranged.
      Sürüm 3.1 2023.02.28
      - A bug in the "buttons info" option fixed.
      Sürüm 3.0 2023.02.14
      - Now the scanner also loads the Ichimoku indicator on the chart with arrows, so you can check the signals on the history of a chart.
      - New option: "Filter mid-trend signals" added to the settings. With this enabled the indicator tries to not alert on mid/late trend signals.
      - Some graphical tweaks and fixes.
      - New feature: Now you can set the number of dashboard rows of symbols in the settings.
      - Showing of price/cloud signals on the dashboard (light red/light green colors) disabled.
      - Performance improved.
      Sürüm 2.1 2022.12.29
      - Performance improved.
      - Minor bug fixed.
      Sürüm 2.0 2022.11.06
      - New feature added: "Deep Scan" mode to scan all market watch symbols.

      - New Option added to the settings to enable/disable the main trend signal (Price/Kumo order).
      Sürüm 1.20 2022.10.10
      - Now saving the indicator chart as a template will save the chosen symbols in the dashboard too.

      - "Unique ID" option added to the settings. If you want to save a different set of symbols change this number. (More info on the guide blog)

      - "Dashboard Columns" option added to the settings. You can choose between 1 or 2 columns of symbols on the dashboard. (14 or 28 symbols) and you can leave a symbol blank in the dashboard.

      - An "array out of range" error fixed.
      Sürüm 1.10 2022.07.01
      - A bug in the alert system fixed