Ticks Envelopes
- Göstergeler
- Andrej Nikitin
- Sürüm: 1.12
- Güncellendi: 18 Kasım 2021
- Etkinleştirmeler: 5
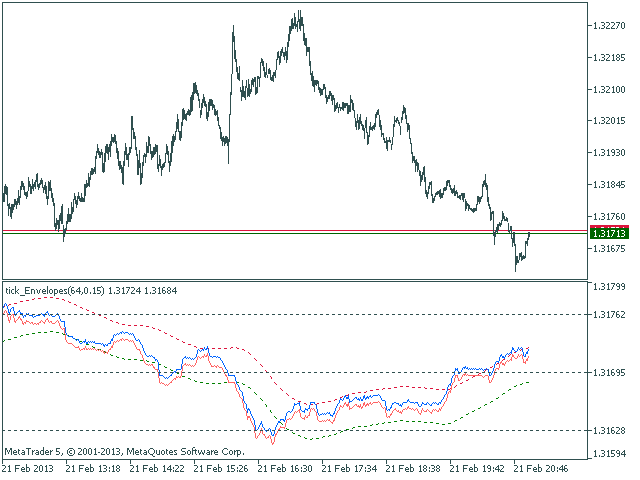
The Envelopes indicator drawn using a tick chart.
After launching it, wait for enough ticks to come.
Parameters:
- Averaging period - period of averaging.
- Smoothing type - type of smoothing. Can have any values of the enumeration ENUM_MA_METHOD.
- Option prices - price to be used. Can be Ask, Bid or (Ask+Bid)/2.
- Deviation of boundaries from the midline (in percents) - deviation from the main line in percentage terms.
- Price levels count - number of displayed price levels (no levels are displayed if set to 0).
- Bar under calculation - number of bars on the chart for the indicator calculation.
Buffer indexes: 0 - UPPER_LINE, 1 - LOWER_LINE, 2 - BID, 3 - ASK.