Gaps
- Göstergeler
- Makarii Gubaydullin
- Sürüm: 1.10
- Etkinleştirmeler: 5
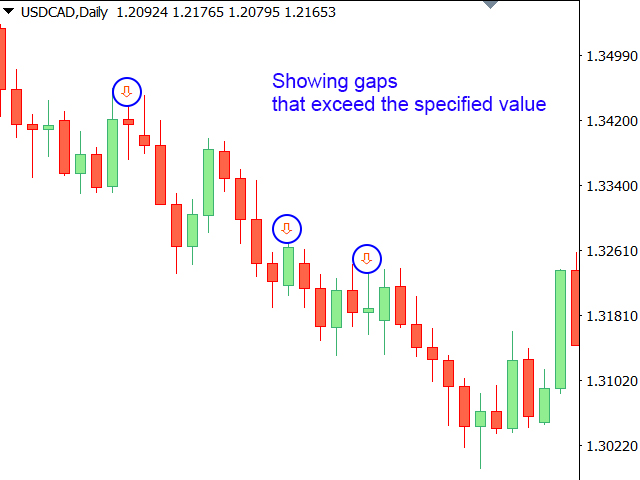
Displays the appearance of a gap on the chart (when the closing price of the previous bar differs from the opening price of the new bar).
My #1 Utility: includes 65+ functions | Contact me if you have any questions
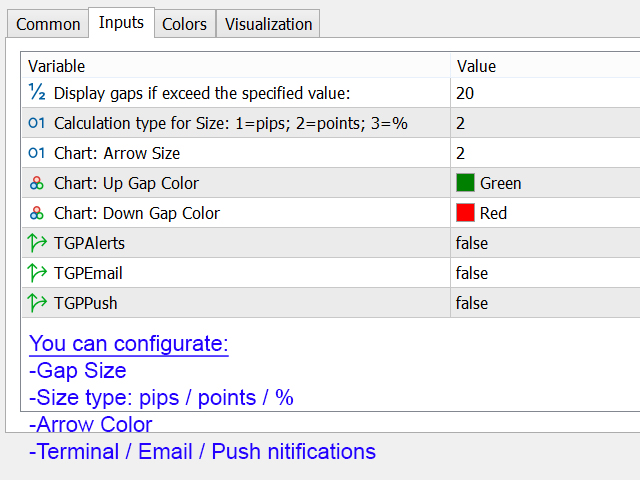
In the initial settings you can configure:
- The gap size: gap that exceed this value will be displayed.
- Size type: pips / poitns / %;
- Arrow color: separate for up and down gaps.
- Terminal / Email / Push notifications
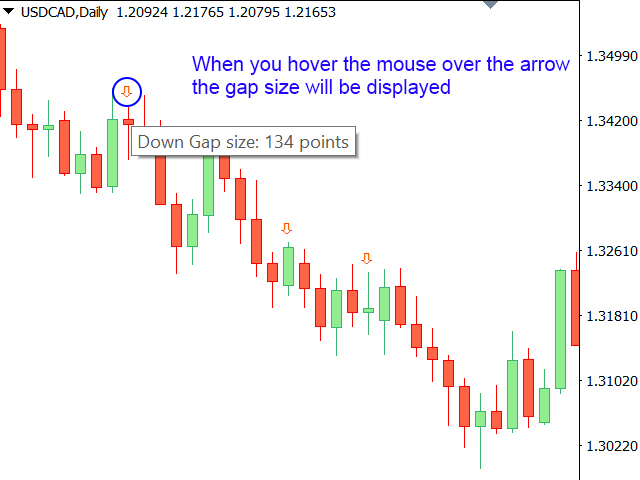
When you hover the mouse over the gap arrows on the chart, their size will be displayed;
I recommend you to choose the appropriate gap size for different time frames and currency pairs.