• Genel bakış
  • İncelemeler (1)
  • Yorumlar
  • Yenilikler

DYJ TradingView

5
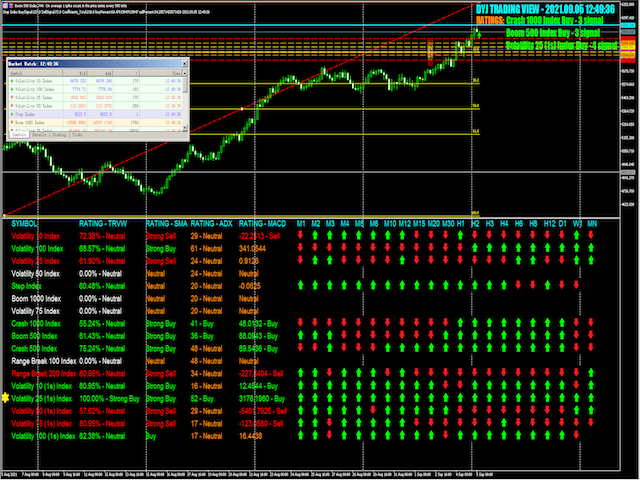
DYJ TRADINGVIEW, küresel pazarlara giriş fırsatlarını bulmak için derecelendirme sinyalleri sayımlarını ve analiz araçlarını kullanan çok göstergeli bir derecelendirme sistemidir.

DYJ TRADINGVIEW, pazar analizi için 10 yerleşik göstergeye sahiptir.

Göstergeye dayalı analiz, birçok tüccar tarafından hangi işlemlerin yapılacağı ve bunlara nereden girilip çıkılacağı konusunda karar vermelerine yardımcı olmak için kullanılır.

Birbirini iyi tamamlayabilecek birkaç farklı tür kullanıyoruz.

Pazarınızı takip etmek için bizi kullanın, daha doğru işlemler bulabilirsiniz.

Derecelendirmeye katılan trend göstergeleri DYJ POWERSIGNAL, ADX, SMA, Bollinger Bantlarını içerir.

Derecelendirmeye katılan osilatörler arasında MACD, RSI, Stokastik, Timsah yer alıyor.

Sinyal sayısı 3 veya daha fazla olduğunda alım veya satım sinyalleri için aynı yönü gösteren 3 gösterge olduğunda piyasa işlemine girmeye başlarız.

Giriş
[GENEL]
ViewName = "DYJ TİCARET GÖRÜNÜMÜ" --> Şirket Adı.
InpIsDisplayPrice = true --> Fiyatı Görüntüle.
InpPriceShiftBars = 1 --> Fiyat Kaydırma Çubukları
InpMaxTrendeds = 3 --> Sinyaller InpMaxTrendeds'den daha büyük, derecelendirme sembolü .
[TİCARET GÖRÜNÜMÜ]

InpPowerSignalMinPercent = 90 --> TradeingView Minimum Yüzdesi
InpPowerSignalStrongPercent = 100 --> TradeingView Güçlü Yüzde
InpPowerSignalMaxPercent = 100 --> TradeingView Maksimum Yüzde
InpHiddenPeriodTrend = false --> M1'i MN'ye Gizle
[MUM]

InpUseCandle = true --> Mum Kullanın.
InpEntryUpper = 33 --> Çoklu Yay, Girişleri Satın Al
InpEntryLower = 33 --> Çoklu Yayma, Girişleri Satıyor
[MA]

InpUseMA=true;
InpIsDisplayFastMA=true --> DisplayFastMA
InpIsDisplayMidMA=true --> MidMA'yı Görüntüle
InpIsDisplaySlowMA=true --> SlowMA'yı Görüntüle
InpMAFastPeriod=20 --> Hızlı Dönem
InpMAMidPeriod=50 --> Orta Dönem
InpMASlowPeriod=200 --> Yavaş Dönem
[ADX]

InpUseAdx=true --> ADX Kullan
InpIsDisplayPlusdi=yanlış; --> ADX Plusdi'yi Görüntüle
InpIsDisplayMinusdi=false --> ADX Minusdi'yi Görüntüle
InpAdxPeriod = 14 -- ADX: Ortalama alma süresi
InpTrendLevel = 30 -- ADX: Trend Düzeyi
[RSI]

InpUseRsi =true --> RSI Kullan
InpRSIPPeriyodu = 14 --> RSI Periyodu
InpRsiOversold = 30 --> R si Aşırı Satıldı
InpRsiOverbought = 70 --> Rsi Aşırı Alımı
[BOLLINGER]

InpUseBollinger = true --> Bollinger Kullan
InpIsDisplayUpper=true
InpIsDisplaylower=true
Inp_Bands_bands_period = 20 -- Bollinger bantları periyodu
Inp_Bands_deviation = 2 -- Bollinger bantları sapmaları
InpBandDistance = 50 -- Bant Mesafesi, puan olarak
[MACD]

InpUseMACD = true --> MACD Kullan
InpIsDisplayMacdSignal=false --> MacdSignal'i Görüntüle
InpMacdFast = 12 --> MacdFast
InpMacdSlow = 26 --> MacdSlow
InpMacdSignal = 9 --> MacdSignal
InpMacdPriceField = PRICE_CLOSE --> macd hesaplama yöntemi
InpMACDopenLevel = 3 --> MACD Açık Seviye
InpMACDCloseLevel = 2 --> MACD Kapatma Seviyesi
[MACD MA TREND]

InpMacdMA = 26 --> MA Dönemi
InpMacdMAMethod = MODE_EMA --> düzleştirme macdma türü
InpMacdMAPriceField = PRICE_CLOSE --> macd hesaplama yöntemi
[STOKASTİK]

InpUseStochastic = true --> Stokastik Kullan
InpSTOKdönemi = 5 --> K-dönemi
InpSTODperiod = 3 --> D-periyodu
InpSTOSlowing = 3 --> yavaşlama periyodu
InpSTOMaMethod = MODE_EMA --> stokastik yumuşatma türü
InpSTOPriceField = STO_LOWHIGH --> stokastik hesaplama yöntemi
InpOversoldArea = 20 --> stok aşırı satım bölgesi
InpOverboughtArea = 80 --> stok aşırı alım bölgesi
[TİMSAH]

Inp_jaw_period = 13 --> çenelerin hesaplanması için süre
Inp_jaw_shift = 8 --> çenelerin yatay kayması
Inp_teeth_period = 8 --> diş hesaplama periyodu
Inp_teeth_shift = 5 --> dişlerin yatay kayması
Inp_lips_period = 5 --> dudakların hesaplanması için süre
Inp_lips_shift = 3 --> dudakların yatay kayması
Inp_ma_method = MODE_EMA --> yumuşatma türü
Inp_applied_price = PRICE_MEDIAN --> fiyat türü
[EKSEN]

InpUsePivot = doğru;
InpCalculationMode = FIBONACCI_RETRACEMENT --> FIBONACCI RETRACEMENT
[FIBONACCI]

InpUseFibonacci = doğru;
InpFibDate1=1 --> 1. nokta tarihi, %
InpFibPrice1=1 --> 1. puanın fiyatı, %
InpFibDate2=100 --> 2. nokta tarihi, %
InpFibPrice2=100 --> 2. puanın fiyatı, %
[Panel]

InpLanguage = İngilizce --> İngilizce veya Çince
İncelemeler 1
Marion Lancaster Dicaprio
180
Marion Lancaster Dicaprio 2021.09.07 07:21 
 

I highly recommended Dyj global for their products and customer's services. I sincerely think they are the best in the industry they will go above an beyond to make sure you get the best trading results. I have been using this service for approximately one year.

Önerilen ürünler
Noize Absorption Index - is the manual trading system that measures the difference of pressure between bears forces and bulls forces. Green line - is a noize free index that showing curent situation. Zero value of index shows totally choppy/flat market.Values above zero level shows how powerfull bullish wave is and values below zero measures bearish forces.Up arrow appears on bearish market when it's ready to reverse, dn arrow appears on weak bullish market, as a result of reverse expectation.
199 USD
Premium seviye, %80'den fazla doğru tahmin doğruluğuna sahip benzersiz bir göstergedir! Bu gösterge en iyi Ticaret Uzmanları tarafından iki aydan uzun süredir test edilmiştir! Yazarın göstergesini başka hiçbir yerde bulamazsınız! Ekran görüntülerinden bu aracın doğruluğunu kendiniz görebilirsiniz! 1, sona erme süresi 1 mum olan ikili opsiyon ticareti için harikadır. 2 tüm döviz çiftleri, hisse senetleri, emtialar, kripto para birimleri üzerinde çalışır Talimatlar: Kırmızı ok görün
1 100 USD
Magic Finger can help you identify trends and trading opportunities clearly. The finger points to the open position signal, and the discoloration line is confirmed by the trend. If you are a day trader, you can choose to trade during a period of active trading, referring to the discoloration line as the basis for the next order, finger signal as a filter. If you are a trend trader, you can choose a period above H1, wait for the appearance of the finger signal in the key price area, and enter
188 USD
Bu indikatör, her sipariş için önceden belirlediğiniz TP ve SL Değerlerini (o para biriminde) grafiklerde (işlem/sipariş satırına kapalı) gösterecek ve her sipariş için kar ve zararınızı tahmin etmenize çok yardımcı olacaktır. Ayrıca size PIP değerlerini de gösterir. gösterilen format "Kâr veya Zararımızın Döviz Değerleri / PIP değerlerimiz" şeklindedir. TP Değeri Yeşil Renkte ve SL Değeri Kırmızı Renkte gösterilecektir. Herhangi bir sorunuz veya daha fazla bilgi için lütfen fxlife.asia@hotma
99 USD
Your Trend Friend
Luigi Nunes Labigalini
The trend is your friend! Look at the color of the indicator and trade on that direction. It does not  repaint. After each candle is closed, that's the color of the trend. You can focus on shorter faster trends or major trends, just test what's most suitable for the symbol and timeframe you trade. Simply change the "Length" parameter and the indicator will automatically adapt. You can also change the color, thickness and style of the lines. Download and give it a try! There are big movements
99 USD
How to use Pair Trading Station Pair Trading Station is recommended for H1 time frame and you can use it for any currency pairs. To generate buy and sell signal, follow few steps below to apply Pair Trading Station to your MetaTrader terminal. When you load Pair Trading Station on your chart, Pair Trading station will assess available historical data in your MetaTrader platforms for each currency pair. On your chart, the amount of historical data available will be displayed for each currency pai
280 USD
Double HMA MTF for MT5
Pavel Zamoshnikov
5 (2)
This is an advanced multi-timeframe version of the popular Hull Moving Average (HMA) Features Two lines of the Hull indicator of different timeframes on the same chart. The HMA line of the higher timeframe defines the trend, and the HMA line of the current timeframe defines the short-term price movements. A graphical panel with HMA indicator data from all timeframes at the same time . If the HMA switched its direction on any timeframe, the panel displays a question or exclamation mark with a tex
30 USD
The Universal Trend indicator was created to detect trends in price movement and allows you to quickly determine not only the direction of the trend, but also understand the levels of interaction between buyers and sellers. The indicator works on all timeframes and currency pairs. The indicator gives fairly accurate signals and it is customary to use it both in trending and flat markets. It is advisable to use the indicator in combination with other tools for more reliable signals and making a
111 USD
Easy to use buy and sell signals with arrows. Non Repainting indicator. Non Lagging indicator. Down Arrows indicate sell and up arrows indicate buys. Works on any market and on any time frames. Arrow colors can be changed to match chart colors. Audible alerts. Periods can be changed to phase out false signals. Please remember to follow the trend like with any indicator.
30 USD
Promotion $66 lifetime for you. The principle of this indicator is very simple: detecting the trend with Moving Average, then monitoring the return point of graph by using the crossing of Stochastic Oscillator and finally predicting BUY and SELL signal with arrows, alerts and notifications. The parameters are fixed and automatically calculated on each time frame. Example: If you install indicator on EURUSD, timeframe M5: the indicator will detect the main trend with the Moving Average on this
66 USD
Note : i only sell this EA on MQL5, any other sellers is fake. Orbit Rage Final, a cutting-edge trading strategy meticulously designed around the bull/bear candle approach and divergence analysis. This powerful tool is engineered to empower you to shape the life you desire. To embark on this transformative journey, simply download and seamlessly integrate it into your MetaTrader 4 platform by placing it in the experts advisors folder. Orbit Rage Final revolutionizes trading by offering a risk-f
199 USD
Upgraded - Stars added to indentify Areas you can scale in to compound on your entry  when buying or selling version 2.4 Upgraded Notifications and alerts added version 2.3 *The indicator is suitable for all pairs fromm  Deriv pairs (Vix,jump,boom & crash indices) , Currencies, cryptos , stocks(USA100, USA30 ), and metals like gold etc. How does it work? Increasing the period make it more stable hence will only focus on important entry points However  lowering the period will mean the indica
30 USD
Trend Side - trendi belirlemek için teknik bir gösterge. Birkaç tam teşekküllü ticaret stratejisi kümesidir. Gösterge, gelişmiş bir trend filtreleme sistemi kullanır, istatistiksel bir panele sahiptir, giriş ve çıkış seviyelerini hesaplar ve dinamik Takip Durdurma seviyesini hesaplar. Her tür sembol için uygundur, sinyallerini ve sonuçlarını asla yeniden çizmez. Profesyonel trend ticareti için kapsamlı bir araç. Trend Side göstergesi seti ayrıca Andrews Trend Scanner'ı içerir - çok para birimi
50 USD
This is a Lite version of my Binary Wave Advance Oscillating indicator:  https://www.mql5.com/en/market/product/90734 It reduces the less useful indicators, while keeping it's predictive modifications to make each indicator within better than their stock counter part. I reduced it and made it simpler, in the hopes it would be less overwhelming and more approachable. Contains: ADX Chaikin Money Flow Index Each have separate smoothing controls to tame faster periods, as well as the Main has it's o
30 USD
PipFinite Exit EDGE MT5
Karlo Wilson Vendiola
4.88 (34)
Did You Have A Profitable Trade But Suddenly Reversed? In a solid strategy, exiting a trade is equally important as entering. Exit EDGE helps maximize your current trade profit and avoid turning winning trades to losers. Never Miss An Exit Signal Again Monitor all pairs and timeframes in just 1 chart www.mql5.com/en/blogs/post/726558 How To Trade You can close your open trades as soon as you receive a signal Close your Buy orders if you receive an Exit Buy Signal. Close your Sell orde
88 USD
Wave Trend MT5
Diego Arribas Lopez
MT4 Version Wave Trend MT5 Wave Trend is an oscillator, which helps identifing in a extremely accurate manner market reversals. The Oscillator being obove the overbought level and a cross down of the fast into the slow MA usually indicates a good SELL signal. If the oscillators is below the oversold level and the fast MA crosses over the slower MA usually highlights a good BUY signal. The Wave Trend indicator can be also used when divergences appear against the price, indicating the current move
129 USD
Renko Gold
Ignacio Agustin Mene Franco
Renko Gold! clearly indicates the floors and ceilings where it goes from 4 lines, the line below that marks the floor in green confirming with the thinnest line clarifies the purchase entry, the same is for sale, the top line marks the ceiling and the thinnest red line marks the sale, This indicator works for all temporalities! For Forex and Synthetic Indices markets! It also works for crypto markets! Good profit! World Investor.
40 USD
For a trader, trend is our friend. This is a trend indicator for MT5, can be used on any symbol. just load it to the terminal and you will see the current trend. green color means bullish trend and red means bearlish trend. you can also change the color by yourself when the indicator is loaded to the MT5 terminal the symbol and period is get from the terminal automaticly. How to use: I use this trend indicator on 2 terminals with different period  for the same symbol at same time. for example M5
200 USD
PZ Trend Trading MT5
PZ TRADING SLU
3.67 (3)
Trend Trading is an indicator designed to profit as much as possible from trends taking place in the market, by timing pullbacks and breakouts. It finds trading opportunities by analyzing what the price is doing during established trends. [ Installation Guide | Update Guide | Troubleshooting | FAQ | All Products ] Trade financial markets with confidence and efficiency Profit from established trends without getting whipsawed Recognize profitable pullbacks, breakouts and early reversals The ind
249 USD
Automated Trendlines MT5
Georgios Kalomoiropoulos
Trend çizgileri, forex ticaretinde en önemli teknik analiz aracıdır. Ne yazık ki, çoğu tüccar onları doğru şekilde çizmez. Otomatik Trend Çizgileri göstergesi, piyasaların trend hareketini görselleştirmenize yardımcı olan ciddi tüccarlar için profesyonel bir araçtır. İki tür Trend Çizgisi, Boğa Trend Çizgisi ve Ayı Trend Çizgisi vardır. Yükseliş trendinde, Forex trend çizgisi, fiyat hareketinin en düşük salınım noktalarından geçer. En az iki "en düşük düşük"ü birleştirmek, bir trend çiz
99 USD
PipFinite Trend PRO MT5
Karlo Wilson Vendiola
4.86 (657)
Breakthrough Solution For Trend Trading And Filtering With All Important Features Built Inside One Tool! Trend PRO's smart algorithm detects the trend, filters out market noise and gives entry signals with exit levels. The new features with enhanced rules for statistical calculation improved the overall performance of this indicator. Important Information Revealed Maximize the potential of Trend Pro, please visit www.mql5.com/en/blogs/post/713938 The Powerful Expert Advisor Version Automa
98 USD
Description : Rainbow EA MT5 is a simple Expert advisor based on   Rainbow MT5 indicator witch is based on Moving average with period 34. The indicator is incorporated in the EA, therefore, it is not required for the EA to operate, but if you wish, you can download it from   my product page . The Expert Advisor settings are as follows : Suitable for Timeframes up to H1 The parameters below can be set according to your trading rules. StopLoss ( Stop Loss in pips) TakeProfit ( Take Profit in pi
59 USD
Indicator for trend trading Doesn't redraw The algorithm uses reliable and proven time indicators It is recommended to use with common manufacturer's filters as resistance support levels Or standard Bollinger Bands or ZigZag indicators It can also be combined with the RSI indicator to determine whether a currency pair or index is overbought or oversold. The indicator is designed to work on small timeframes from m1 to m15
150 USD
Implementation of the Trend Transition indicator is simple - in the form of lines of two colors. The indicator algorithm is based on standard indicators as well as its own mathematical calculations. The indicator will help users determine the direction of the trend. It will also become an indispensable advisor for entering the market or for closing a position. This indicator is recommended for everyone, both beginners and professionals. How to interpret information from the indicator. Sell
57 USD
Sayı dizilerinden birine "Orman Yangını Dizisi" denir. En güzel yeni dizilerden biri olarak kabul edildi. Başlıca özelliği, bu dizinin lineer trendlerden, hatta en kısa olanlardan kaçınmasıdır. Bu göstergenin temelini oluşturan bu özelliktir. Bir finansal zaman serisini analiz ederken, bu gösterge tüm olası trend seçeneklerini reddetmeye çalışır. Ve ancak başarısız olursa, bir trendin varlığını tanır ve uygun sinyali verir. Bu yaklaşım, yeni trendlerin başladığı anların doğru bir şekilde belirl
30 USD
Alpha Trend MT5
Evgeny Belyaev
5 (1)
Alpha Trend MT5 is a trend indicator for the MetaTrader 5 platform; it has been developed by a group of professional traders. The Alpha Trend MT5 indicator finds the most probable tendency reversal points, which allows making trades at the very beginning of a trend. This indicator features notifications, which are generated whenever a new signal appears (alert, email, push-notification). This allows you to open a position in a timely manner. Alpha Trend does not redraw, which makes it possible t
35.90 USD
VR Cub MT 5
Vladimir Pastushak
VR Cub , yüksek kaliteli giriş noktaları elde etmenin bir göstergesidir. Gösterge, matematiksel hesaplamaları kolaylaştırmak ve bir pozisyona giriş noktalarının aranmasını basitleştirmek için geliştirildi. Göstergenin yazıldığı ticaret stratejisi uzun yıllardan beri etkinliğini kanıtlamaktadır. Ticaret stratejisinin basitliği, acemi yatırımcıların bile başarılı bir şekilde ticaret yapmasına olanak tanıyan büyük avantajıdır. VR Cub, pozisyon açılış noktalarını ve Kâr Al ve Zararı Durdur hedef sev
49 USD
Volality Index scalper indicator  Meant for Volality pairs such as Volality 10, 25, 50, 75 and 100 The indicator works on all timeframes from the 1 minute to the monthly timeframe the indicator is non repaint the indicator has 3 entry settings 1 color change on zero cross 2 color change on slope change 3 color change on signal line cross Orange line is your sell signal Blue line is your buy signal.
35 USD
SBA scalping v75
Umri Azkia Zulkarnaen
ini adalah indikator khusus digunakan untuk trading di binary.com dengan pair volatility 75. indikator ini sangat simpel dan mudah digunakan baik untuk yang sudah profesional atau pun yang baru dalam dunia trading terutama yang baru di market volatility 75.indikator ini lebih bertujuan untuk scalping trader dan menggunakan timeframe M1 sebagai acuan untuk entry. adapun jika ingin mempelajari lebih lanjut bisa menghubungi di telegram  https://t.me/shadowbreakerfx . untuk SOP lengkap silahkan klik
110 USD
The Riko Trend indicator is a revolutionary trend trading and filtering solution with all the important features of a trend tool built into one tool! The Riko Trend indicator is good for any trader, suitable for any trader for both forex and binary options. You don’t need to configure anything, everything is perfected by time and experience, it works great during a flat and in a trend. The Riko Trend indicator is a technical analysis tool for financial markets that reflects the current price
109 USD
Bu ürünün alıcıları ayrıca şunları satın alıyor
IVISTscalp5
Vadym Zhukovskyi
5 (1)
We present you the iVISTscalp5 indicator, which is not only unique, but also effective in the analysis of trading operations. This indicator is based on time data and is the result of many years of experience and deep analysis of financial markets. The iVISTscalp5 indicator is an excellent assistant for manual trading. Convenience, simplicity and visualization. All the most difficult is hidden inside. We have simplified the settings and use of the iVISTscalp5 indicator as much as possible. The i
500 USD
Advanced Supply Demand MT5
Bernhard Schweigert
4.36 (11)
Herhangi bir Acemi veya Uzman Tüccar için En İyi Çözüm! Bu gösterge benzersiz, yüksek kaliteli ve uygun fiyatlı bir ticaret aracıdır çünkü bir dizi tescilli özelliği ve yeni bir formülü bir araya getirdik. Bu güncelleme ile çift zaman dilimi dilimlerini gösterebileceksiniz. Yalnızca daha yüksek bir TF gösteremeyeceksiniz, aynı zamanda TF grafiğini ve ARTIK daha yüksek TF'yi de gösterebileceksiniz: YUVARLAK BÖLGELERİ GÖSTERMEK. Tüm Arz Talebi tüccarları buna bayılacak. :) Önemli Bilgiler Açıkland
199 USD
This is arguably the most complete harmonic price formation auto-recognition indicator you can find for the MetaTrader Platform. It detects 19 different patterns, takes fibonacci projections as seriously as you do, displays the Potential Reversal Zone (PRZ) and finds suitable stop-loss and take-profit levels. [ Installation Guide | Update Guide | Troubleshooting | FAQ | All Products ] It detects 19 different harmonic price formations It plots primary, derived and complementary Fibonacci p
299 USD
XQ Indicator MT5
Marzena Maria Szmit
3.25 (4)
The signal conditions are a combination of three indicators, and XQ Forex Indicators only display  medium and long-term trends . The indicator's efficacy has been improved with the addition of a filter that blocks out false signals. The XQ Forex Indicator can be used on  FX pairs, CFDs, and Cryptocurrencies . There are two type of signals:  Buy or Sell and Big Long or Big Short It is possible to enable sending emails when a major trend-change signal is detected, as well as to display the alerts
179 USD
TPA True Price Action indicator reveals the true price action of the market makers through 100% non-repainting signals strictly at the close of a candle! TPA shows entries and re-entries, every time the bulls are definitely stronger than the bears and vice versa. Not to confuse with red/green candles. The shift of power gets confirmed at the earliest stage and is ONE exit strategy of several. There are available now two free parts of the TPA User Guide for our customers. The first "The Basics"
168 USD
RubdFx Perfect Reversal , The reversal indicator is used to determine areas of support and resistance by Drawing an arrow with a level of supply and demand ( ReversalZones ). - You will catch more swings by reducing the period, and less swings if you increase period - Mobile, computer and email alerts available . it is not pushed by price which means the arrow will stay in one place,suitable for scalping and long term trading  Also Compatible with all forex paris , BUY RULES;  open a buy positio
159 USD
The Volume by Price Indicator for MetaTrader 5 features Volume Profile and Market Profile TPO (Time Price Opportunity). Get valuable insights out of currencies, equities and commodities data. Gain an edge trading financial markets. Volume and TPO histogram bar, line and metric charts. TPO letter and block marker charts including split structures. Positioning and styling options to suit the user's needs and context. Volume Profile and Market Profile TPO Point of Control (VPOC and TPOC), Imbalanc
259 USD
Introduction to Fractal Pattern Scanner Fractal Indicator refers to the technical indicator that makes use of the fractal geometry found in the financial market. Fractal Pattern Scanner is the advanced Fractal Indicator that brings the latest trading technology after the extensive research and development work in the fractal geometry in the financial market. The most important feature in Fractal Pattern Scanner is the ability to measure the turning point probability as well as the trend probabil
185 USD
This indicator is a perfect wave automatic analysis indicator for practical trading! 黄金实战 案例... The standardized definition of the band is no longer a wave of different people, and the art of man-made interference is eliminated, which plays a key role in strict analysis of the approach.=》Increase the choice of international style mode, (red fall green rise style) The  purchase discount is currently in progress! Index content: 1.Basic wave: First, we found the inflection point of the ba
188 USD
Tricky to find and scarce in frequency, divergences are one of the most reliable trading scenarios. This indicator finds and scans for regular and hidden divergences automatically using your favourite oscillator. [ Installation Guide | Update Guide | Troubleshooting | FAQ | All Products ] Easy to trade Finds regular and hidden divergences Supports many well known oscillators Implements trading signals based on breakouts Displays suitable stop-loss and take-profit levels Configurable oscilla
249 USD
Introduction to X3 Chart Pattern Scanner X3 Cherart Pattern Scanner is the non-repainting and non-lagging indicator detecting X3 chart patterns including Harmonic pattern, Elliott Wave pattern, X3 patterns, and Japanese Candlestick patterns. Historical patterns match with signal patterns. Hence, you can readily develop the solid trading strategy in your chart. More importantly, this superb pattern scanner can detect the optimal pattern of its kind. In addition, you can switch on and off individu
250 USD
Bill Williams Advanced
Siarhei Vashchylka
5 (1)
Bill Williams Advanced is designed to analyze the chart according to Bill Williams' Profitunity system. The indicator analyzes the signals of the AO, AC indicators and places them in the panel in the upper left corner of the chart. In addition, using hot keys, the indicator instantly displays / hides the AO and AC indicators (for more details, see the video instructions). Description Each line of the indicator table represents the signals of the Profitunity system that are valid on the last fi
199 USD
VTrende Pro
Andrii Diachenko
VTrende Pro - MTF indicator for trend trading with a display panel for MT5 *** Videos can be translated into any language using subtitles (video language - Russian) Although the signals of the VTrende Pro indicator can be used as signals of a full-fledged trading system, it is recommended to use them in conjunction with the Bill Williams TS. VTrende Pro is an extended version of the VTrende indicator. Difference between Pro version and VTrende: - Time zones - Signal V - signal 1-2 waves
697 USD
Devrim niteliğindeki MT5 Gösterge "Traffic Signal"i sunuyoruz - başarılı işlemlerin dünyasına açılan kapınız! Hassas bir şekilde geliştirilen ve deneyime dayalı olarak tasarlanan Traffic Signal, RSI, Stokastik, CCI ve tüm zaman dilimlerindeki eğilimlerin analizine dayalı özel bir strateji ile en doğru giriş sinyallerini üretir. Bu yenilikçi göstergeyle olağanüstü bir işlem deneyimi için hazır olun, çünkü eşsiz bir hassasiyet sunar ve piyasalarda sarsılmaz bir özgüvenle gezinmenizi sağlar. Traffi
450 USD
Weis Wave with Alert MT5
Trade The Volume Waves Single Member P.C.
4.93 (14)
Get 30% Discount until 30/9/20203 on Lifetime package 420$ from 599$. Rental/Lifetime Package Options and Privileges  * For optimum results the yearly or lifetime package is suggested due to live training and Discord  channel trading with the  creator! Rent Monthly Six Months   Yearly/Lifetime Weis Wave with Speed with Alert+Speed Index x x x Manual  x x x Quick Set up Video x x x Blog x x x Lifetime Updates x x x Setup and Training Material x x Free Rectangle Break Alert Tool      x Discord
420 USD
Introduction Excessive Momentum Indicator is the momentum indicator to measure the excessive momentum directly from raw price series. Hence, this is an extended price action and pattern trading. Excessive Momentum Indicator was originally developed by Young Ho Seo. This indicator demonstrates the concept of Equilibrium Fractal Wave and Practical Application at the same time. Excessive Momentum detects the market anomaly. Excessive momentum will give us a lot of clue about potential reversal and
200 USD
Elliott Wave Trend was designed for the scientific wave counting. This tool focuses to get rid of the vagueness of the classic Elliott Wave Counting using the guideline from the template and pattern approach. In doing so, firstly Elliott Wave Trend offers the template for your wave counting. Secondly, it offers Wave Structural Score to assist to identify accurate wave formation. It offers both impulse wave Structural Score and corrective wave Structure Score. Structural Score is the rating to sh
200 USD
"Piranha" - an autonomous trading system that determines overbought and oversold levels on the chart. Red and blue zones represent overbought and oversold levels respectively. Entry points are marked with arrows: a downward arrow in the red zone for "sell" and an upward arrow in the blue zone for "buy". The Take profit level is indicated by the green moving average. Key features: Adjusting the Take profit level as the green moving average changes position. Averaging ability when a new market e
300 USD
Swing Trading is the first indicator designed to detect swings in the direction of the trend and possible reversal swings. It uses the baseline swing trading approach, widely described in trading literature. The indicator studies several price and time vectors to track the aggregate trend direction and detects situations in which the market is oversold or overbought and ready to correct. [ Installation Guide | Update Guide | Troubleshooting | FAQ | All Products ] Profit for market swings with
249 USD
Description Very precise patterns to detect: entry signals as well as breakout, support and resistance reversal patterns. It points out zones in which, with a high probability, institutional orders with the potential to change the price’s direction and keep moving towards it, have been placed. Support:   We create great tools for the entire trading community. Most of them are free. If you believe in what we do  Support Us Here.   KEY LINKS:   Indicator Manual  -  All Products  How is this ind
280 USD
LT Regresyon Kanalı, Fibonacci analizinin, Envelope analizinin ve Fourier ekstrapolasyonunun prensiplerini içeren sofistike bir teknik gösterge olarak kullanılır. Envelope göstergesi, piyasa volatilitesini değerlendirmede önemlidir, Fibonacci analizinin uygulanması ise aşırı alım ve aşırı satım seviyelerinin daha hassas bir şekilde belirlenmesine katkı sağlar. Ayrıca, Fourier ekstrapolasyon bileşeni, gelecekteki piyasa hareketlerini tahmin etmede önemli bir rol oynar ve aynı zamanda önceden b
200 USD
PZ Day Trading MT5
PZ TRADING SLU
2.6 (5)
This indicator detects price reversals in a zig-zag fashion, using only price action analysis and a donchian channel. It has been specifically designed for short-term trading, without repainting or backpainting at all. It is a fantastic tool for shrewd traders aiming to increase the timing of their operations. [ Installation Guide | Update Guide | Troubleshooting | FAQ | All Products ] Amazingly easy to trade It provides value on every timeframe It displays suitable SL and TP levels It impl
249 USD
The indicator is recommended to be used on D1. This version, unlike the version for MT4, does not have an additional filter. Peculiarities Suitable for all tools Many strategies; Important levels, recommendations; Flexibility in settings for different instruments and intervals. Signals B,S - predict the direction of movement of the candle at the beginning or at the close of the candle. Recommended TF from H4 and above. BuyStopLvl, SellStopLvl - levels that can be used to set Limit, Stop order
200 USD
Matreshka
Dimitr Trifonov
5 (1)
Matreshka self-testing and self-optimizing indicator: 1. Is an interpretation of the Elliott Wave Analysis Theory. 2. Based on the principle of the indicator type ZigZag, and the waves are based on the principle of interpretation of the theory of DeMark. 3. Filters waves in length and height. 4. Draws up to six levels of ZigZag at the same time, tracking waves of different orders. 5. Marks Pulsed and Recoil Waves. 6. Draws arrows to open positions 7. Draws three channels. 8. Notes support and re
245 USD
INTRODUCING WORLD'S FIRST MT5 "AUTO SCALE" Naveen Geometric Square with Circle To Analyze Markets Geometric Relationship. Naveen's Geometric Square  has some of the most impressive features you will ever find in Gann & Geometric Analysis world. The Naveen's Geometric Square  is a Powerful method of squaring TIME AND PRICE .It is a free-hand drawing tool giving you control of the size of the box. The internal diagonals, grid-lines and angles can be Enabled/ Disabled. All square diagonals lik
1 299 USD
Traders know that paying attention to volume can make the crucial difference in understanding how the market will move. Information such as the traded volume, frequency of executed trades and the correlation of buyers and sellers at a certain time period expand our understanding of volume and can significantly improve the accuracy of our trading forecast. The Volume at Price (or VAP) indicator displays the cumulative traded volume for each price level during a time period, as well as the corr
180 USD
Introduction to Chart Pattern MT Chart Pattern MT is a chart pattern scanner to detect the triangle pattern, falling wedge pattern, rising wedge pattern, channel pattern and so on. Chart Pattern MT uses highly sophisticated chart pattern detection algorithm. However, we have designed it in the easy to use with intuitive user interface. Chart Pattern MT will show all the patterns in your chart in the most efficient format for your trading. You do not have to do tedious manual pattern detection an
180 USD
Robos
Namu Makwembo
5 (2)
Big promotion on the Robos, Get yours now Robos Indicator The   ROBOS   indicator is a multi timeframe oscillator that targets the   overbought   and   oversold  regions of a price chart, a signal is indicated by the two lines crossing, compatible with all tradable instruments Latest Release The latest release is the version 4.0 #What's new in version 4.0 ? Features Extreme oversold and overbought levels ROBOS version  4.0  comes with cool new feature , the ability to target on
255 USD
WAPV Full MT5
Eduardo Da Costa Custodio Santos
## WAPV Full kullanarak profesyonelce çalışın ve takip edin büyük oyuncuların parası nerede Elinizde okumayı tek başına yapan bir araç olduğunu hayal edin. en iyi ticaret bölgelerini gösteren başlıca Piyasa Oyuncuları Fiyat ve Hacim analizine dayalı. WAPV Full, eksiksiz bir araçtır ve %100 R. Wyckoff'un operasyonel özelliklerine odaklanmıştır. Ticaret dalgalarındaki piyasa hareketlerini haritalamaya ek olarak, aynı zamanda Fiyat ve Hacmi okuyarak Pazar. Profesyonel Pazar, R. Wyckoff'un 3 yasası
199 USD
Offer 249 down from 350 for the next 1 copies. then back to 350 $ Are you tired of using outdated indicators that leave you guessing where to set your profit targets? Look no further than the AK CAP Opening Range Breakout Indicator. This powerful tool is backed by a US patent and has already helped countless traders pass funded challenges like FTMO. We use it daily on our prop traders and internal funds, and now it's available to you as well. The calculation behind the indicator is incredibly
249 USD
Yazarın diğer ürünleri
DYJ İptal Planı, eğilim dönüşüm noktalarında açılış yapan bir ticaret sistemidir Herhangi bir broker için geçerli olan herhangi bir sembol: Dış valuta ya da herhangi bir tür (örneğin, menajerin dalgalanma indeksi) İşe yarar mı Temel TP, SL, kafes aralığı, TPSL kârlarını ve en düşük ticari depolama depolamasını gösterir ve her tür için otomatik kâr hedef izleme özelliği ve genel kâr hedef izleme özel Ayrıca yapay ticaret asistanı özelliğine sahiptir, bağımsız işlem yapabilir veya EA ile ka
12 500 USD
PowerSignal is a complete trading system based on the ATR technical indicator. This indicator will record the current status of each POWERTREND in every time frame and currency pair analyzed. The PowerSignal creates a trend strength and entry point signal list display by evaluating these data. If there is a full coincidence on any pair an alert will pop up indicating such case. List data includes Symbol, M5-MN1, BuyPercent, SellPercent, LastEntry. The LastEntry shows entry points (periods, price
150 USD
Our goal is to provide accessible and quality service, enable market participants, traders and analysts alike, with much-needed tools for informed, timely trading decisions. The most optimized, highly robust and easy to use DYJ Trend analyst indicator. DYJ Trend analyst attempts to gauge bullish and bearish forces in the market by using two separate measures, one for each type of directional pressure. The  indicator's BearsIndex  attempts to measure the market's appetite for lower prices. The in
125 USD
This DYJ OonClickClose help you to close all orders having profit immediately with only ONE CLICK, its work is very fast. You can choose which symbol you want or close all symbols so it will helpful for you in your trading to manage trading faster. This EA can quick close all Buy and Sell Orders by a selected symbol or total, And delete all pending orders. It includes dynamic target profit tracking function. The software has manual transaction buttons buy and sell. It is a management softw
30 USD
This StrongCurrency is a complete trading system based on a variety of technical indicators, moving averages and pivots. Each of those elements can be assessed in defined rules and coefficients (depending on the indicator) providing limitless optimization scenarios for the StrongCurrency. In order to work the StrongCurrency creates a trend strength and entry point signal list display by evaluating these data, that takes data from all symbols. It extrapolates all the information in order to get t
150 USD
This QuickClose help you to close all orders having profit immediately with only ONE CLICK, its work is very fast. You can choose which symbol you want or close all symbols so it will helpful for you in your trading to manage trading faster. This EA can quick close all Buy and Sell Orders by a selected symbol or total. This SymbolButton is designed for closing orders. There is available Manual and Automatic closing functions. Automatic closing function will close the orders according the paramet
30 USD
Professional traders know that a reversal in market price is the best entry points to trade. The trend changes K line state changes the most obvious. The SoarSignal is good to identify these changes, because we have incorporated the KDJ indicators. It is the closest to the K line state of the indicators. The two lines of KDJ Winner move within a range of 0 and 100. Values above 80 are considered to be in overbought territory and indicate that a reversal in price is possible. Values below 20 are
30 USD
This StrongCurrency is a complete trading system based on a variety of technical indicators, moving averages and pivots. Each of those elements can be assessed in defined rules and coefficients (depending on the indicator) providing limitless optimization scenarios for the StrongCurrency. In order to work the StrongCurrency creates a trend strength and entry point signal list display by evaluating these data, that takes data from all symbols. It extrapolates all the information in order to get t
75 USD
PowerSignal
Daying Cao
5 (1)
Bu PowerSignal, teknik göstergelerin ATR'sine dayanan eksiksiz bir ticaret sistemidir. Bu göstergeler, her bir GÜÇTREND'in mevcut durumunu, analiz edilen her zaman diliminde ve döviz çiftinde kaydeder. PowerSignal, bu verileri değerlendirerek bir trend gücü ve giriş noktası sinyal listesi görüntüsü oluşturur. Herhangi bir çiftte tam bir çakışma varsa, bu durumu belirten bir uyarı açılır. Liste verileri Symbol, M5-MN1, BuyPercent, SellPercent, LastEntry'yi içerir. LastEntry, giriş noktalarını (d
150 USD
This indicator shows the crossing between two moving averages, a slower and faster moving average. Signal show alert pop-up, when MA1 crosses above the MA2. Signal show alert pop-up, when MA1 crosses below the MA2. Inputs Value Fast MA Setup Period = 5 - period of Faster Moving Average (value 5). Mode = SMA - type of Moving Average (SMA, EMA, SMMA, LWMA). Price = Close - type of price (Close, Open, Low, High, Median, Typical, Weighted). Slow MA Setup Period = 10 - period of Slower MA (value 10
30 USD
This EA is based on the classical trend-following system of opening the positions. The EA is based on DYJ TwoMACrossAlarm and ATR and CCI indicator. It uses two moving averages. The EA uses dynamic allocation MA period. The MA1 and MA2 period is the Fibonacci sequence, such as 5.8 or 13.21 or 21.34 or...; EA Entry Rules: Go long when fast MA1 crosses above the slow MA2 and CCI crosses above the zero line; Go short when fast MA1 crosses below the slow MA2 and CCI crosses below the zero line; the
75 USD
DYJ Haber Dışı Aktarım Fabrikası, takvim işlemleri araçları ve makroekonomik olaylar için temel pazar analizi göstergesidir Burada dünyanın en büyük ekonomisinin finansal haberlerini ve göstergelerini bulabilirsiniz: ABD ve Avrupa Birliği'nden Avustralya ve Japonya'ya kadar halka açık kaynaklardan gerçek zamanlı olarak 800'den fazla makroekonomik gösterge ve olay toplamak Her işaretçinin geçmişi, geçerli ve tahmini değerleri ve önemli özellikleri vardır Buna ek olarak, bu hizmet büyük miktard
75 USD
This indicator shows the crossing between three moving averages (slower, middle and faster ones). When fast MA crosses up middle MA and middle MA crosses up slow MA, the bullish alert is issued. When fast MA crosses down middle MA and middle MA crosses down slow MA, the bearish alert is issued. Signals to close buy positions are generated if fast MA crosses middle MA downwards, signals to close sell positions are generated if fast MA crosses middle MA upwards. Inputs Fast MA Setup MAPeriod1 =
30 USD
The Expert Advisor is based on three Moving Average indicators. ThreeMACross is based on the following idea: crossing of three Moving Average lines (Fast, Middle and slow ones) is used as a signal for opening and closing a position together. Go Long when Fast MA (MA1) crosses above Middle MA (MA2), and Middle MA (MA2) crosses above Slow MA (MA3). Go Short when Fast MA (MA1) crosses below Middle MA (MA2), and Middle MA (MA2) crosses below Slow MA (MA3). Signals to close buy positions are generate
75 USD
The RiseTrading is a unique High quality and easy to use and affordable trading tool because we have incorporated a number of proprietary features and PowerSignal and MACD and Stochastic indicators. The main advantages of the trend trading strategy used by the Expert Advisor are opening positions only in the direction of a trend, ability for the long-term retention of profitable positions allowing users to achieve good combinations of profit/loss distributions. That can work on a real account at
75 USD
DYJ hisse senedi denetleyicisi tam bir para birimi sistemidir M1 ile MN arasındaki her para birimi çiftinin rastgele değerlerini gösterir Bir döngü için Stoch değeri aşırı satış bölgelerine ve aşırı satış bölgelerine ulaştığında renk ipuçlar Bu bilgiye dayanarak doğru ticareti yapabilirsiniz Lütfen DYJ envanter denetleyicisi adında bir envanter göstergesi şablonu oluşturun ve böcekleri kaydedin Satın almak veya satın almak için fareyi tıklattığınızda, karşıl30 INPUT InpPairs                 
30 USD
The DYJ SoarTrading is based on SoarSignal indicator. It can be used for any currency pair and timeframe. Signals to buy are generated when SoarSignal has crossed oversold downwards, reached oversold and then crossed back up through oversold. Signals to sell are generated when SoarSignal has crossed overbought upwards, reached overbought, and then crossed back down through overbought. Close a trade when SoarSignal reaches the opposite side ( overbought for long order, oversold for short order).
75 USD
DYJ Sharp advanced algorithm that detects new trends and current trend continuations for use as an entry and exit strategy. The strategy display the SHARP trend demarcation area. This SHARP area has high HighLine and low LowLine. Falling of high below HighLine of SHARP and then falling of close below LowLine of SHARP can be interpreted as a signal to sell. Rising of close above HighLine of SHARP and then rising of low above LowLine of SHARP can be interpreted as a signal to buy. The signal for e
150 USD
DYJ TRENDWAVE features an advanced algorithm that detects new trends and current trend continuations for use as an entry strategy. DYJ TRENDWAVE's volatility is based on the power of buyers and sellers, it grabs total body size of candles and identifies the battle between buyers and sellers as a percentage of the total volume, like Sellers: (-)100% and Buyers: (+)100%. This information can be used for any entry and exit strategy. For bullish/Long Pin bar it is below the price line, for bearish/S
75 USD
DYJTRENDWAVE features an advanced algorithm that detects new trends and current trend continuations for use as an entry strategy. DYJTRENDWAVE's volatility is based on the power of buyers and sellers, it grabs total body size of candles and identifies the battle between buyers and sellers as a percentage of the total volume, like Sellers: (-)100% and Buyers: (+)100%. This information can be used for any entry and exit strategy. For bullish/Long Pin bar it is below the price line, for bearish/Sho
150 USD
DYJ Scalping tamamen otomatik bir Uzman Advisor. Stochastic indikator filtrü giriş için kullanılır. Tavsiye bir hedging ve ECN hesap tipine ihtiyacı var. Emir kaybı oyun tarafından kaçırıldı ve bir zarar oluyor. Eğer emir yöntemi yanlış olursa. You can disable the game strategy at any time. General Recommendations ECN hesaplarını tavsiye et, xauusd 8 ile 11 arasında yayılır, EURUSD 1 yayılır. En az depozit 200 dolar. Please download the xauusd and EURUSD settings file in the product comments ar
125 USD
DYJ Uzun zamanlı Strateji EA uzun zamanlı bir ticaret sistemidir. Mumlardaki en düşük fiyatı uzun bir trende ararak başlarız ve kısa bir trende en yüksek fiyatı ararak başlarız. En uzun zamandır pozisyonu tutacağız ve maksimum fiyatı alacağız. Emir yanlış yönde olduğunda, strateji kaybı kazara dönüştürebilir. EA yalnızca tek bir para birimi üzerinde grafiğin herhangi bir döngüsünü çalıştırır Signal URL INPUT InpMagicNumber = 8257 InpIsDisplayInterface = true InpEAComment = LTS InpRStrategyTi
30 USD
The DYJBands opens and closes positions using Bollinger Bands signals: It performs trades after a price rebound from the borderlines of the indicator. It has the option to close positions by an opposite signal, by take profit and stop loss, move a trade to breakeven upon reaching the central Bollinger band or after a certain price movement. By default, the EA is configured for trading the GBPUSD currency pair on the H1 timeframe. Also, settings for the EURUSD, USDJPY, USDCAD and XAUUSD currency
125 USD
The DYJ MacdSto is a unique High quality and easy to use and affordable trading tool because we have incorporated a number of proprietary features and MACD and Stochastic and RSI and ADX indicators. The main advantages of the trend trading strategy used by the Expert Advisor are opening positions only in the direction of a trend, ability for the long-term retention of profitable positions allowing users to achieve good combinations of profit/loss distributions. DYJ MacdSto EA uses MACD and Stoch
75 USD
This StrongCurrency is a complete trading system based on a variety of technical indicators, moving averages and pivots. Each of those elements can be assessed in defined rules and coefficients (depending on the indicator) providing limitless optimization scenarios for the StrongCurrency. In order to work the StrongCurrency creates a trend strength and entry point signal list display by evaluating these data, that takes data from all symbols. It extrapolates all the information in order to get t
125 USD
The DYJ TrendPending EA tracks the new change of price of the currency pair and opens trades in case of a price low and high from the main movement in the direction of the trend. So EA uses the least risky grid and Add lots. And can attach a positive and reverse pending order. The PositivePending orders can reduce the number of grids and Add lots,  while ReversePending orders reduce the loss of orders . For more convenient search, the working timeframe has been added to inputs (Work timeframe).
150 USD
This is a multi-currency and multi-strategy EA. This EA is to create one or more polling trading strategies in a transaction. In the polling mode, the strategies filter a trend-free range market environment and trades are placed in the opposite direction at the edges of the range. With an additional main trend filter in the trend-following mode, the DYJ's ArtOfForexWar can also trade pull-backs during trends in the trend of loss. The winning rate is more than 95% within three orders or three cl
150 USD
DYJ ScalpingBurg EA tamamen otomatik bir Uzman Tavsiyeti. Burg algoritmi filtrü giriş için kullanılır. Tavsiye bir hedging ve ECN hesap tipine ihtiyacı var. The order loss is bailed out by the game and becomes a profit.  Eğer emir yöntemi yanlış olursa. Oyun stratejisini her zaman kapatabilirsiniz. General Recommendations ECN hesaplarını tavsiye et, xauusd 8 ile 11 arasında yayılır, EURUSD 1 yayılır. En az depozit 200 dolar. Lütfen xauusd ve EURUSD ayarlar dosyasını ürün yorum alanında indirin
150 USD
DYJ ArtOfMakingMoney attempts to gauge bullish and bearish forces in the market by using two separate measures, one for each type of directional pressure. The  EA's BearsIndex  attempts to measure the market's appetite for lower prices The EA's BullsIndex attempts to measure the market's appetite for higher prices Features Monitors all pairs at the same time. The EA monitors the top 35 pairs by default, but you can select less pairs if you wish. It is a multi-currency EA that can be run from a
125 USD
Amacımız erişilebilir ve kaliteli hizmet sunmak, piyasa katılımcılarına, tüccarlara ve analistlere bilgili, zamanında alım satım kararları için çok ihtiyaç duyulan araçlarla olanak sağlamaktır. En optimize edilmiş, son derece sağlam ve kullanımı kolay DYJ Trend analist göstergesi. DYJ Trend analisti, her bir yönlü basınç için bir tane olmak üzere iki ayrı ölçü kullanarak piyasadaki yükseliş ve düşüş kuvvetlerini ölçmeye çalışır. Göstergenin BearsIndex'i, piyasanın daha düşük fiyatlara yön
125 USD
Filtre:
Marion Lancaster Dicaprio
180
Marion Lancaster Dicaprio 2021.09.07 07:21 
 

I highly recommended Dyj global for their products and customer's services. I sincerely think they are the best in the industry they will go above an beyond to make sure you get the best trading results. I have been using this service for approximately one year.

İncelemeye yanıt
Sürüm 2.6 2021.09.18
Version 2.06 2021.09.18
Modify the bug without updating the number of signals in frame
Sürüm 2.5 2021.09.16
Version 2.05 2021.09.16
Modify the bug without updating the number of activity signals immediately
Sürüm 2.4 2021.09.16
Version 2.04 2021.09.16
Added: Add the text of a tooltip in signal frame.
Added: Activity signal of indicator from MinTimeframe to MaxTimeframe in rating signal lists
Sürüm 2.3 2021.09.15
Version 2.03 2021.09.14

Modify vertical distance for title in chart signal
Sürüm 2.2 2021.09.15
Version 2.02 2021.09.14

Added:mode of price chart indent from the right border when we receive the signal
Sürüm 2.1 2021.09.13
Version 2.01 2021.09.13

Added:Automatically activate the opened chart window when there is a new signal
Sürüm 2.0 2021.09.13
Version 2.0 2021.09.13

Added:We automatically add a signal indicator in the new chart
Added:Email and mobile push notifications
Sürüm 1.9 2021.09.08
Version 1.09 2021.09.08

Added:Default background color is black for Frame windows

Sürüm 1.8 2021.09.08
Version 1.08 2021.09.08

Added:When the search for the highest candle and lowest candle position coincide, an alarm will pop up

Added:Display the signal quantity rating of all time frames. You can click currency pairs with signal greater than 3 and time frame transactions
Sürüm 1.6 2021.09.06
Version 1.06 2021.08.26
Added:Find the highest and lowest candles, and can choose to display Close price or High and Low price
Sürüm 1.5 2021.09.05
Version 1.05 2021.08.26
Added:Horizontal solid line at the previous days highest wick and close of the candle this for both uptrend and downtrend daily candles only
Sürüm 1.4 2021.08.26
Version 1.04 2021.08.26
Optimize code
Sürüm 1.3 2021.08.25
Version 1.03 2021.08.25
Optimize code
Sürüm 1.2 2021.08.25
Version 1.02 2021.08.25
Optimize code
Sürüm 1.1 2021.08.24
Version 1.01 2021.08.24
Optimize code