• Übersicht
  • Bewertungen (1)
  • Diskussion
  • Neue Funktionen

DYJ TradingView

5
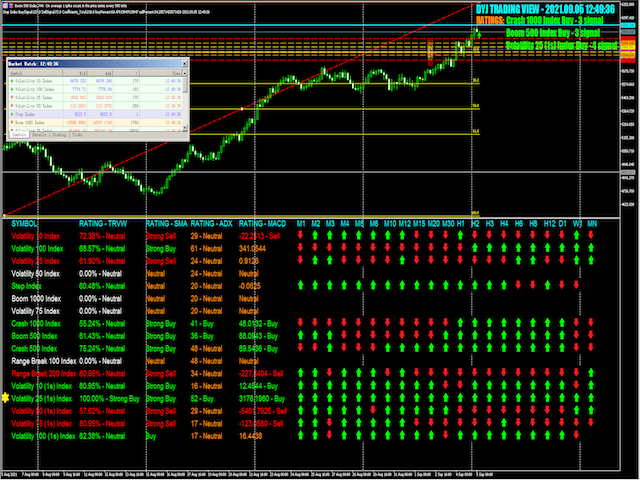
DYJ TRADINGVIEW ist ein Bewertungssystem mit mehreren Indikatoren, das die Anzahl der Bewertungssignale und Analysetools verwendet, um Einstiegsmöglichkeiten in globale Märkte zu finden

DYJ TRADINGVIEW hat 10 eingebaute Indikatoren für die Marktanalyse.

Eine indikatorbasierte Analyse wird von vielen Händlern verwendet, um ihnen zu helfen, Entscheidungen darüber zu treffen, welche Trades sie tätigen und wo sie ein- und aussteigen sollen.

Wir verwenden mehrere verschiedene Typen, die sich gut ergänzen können.

Verwenden Sie uns, um Ihrem Markt zu folgen. Sie können genauere Transaktionen finden.

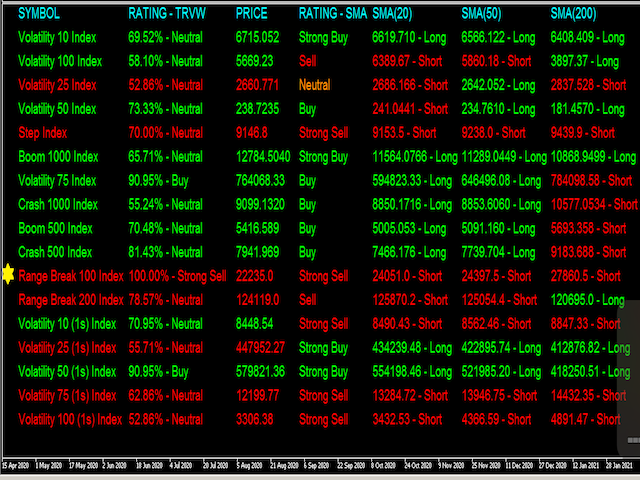
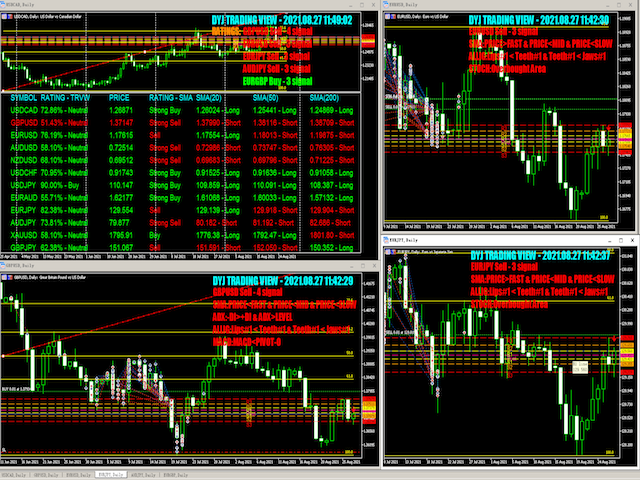
Zu den an der Bewertung teilnehmenden Trendindikatoren gehören DYJ POWERSIGNAL, ADX, SMA, Bollinger Bands.

Zu den am Rating teilnehmenden Oszillatoren gehören MACD, RSI, Stochastic, Alligator.

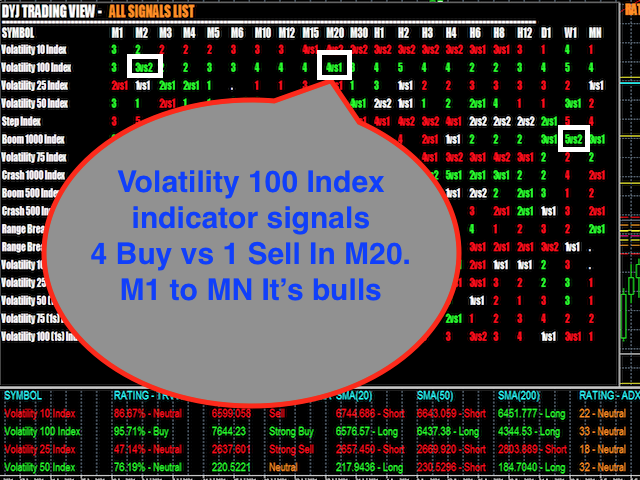
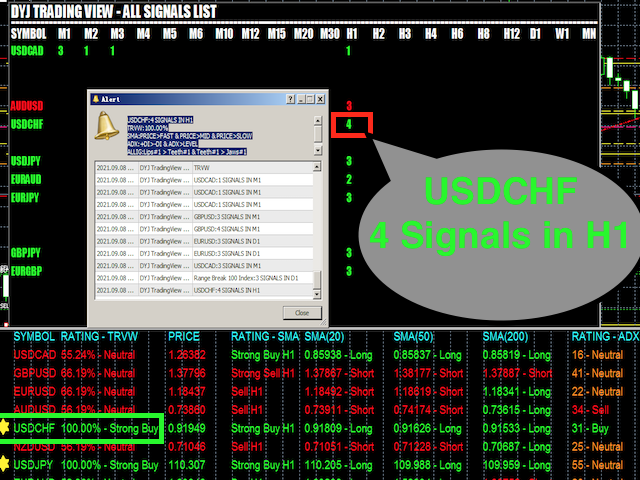
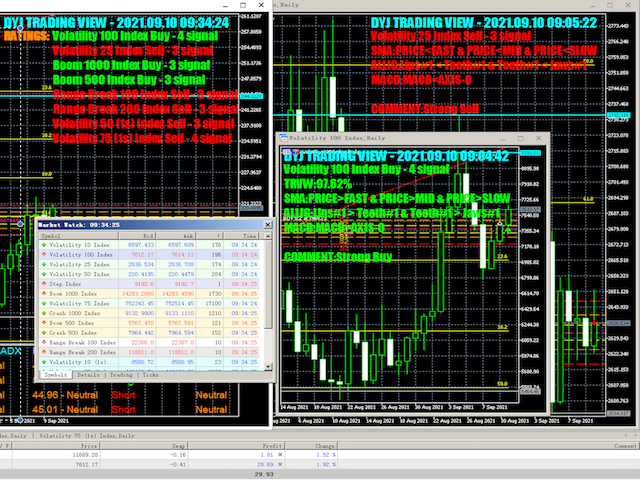
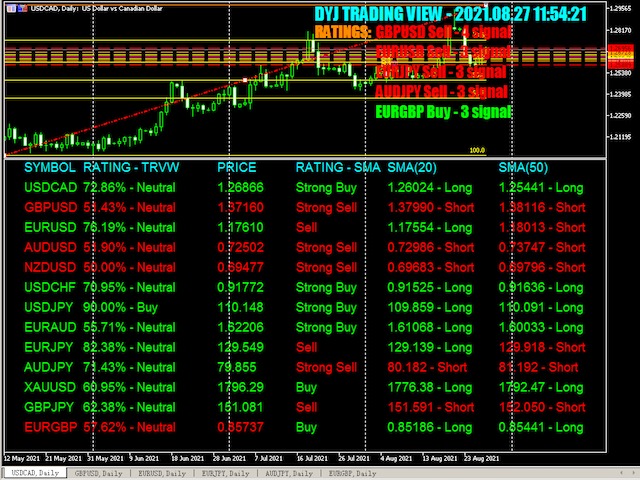
Wenn 3 Indikatoren die gleiche Richtung zeigen, um Signale zu kaufen oder zu verkaufen, wenn die Anzahl der Signale größer oder gleich 3 ist, beginnen wir mit dem Eintritt in die Markttransaktion.

Input

[GENERAL]

  • ViewName           =  "DYJ TRADING VIEW"  --> Company Name.
  • InpIsDisplayPrice  = true  -->  Display Price.
  • InpPriceShiftBars  = 1  -->  Price Shift Bars
  • InpMaxTrendeds   =  3 --> Signals is greater than InpMaxTrendeds, rating symbol .

[TRADINGVIEW]   

  • InpPowerSignalMinPercent   =  90 --> TradeingView Minimum Percent
  • InpPowerSignalStrongPercent   =  100 --> TradeingView Strong Percent
  • InpPowerSignalMaxPercent   =  100 --> TradeingView Maximum Percent
  • InpHiddenPeriodTrend       =  false   --> Hide M1 to MN

[CANDLE]

  • InpUseCandle =  true -->  Use Candle.
  • InpEntryUpper           =  33 --> Spread Multiple,It's Buy Entryies    
  • InpEntryLower           =  33 --> Spread Multiple,It's Sell  Entryies  

[MA]

  • InpUseMA=true;
  • InpIsDisplayFastMA=true  -->  DisplayFastMA
  • InpIsDisplayMidMA=true  --> Display MidMA
  • InpIsDisplaySlowMA=true  --> Display SlowMA
  • InpMAFastPeriod=20        --> Fast Period
  • InpMAMidPeriod=50       -->  Mid Period
  • InpMASlowPeriod=200     -->  Slow Period

[ADX] 

  • InpUseAdx=true --> Use ADX
  • InpIsDisplayPlusdi=false;  -->  Display ADX Plusdi
  • InpIsDisplayMinusdi=false --> Display ADX Minusdi
  • InpAdxPeriod               = 14 -- ADX:  Averaging period 
  • InpTrendLevel              = 30 -- ADX:  Trend Level 

[RSI]

  • InpUseRsi  =true --> Use RSI
  • InpRSIPeriod               =  14  -->  RSI Period
  • InpRsiOversold            =  30       --> R si Oversold
  • InpRsiOverbought        =  70 -->  Rsi Overbought

[BOLLINGER] 

  • InpUseBollinger   =  true  -->  Use Bollinger
  • InpIsDisplayUpper=true
  • InpIsDisplaylower=true
  • Inp_Bands_bands_period                 = 20 -- Bollinger bands period
  • Inp_Bands_deviation                    = 2 -- Bollinger bands deviations
  • InpBandDistance                        = 50 -- BandDistance,in points   

[MACD]

  • InpUseMACD   =  true -->  Use MACD
  • InpIsDisplayMacdSignal=false -->  Display MacdSignal
  • InpMacdFast                = 12 -->  MacdFast
  • InpMacdSlow                = 26 -->  MacdSlow
  • InpMacdSignal              = 9 -->  MacdSignal
  • InpMacdPriceField          = PRICE_CLOSE -->  macd calculation method 
  • InpMACDOpenLevel           = 3 -->  MACD Open Level
  • InpMACDCloseLevel          = 2 -->  MACD Close Level

[MACD MA TREND]

  • InpMacdMA                  = 26  -->  MA Period
  • InpMacdMAMethod            = MODE_EMA -->  type of smoothing macdma
  • InpMacdMAPriceField        = PRICE_CLOSE -->  macd calculation method 

[STOCHASTIC]

  • InpUseStochastic        =  true  --> Use Stochastic
  • InpSTOKperiod              = 5 --> K-period 
  • InpSTODperiod              = 3 --> D-period 
  • InpSTOSlowing              = 3 -->  slowing-period    
  • InpSTOMaMethod             = MODE_EMA -->  type of smoothing stochastic
  • InpSTOPriceField           = STO_LOWHIGH -->  stochastic calculation method 
  • InpOversoldArea            = 20 --> stoch oversold zone
  • InpOverboughtArea          = 80 -->  stoch overbought zone 

[ALLIGATOR]

  • Inp_jaw_period    = 13 -->  period for the calculation of jaws 
  • Inp_jaw_shift     = 8 --> horizontal shift of jaws 
  • Inp_teeth_period  = 8 -->  period for the calculation of teeth 
  • Inp_teeth_shift   = 5 -->  horizontal shift of teeth 
  • Inp_lips_period   = 5 -->  period for the calculation of lips 
  • Inp_lips_shift    = 3 -->  horizontal shift of lips 
  • Inp_ma_method     = MODE_EMA -->  type of smoothing 
  • Inp_applied_price = PRICE_MEDIAN  -->  type of price 
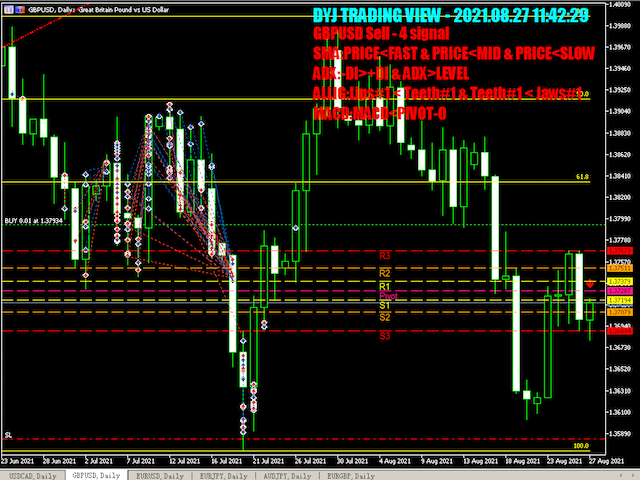
[PIVOT]

  • InpUsePivot = true;  
  • InpCalculationMode =  FIBONACCI_RETRACEMENT    -->   FIBONACCI RETRACEMENT 

[FIBONACCI]

  • InpUseFibonacci = true; 
  • InpFibDate1=1 -->  1 st point's date, % 
  • InpFibPrice1=1 -->  1 st point's price, % 
  • InpFibDate2=100 -->  2 nd point's date, % 
  • InpFibPrice2=100 -->  2 nd point's price, % 

[Panel]

  • InpLanguage              = English --> English or Chinese


Bewertungen 1
Marion Lancaster Dicaprio
180
Marion Lancaster Dicaprio 2021.09.07 07:21 
 

I highly recommended Dyj global for their products and customer's services. I sincerely think they are the best in the industry they will go above an beyond to make sure you get the best trading results. I have been using this service for approximately one year.

Empfohlene Produkte
Alpha Binary Pro
Rafael Alejandro Rey Alves
1 (1)
The Alpha Binary Pro indicator is intended to work in different scenarios. This indicator uses a combination of technical indicators to detect buy or sell opportunities. The indicator works with any currency pair, stocks, cryptocurrencies and synthetic indices. The indicated can be used for both traditional trading and binary options. The indicator works with any time frame, from M1 to MN. When the blue arrow is pointing upwards this indicates that the signal is to buy. When the red
30 USD
Noize Absorption Index - is the manual trading system that measures the difference of pressure between bears forces and bulls forces. Green line - is a noize free index that showing curent situation. Zero value of index shows totally choppy/flat market.Values above zero level shows how powerfull bullish wave is and values below zero measures bearish forces.Up arrow appears on bearish market when it's ready to reverse, dn arrow appears on weak bullish market, as a result of reverse expectation.
199 USD
Premium-Level ist ein einzigartiger Indikator mit mehr als 80% Genauigkeit der richtigen Vorhersagen! Dieser Indikator wurde von den besten Trading-Spezialisten seit mehr als zwei Monaten getestet! Den Indikator des Autors finden Sie nirgendwo anders! Anhand der Screenshots können Sie sich von der Genauigkeit dieses Tools überzeugen! 1 ist ideal für den Handel mit binären Optionen mit einer Ablaufzeit von 1 Kerze. 2 funktioniert bei allen Währungspaaren, Aktien, Rohstoffen, Kryptowähr
1 100 USD
Magic Finger can help you identify trends and trading opportunities clearly. The finger points to the open position signal, and the discoloration line is confirmed by the trend. If you are a day trader, you can choose to trade during a period of active trading, referring to the discoloration line as the basis for the next order, finger signal as a filter. If you are a trend trader, you can choose a period above H1, wait for the appearance of the finger signal in the key price area, and enter
188 USD
Dieser Indikator zeigt Ihnen die TP- und SL-Werte (in dieser Währung), die Sie bereits für jede Order in den Charts (geschlossen zur Transaktions-/Orderzeile) festgelegt haben, was Ihnen sehr dabei helfen wird, Ihren Gewinn und Verlust für jede Order zu schätzen. Und es zeigt Ihnen auch die PIPs-Werte. das angezeigte Format ist „Währungswerte unserer Gewinn- oder Verlust-/PIPs-Werte“. Der TP-Wert wird in grüner Farbe und der SL-Wert in roter Farbe angezeigt. Bei Fragen oder weiteren Informati
99 USD
Your Trend Friend
Luigi Nunes Labigalini
The trend is your friend! Look at the color of the indicator and trade on that direction. It does not  repaint. After each candle is closed, that's the color of the trend. You can focus on shorter faster trends or major trends, just test what's most suitable for the symbol and timeframe you trade. Simply change the "Length" parameter and the indicator will automatically adapt. You can also change the color, thickness and style of the lines. Download and give it a try! There are big movements
99 USD
How to use Pair Trading Station Pair Trading Station is recommended for H1 time frame and you can use it for any currency pairs. To generate buy and sell signal, follow few steps below to apply Pair Trading Station to your MetaTrader terminal. When you load Pair Trading Station on your chart, Pair Trading station will assess available historical data in your MetaTrader platforms for each currency pair. On your chart, the amount of historical data available will be displayed for each currency pai
280 USD
Double HMA MTF for MT5
Pavel Zamoshnikov
5 (2)
This is an advanced multi-timeframe version of the popular Hull Moving Average (HMA) Features Two lines of the Hull indicator of different timeframes on the same chart. The HMA line of the higher timeframe defines the trend, and the HMA line of the current timeframe defines the short-term price movements. A graphical panel with HMA indicator data from all timeframes at the same time . If the HMA switched its direction on any timeframe, the panel displays a question or exclamation mark with a tex
30 USD
Kaufen Sie diesen Indikator und erhalten Sie die Beast Super Signal EA MT4-Version im Wert von 449 $ KOSTENLOS!       (Nur Kauf des vollständigen Produkts). Suchen Sie nach einem leistungsstarken Indikator für den Devisenhandel, der Ihnen dabei helfen kann, profitable Handelsmöglichkeiten mit Leichtigkeit zu erkennen? Suchen Sie nicht weiter als das Beast Super Signal. Dieser benutzerfreundliche trendbasierte Indikator überwacht kontinuierlich die Marktbedingungen, sucht nach neuen sich entwi
199 USD
Universal Trend
Maryna Shulzhenko
The Universal Trend indicator was created to detect trends in price movement and allows you to quickly determine not only the direction of the trend, but also understand the levels of interaction between buyers and sellers. The indicator works on all timeframes and currency pairs. The indicator gives fairly accurate signals and it is customary to use it both in trending and flat markets. It is advisable to use the indicator in combination with other tools for more reliable signals and making a
111 USD
Blahtech VWAP - Volume Weighted Average Price (VWAP) is the ratio of price to total volume. It provides an average price over a specified time interval.  Links [  Install  |  Update  |  Documentation   ] Feature Highlights Configurable VWAP Line Sessions, intervals, anchored or continuous Previous day settlement line Standard Deviation bands Alerts at bar close or real time Automatic Broker or Tick volumes Significantly reduced CPU usage Input Parameters Max Bars   - Restrict the number of
49 USD
The standard Bollinger Bands indicator has been improved by integrating additional indications from the Standard Deviation indicator (StdDev), which gives an additional filter for confirming trading signals. In addition, the color of the indicator's lines shows the beginning of a trend, its development and exhaustion. This indicator has a signal block that notifies the trader of the beginning of the trend on any time frame to which it is attached. Settings Type of messages - select the type of
30 USD
Promotion $66 lifetime for you. The principle of this indicator is very simple: detecting the trend with Moving Average, then monitoring the return point of graph by using the crossing of Stochastic Oscillator and finally predicting BUY and SELL signal with arrows, alerts and notifications. The parameters are fixed and automatically calculated on each time frame. Example: If you install indicator on EURUSD, timeframe M5: the indicator will detect the main trend with the Moving Average on this
66 USD
Modified Rainbow
Rafael Alejandro Rey Alves
Modified Rainbow   The Modified Rainbow indicator is intended to work in different scenarios. The indicator uses a combination of technical indicators to detect buy or sell opportunities (different Moving Averages and other technical indicators). The indicator works with any currency pair, stocks, cryptocurrencies and synthetic indices. The indicator can be used for both traditional trading and binary options. The indicator works with any time frame, from M1 to MN. When the blue arrow
30 USD
Tunafish EA
Ismaele Daniele Lodetti
Tunafish EA is the most efficient EA on my profile. I spent a lot of time and effort to make this software sophisticated with possibilities of high potential returns while keeping the drawdown below 25%. The algorithms of the robot provide investors of any level of training with an investment opportunity that is both safe and aggressive. Tunafish EA imitating the work of the brain, capable of learning and adapting to changing conditions and predicting situations. When applied to trading in fina
69 USD
Upgraded - Stars added to indentify Areas you can scale in to compound on your entry  when buying or selling version 2.4 Upgraded Notifications and alerts added version 2.3 *The indicator is suitable for all pairs fromm  Deriv pairs (Vix,jump,boom & crash indices) , Currencies, cryptos , stocks(USA100, USA30 ), and metals like gold etc. How does it work? Increasing the period make it more stable hence will only focus on important entry points However  lowering the period will mean the indica
30 USD
Trendseite - ein technischer Indikator zur Bestimmung des Trends. Es ist eine Reihe von mehreren vollwertigen Handelsstrategien. Der Indikator verwendet ein fortschrittliches Trendfiltersystem, hat ein statistisches Panel, berechnet Einstiegs- und Ausstiegsniveaus und berechnet das dynamische Trailing-Stop-Niveau. Geeignet für jede Art von Symbolen, zeichnet seine Signale und Ergebnisse niemals neu. Ein umfassendes Tool für den professionellen Trendhandel. Das Set des Trend Side-Indikators um
50 USD
This is a Lite version of my Binary Wave Advance Oscillating indicator:  https://www.mql5.com/en/market/product/90734 It reduces the less useful indicators, while keeping it's predictive modifications to make each indicator within better than their stock counter part. I reduced it and made it simpler, in the hopes it would be less overwhelming and more approachable. Contains: ADX Chaikin Money Flow Index Each have separate smoothing controls to tame faster periods, as well as the Main has it's o
30 USD
PipFinite Exit EDGE MT5
Karlo Wilson Vendiola
4.88 (34)
Did You Have A Profitable Trade But Suddenly Reversed? In a solid strategy, exiting a trade is equally important as entering. Exit EDGE helps maximize your current trade profit and avoid turning winning trades to losers. Never Miss An Exit Signal Again Monitor all pairs and timeframes in just 1 chart www.mql5.com/en/blogs/post/726558 How To Trade You can close your open trades as soon as you receive a signal Close your Buy orders if you receive an Exit Buy Signal. Close your Sell orde
88 USD
Wave Trend MT5
Diego Arribas Lopez
MT4-Version Wellentrend MT5 Wave Trend ist ein Oszillator, der dabei hilft, Marktumkehrungen auf äußerst genaue Weise zu identifizieren. Dass der Oszillator über dem überkauften Niveau liegt und ein Abwärtskreuzen des schnellen in den langsamen MA zeigt normalerweise ein gutes VERKAUFS-Signal an. Wenn die Oszillatoren unter dem überverkauften Niveau liegen und der schnelle MA den langsameren MA kreuzt, hebt dies normalerweise ein gutes KAUFEN-Signal hervor. Der Wave Trend Indikator kann auch ver
129 USD
Renko Gold
Ignacio Agustin Mene Franco
Renko Gold! clearly indicates the floors and ceilings where it goes from 4 lines, the line below that marks the floor in green confirming with the thinnest line clarifies the purchase entry, the same is for sale, the top line marks the ceiling and the thinnest red line marks the sale, This indicator works for all temporalities! For Forex and Synthetic Indices markets! It also works for crypto markets! Good profit! World Investor.
40 USD
For a trader, trend is our friend. This is a trend indicator for MT5, can be used on any symbol. just load it to the terminal and you will see the current trend. green color means bullish trend and red means bearlish trend. you can also change the color by yourself when the indicator is loaded to the MT5 terminal the symbol and period is get from the terminal automaticly. How to use: I use this trend indicator on 2 terminals with different period  for the same symbol at same time. for example M5
200 USD
Automated Trendlines MT5
Georgios Kalomoiropoulos
Trendlinien sind das wichtigste Werkzeug der technischen Analyse im Devisenhandel. Leider zeichnen die meisten Händler sie nicht richtig. Der automatische Trendlinien-Indikator ist ein professionelles Tool für ernsthafte Trader, das Ihnen hilft, die Trendbewegung der Märkte zu visualisieren. Es gibt zwei Arten von Trendlinien Bullische Trendlinien und Bärische Trendlinien. Im Aufwärtstrend wird die Forex-Trendlinie durch die niedrigsten Swing-Punkte der Preisbewegung gezogen. Wenn man m
99 USD
PipFinite Trend PRO MT5
Karlo Wilson Vendiola
4.86 (657)
Breakthrough Solution For Trend Trading And Filtering With All Important Features Built Inside One Tool! Trend PRO's smart algorithm detects the trend, filters out market noise and gives entry signals with exit levels. The new features with enhanced rules for statistical calculation improved the overall performance of this indicator. Important Information Revealed Maximize the potential of Trend Pro, please visit www.mql5.com/en/blogs/post/713938 The Powerful Expert Advisor Version Automa
98 USD
Rainbow EA MT5
Jamal El Alama
Description : Rainbow EA MT5 is a simple Expert advisor based on   Rainbow MT5 indicator witch is based on Moving average with period 34. The indicator is incorporated in the EA, therefore, it is not required for the EA to operate, but if you wish, you can download it from   my product page . The Expert Advisor settings are as follows : Suitable for Timeframes up to H1 The parameters below can be set according to your trading rules. StopLoss ( Stop Loss in pips) TakeProfit ( Take Profit in pi
59 USD
Implementation of the Trend Transition indicator is simple - in the form of lines of two colors. The indicator algorithm is based on standard indicators as well as its own mathematical calculations. The indicator will help users determine the direction of the trend. It will also become an indispensable advisor for entering the market or for closing a position. This indicator is recommended for everyone, both beginners and professionals. How to interpret information from the indicator. Sell
57 USD
Eine der Zahlenfolgen heißt „Forest Fire Sequence“. Es wurde als eine der schönsten neuen Sequenzen anerkannt. Sein Hauptmerkmal ist, dass diese Sequenz lineare Trends vermeidet, selbst die kürzesten. Diese Eigenschaft bildete die Grundlage dieses Indikators. Bei der Analyse einer Finanzzeitreihe versucht dieser Indikator, alle möglichen Trendoptionen abzulehnen. Und nur wenn er scheitert, dann erkennt er das Vorhandensein eines Trends und gibt das entsprechende Signal. Dieser Ansatz ermöglicht
30 USD
Alpha Trend MT5
Evgeny Belyaev
5 (1)
Alpha Trend MT5 ist ein Trendindikator für die MetaTrader 5-Plattform. Es wurde von einer Gruppe professioneller Händler entwickelt. Der Alpha-Trend-MT5 Indikator ermittelt die wahrscheinlichsten Trendumkehrpunkte, wodurch Trades ganz am Anfang eines Trends möglich sind. Dieses Kennzeichen enthält Benachrichtigungen, die generiert werden, wenn ein neues Signal erscheint (Alarm, E-Mail, Push-Benachrichtigung). Dadurch können Sie eine Position zeitnah öffnen. Alpha Trend zeichnet nicht neu,
35.90 USD
Volality Index scalper indicator  Meant for Volality pairs such as Volality 10, 25, 50, 75 and 100 The indicator works on all timeframes from the 1 minute to the monthly timeframe the indicator is non repaint the indicator has 3 entry settings 1 color change on zero cross 2 color change on slope change 3 color change on signal line cross Orange line is your sell signal Blue line is your buy signal.
35 USD
SBA scalping v75
Umri Azkia Zulkarnaen
ini adalah indikator khusus digunakan untuk trading di binary.com dengan pair volatility 75. indikator ini sangat simpel dan mudah digunakan baik untuk yang sudah profesional atau pun yang baru dalam dunia trading terutama yang baru di market volatility 75.indikator ini lebih bertujuan untuk scalping trader dan menggunakan timeframe M1 sebagai acuan untuk entry. adapun jika ingin mempelajari lebih lanjut bisa menghubungi di telegram  https://t.me/shadowbreakerfx . untuk SOP lengkap silahkan klik
110 USD
Käufer dieses Produkts erwarben auch
Advanced Supply Demand MT5
Bernhard Schweigert
4.42 (12)
Derzeit 33% Rabatt! Die beste Lösung für jeden Anfänger oder erfahrenen Händler! Dieser Indikator ist ein einzigartiges, qualitativ hochwertiges und erschwingliches Trading-Tool, da wir eine Reihe von proprietären Funktionen und eine neue Formel integriert haben. Mit diesem Update werden Sie in der Lage sein, doppelte Zeitrahmenzonen anzuzeigen. Sie können nicht nur einen höheren TF (Zeitrahmen) anzeigen, sondern sowohl den Chart-TF als auch den höheren TF: SHOWING NESTED ZONES. Alle Supply Dema
199 USD
Der Forex TPA Indikator deckt die wahren Aktionen der Marktmacher auf, immer dann wenn sie passieren. "Kämpfe nicht gegen die Marktmacher an, sondern folge ihnen", ist wohl der beste Rat, den ein Trader bekommen kann. Der TPA Indikator zeigt jedesmal seine Signale an wenn die Bullen definitiv stärker sind als die Bären und umgekehrt. Dieser Indikator wurde VON Tradern FÜR Trader gemacht und ist 100% NICHT NACHZEICHNEND! Signale werden STRENG am Schluss einer Kerze  generiert. Das sagen unsere Ku
168 USD
Introduction to EFW Analytics EFW Analytics was designed to accomplish the statement "We trade because there are regularities in the financial market". EFW Analytics is a set of tools designed to maximize your trading performance by capturing the repeating fractal geometry, known as the fifth regularity in the financial market. The functionality of EFW Analytics consists of three parts. Firstly, Equilibrium Fractal Wave Index is an exploratory tool to support your trading logic to choose which r
200 USD
XQ Indicator MT5
Marzena Maria Szmit
5 (1)
The signal conditions are a combination of three indicators, and XQ Forex Indicators only display  medium and long-term trends . The indicator's efficacy has been improved with the addition of a filter that blocks out false signals. The XQ Forex Indicator can be used on  FX pairs, CFDs, and Cryptocurrencies . There are two type of signals:  Buy or Sell and Big Long or Big Short It is possible to enable sending emails when a major trend-change signal is detected, as well as to display the alerts
179 USD
PZ Trend Trading MT5
PZ TRADING SLU
3.67 (3)
Trend Trading ist ein Indikator, der so weit wie möglich von den Markttrends profitiert, indem er Pullbacks und Breakouts zeitlich festlegt. Sie findet Handelsmöglichkeiten, indem sie analysiert, was der Preis während etablierter Trends tut. [ Installationsanleitung | Update-Anleitung | Fehlerbehebung | FAQ | Alle Produkte ] Handeln Sie mit Zuversicht und Effizienz an den Finanzmärkten Profitieren Sie von etablierten Trends, ohne ins Wanken zu geraten Profitable Pullbacks, Ausbrüche und vor
175 USD
PZ Swing Trading MT5
PZ TRADING SLU
5 (4)
Swing Trading ist der erste Indikator, der Schwankungen in Trendrichtung und mögliche Umkehrschwankungen erkennt. Es wird der in der Handelsliteratur weit verbreitete Baseline-Swing-Trading-Ansatz verwendet. Der Indikator untersucht mehrere Preis- und Zeitvektoren, um die aggregierte Trendrichtung zu verfolgen und erkennt Situationen, in denen der Markt überverkauft oder überkauft ist und zur Korrektur bereit ist. [ Installationsanleitung | Update-Anleitung | Fehlerbehebung | FAQ | Alle Produkte
175 USD
WAPV Full MT5
Eduardo Da Costa Custodio Santos
## Arbeiten Sie professionell mit WAPV Full und verfolgen Sie Wo ist das Geld der großen Spieler? Stellen Sie sich vor, Sie hätten ein Werkzeug in der Hand, das allein das Lesen übernimmt der wichtigsten Marktteilnehmer mit den besten Handelsregionen basierend auf Preis- und Volumenanalyse. WAPV Full ist ein komplettes Tool, das sich zu 100 % auf den Betrieb von R. Wyckoff konzentriert Neben der Abbildung von Marktbewegungen in Handelswellen werden auch Abbildungen erstellt den Markt, indem Sie
199 USD
ToolBox 360 is the swiss knife of all indicators. It is full packed with useful tools to help you with your trading. It can be used to find best entry and exit points and help you to decide if you should open a trade or not. It shows market trends, candlestick formations outside / inside bars and you can sett time based allerts. Main features: Time based Fibonacci lines Choose a start and end time and the indicator shows you Fibonacci lines within the selected time range including range high
399 USD
Introduction to X3 Chart Pattern Scanner X3 Cherart Pattern Scanner is the non-repainting and non-lagging indicator detecting X3 chart patterns including Harmonic pattern, Elliott Wave pattern, X3 patterns, and Japanese Candlestick patterns. Historical patterns match with signal patterns. Hence, you can readily develop the solid trading strategy in your chart. More importantly, this superb pattern scanner can detect the optimal pattern of its kind. In addition, you can switch on and off individu
250 USD
VTrende Pro
Andrey Dyachenko
VTrende Pro - MTF indicator for trend trading with a display panel for MT5 *** Videos can be translated into any language using subtitles (video language - Russian) Although the signals of the VTrende Pro indicator can be used as signals of a full-fledged trading system, it is recommended to use them in conjunction with the Bill Williams TS. VTrende Pro is an extended version of the VTrende indicator. Difference between Pro version and VTrende: - Time zones - Signal V - signal 1-2 waves
697 USD
Dies ist wahrscheinlich der vollständigste Indikator für die automatische Erkennung der harmonischen Preisbildung, den Sie für die MetaTrader-Plattform finden können. Es erkennt 19 verschiedene Muster, nimmt Fibonacci-Projektionen genauso ernst wie Sie, zeigt die potenzielle Umkehrzone (PRZ) an und findet geeignete Stop-Loss- und Take-Profit-Werte. [ Installationsanleitung | Update-Anleitung | Fehlerbehebung | FAQ | Alle Produkte ] Es erkennt 19 verschiedene harmonische Preisbildungen Dar
249 USD
The Volume by Price Indicator for MetaTrader 5 features Volume Profile and Market Profile TPO (Time Price Opportunity). Get valuable insights out of currencies, equities and commodities data. Gain an edge trading financial markets. Volume and TPO histogram bar, line and metric charts. TPO letter and block marker charts including split structures. Positioning and styling options to suit the user's needs and context. Volume Profile and Market Profile TPO Point of Control (VPOC and TPOC), Imbalanc
179.95 USD
Buy and Sell Alerts when price breaks out following strict price action. Sends Alerts – #On MT5 To Your Phone To Your Email Does not repaint . Works on any Forex pair, any timeframe. 10 Activations allowed so you are free from limitations >> MT4 Version Here Description When the indicator detects a possible trade, it sends you an alert. It shows you where to place your trade and even suggests Stop Loss and Take Profits for you. How To Trade With The Breakout Entry Signals Indicator
297 USD
The Quantum VPOC indicator has been developed to expand the two dimensional study of volume and price, to a three dimensional one which embraces time. The volume/price/time relationship then provides real insight to the inner workings of the market and the heartbeat of sentiment and risk which drives the price action accordingly. The Quantum VPOC indicator displays several key pieces of information on the chart as follows: Volume Profile - this appears as a histogram of volume on the vertical pr
197 USD
Setups 9 Larry Williams
Luigi Nunes Labigalini
Buy and sell signals based on Larry Williams's exponential moving average strategies 9.1, 9.2, 9.3 and 9.4 for trend reversals and continuations. To understand the logic and how to trade the signals, please check: Setup 9.1:  https://www.mql5.com/pt/market/product/50986 Setup 9.2:  https://www.mql5.com/pt/market/product/52268 Setup 9.3:  https://www.mql5.com/pt/market/product/52269 Setup 9.4:  https://www.mql5.com/pt/market/product/52273 Notices:  - This indicator displays a lot of signals.
199 USD
Introduction to Fractal Pattern Scanner Fractal Indicator refers to the technical indicator that makes use of the fractal geometry found in the financial market. Fractal Pattern Scanner is the advanced Fractal Indicator that brings the latest trading technology after the extensive research and development work in the fractal geometry in the financial market. The most important feature in Fractal Pattern Scanner is the ability to measure the turning point probability as well as the trend probabil
185 USD
IVISTscalp5
Vadym Zhukovskyi
Wir stellen Ihnen den iVISTscalp5-Indikator vor, der nicht nur einzigartig, sondern auch effektiv im Handel ist. Dieser Indikator basiert auf Zeitdaten und ist das Ergebnis jahrelanger Erfahrung und eingehender Analyse der Finanzmärkte. Der iVISTscalp5-Indikator ist ein ausgezeichnetes Werkzeug für manuellen Handel. Bequemlichkeit, Einfachheit und Visualisierung - die gesamte Komplexität ist verborgen. Wir haben die Einstellungen und Verwendung des iVISTscalp5-Indikators auf das Maximum vereinfa
500 USD
The Volume Spread Analysis indicator is based on the original Volume Spread Analysis method. It was designed for quick and easy recognition of VSA patterns. Even though this indicator looks very simple, it is the most sophisticated tool we've ever made. It is a really powerful analytical tool that generates very reliable trading signals. Because it is very user-friendly and understandable, it is suitable for every type of trader, regardless of his experience. What is VSA? VSA - Volume Spread
199 USD
Divergenzen sind schwierig zu finden und seltener anzutreffen. Sie sind eines der zuverlässigsten Handelsszenarien. Dieser Indikator sucht automatisch mit Ihrem bevorzugten Oszillator nach regelmäßigen und versteckten Abweichungen. [ Installationsanleitung | Update-Anleitung | Fehlerbehebung | FAQ | Alle Produkte ] Einfach zu handeln Findet regelmäßige und versteckte Abweichungen Unterstützt viele bekannte Oszillatoren Implementiert Handelssignale basierend auf Ausbrüchen Zeigt geeignete
175 USD
Please send me Direct message on MQL5 CHAT after purchasing the Indicator for Training and Installation Support There are some additional files that is important to use with the Indicator . So be sure to contact me after purchasing the Indicator So that I can add you for training and support . If you find any difficulty with installation then send me Direct message here So that I can connect with you via Anydesk or Teamview for the product installation. " Smart Order Block Indicator " to find
249 USD
Seconds Charts
Aleksandr Goryachev
Micro  ******************* Секундные графики MT5 ********************** Более точного инструмента для входа в сделку вы не найдёте. Входные параметры: Timeframe, sek - период построения графика, секунды Displayed bars - отображаемые бары Step of price levels, pp, 0-off - шаг отрисовки ценовых уровней, пункты Scale points per bar, 0-off - масштаб в пунктах на бар Show lines - отображение текущих уровней Show comment - отображение комментария Standard color scheme - стандартная цветовая сх
1 500 USD
Mystery Signal
Cristian Mihail Pauna
Mystery Signal is a reliable trading signal based on pure price action and filtered with Relative Momentum and Relative Cyclicality. If you love simple charts, Mystery Signal is fitting your needs and it is providing efficient entries for any market and any timeframe. There are more than 20 years of work behind this indicator, and it was tested with good results on M15, H1, H4, and D1 timeframes. Mystery Signal confirmed by Order Blocks is giving us good leverage. A stable  Risk and Capital M
500 USD
Robos
Namu Makwembo
5 (1)
Big promotion on the Robos, Get yours now Robos Indicator The   ROBOS   indicator is a multi timeframe oscillator that targets the   overbought   and   oversold  regions of a price chart, a signal is indicated by the two lines crossing, compatible with all tradable instruments Latest Release The latest release is the version 4.0 #What's new in version 4.0 ? Features Extreme oversold and overbought levels ROBOS version  4.0  comes with cool new feature , the ability to target on
499 USD
Offer 249 down from 350 for the next 3 copies. then back to 350 $ Are you tired of using outdated indicators that leave you guessing where to set your profit targets? Look no further than the AK CAP Opening Range Breakout Indicator. This powerful tool is backed by a US patent and has already helped countless traders pass funded challenges like FTMO. We use it daily on our prop traders and internal funds, and now it's available to you as well. The calculation behind the indicator is incredibly
249 USD
PZ Day Trading MT5
PZ TRADING SLU
2.6 (5)
Dieser Indikator erkennt Preisumkehrungen im Zick-Zack, wobei nur Preisaktionsanalysen und ein Donchian-Kanal verwendet werden. Es wurde speziell für den kurzfristigen Handel entwickelt, ohne dass ein Nachlackieren oder ein Backpainting erforderlich ist. Es ist ein fantastisches Werkzeug für clevere Trader, die darauf abzielen, das Timing ihrer Operationen zu verbessern. [ Installationsanleitung | Update-Anleitung | Fehlerbehebung | FAQ | Alle Produkte ] Erstaunlich einfach zu handeln Es bi
175 USD
Einzigartiger Indikator, der einen professionellen und quantitativen Ansatz für Mean-Reversion-Trading umsetzt. Es nutzt die Tatsache, dass der Preis auf vorhersehbare und messbare Weise umlenkt und zum Mittelwert zurückkehrt, was klare Ein- und Ausstiegsregeln ermöglicht, die nicht-quantitative Handelsstrategien bei weitem übertreffen. [ Installation Guide | Update Guide | Troubleshooting | FAQ | All Products ] Klare Handelssignale Erstaunlich einfach zu handeln Anpassbare Farben und Größen I
175 USD
Big promotion! , prices are now on discount , get your copy now  The   Rubdfx Price Tracker   that is used to show price price bound , the price almost never goes out of the channel and most of the time price will react when it touches the channel limits .It determines the best highest and lowest prices at which you can sell and buy respectively Suitable for scalping & swing trading It Draws arrows that appear after a candle close , The arrows indicate bullish or bearish pressure For bearish an
499 USD
This is my own modified version of the RMI indicator. Its one of the best indicators i've found to take small profits from the market and i've been able to make it slightly better by modifying and fine tuning some parts Default settings works best for M1 timeframe The Relative Momentum Index calculates a ratio of upwards changes to downwards changes in prices over N-period bars. The RMI values range between 0 and 100. 30 and 70 are the two levels of oversold and overbought market conditions re
500 USD
Incinerat8
Paulos Ngwenya
This algorithm uses real time data to generate signals with an accuracy rate of 80%. It shows entries and where you should place both the stoploss and the take profit for each trade. It determines trend! It can even help you to become a signal provider! And it can generate up to 8 signals a day! You get access to a free forex trading community  Operates on any broker compatible to synthetic indices and forex   if you need any assistance whatsapp +2774 35 35 744 or telegram link @pipsempire01
400 USD
God win spike system
Israr Hussain Shah
1 (1)
• Non Repaint • DelayNo Lag •Pop Up notification • 98% Verified Accuracy • Real time arrows to catch spikes at least 4-8 bars We forward guide video how milk spikes  We also add in telegram group for better quality help  +see live trading results  https://youtu.be/DCG4CAWlg4I you will see an arrow signal and open trade for spike stop-loss of trade will be 8 or 10 candles if no spike exit you just need to follow spike arrow signals and for more good results follow inst
200 USD
Weitere Produkte dieses Autors
Die Planung von DYJ-Transfers ist ein Trends-System für Transaktionen, das eine Lagerhalle am Wendepunkt des Trends eröffnet. Ein beliebiges Symbol für einen beliebigen Broker: Devisenkurse oder eine andere Art (z. B. Deriv-Schwankungsindex usw.). ) Es zeigt die zugrunde liegenden Garantien für TP, SL, Rasterabstand und TPSL-Gewinnspanne sowie Mindesttransaktionsbetrag. Nach dem Öffnen des Lagers wird die Gewinnspanne für jede Kategorie angezeigt. Jede Kategorie verfügt über eine automatische
12 500 USD
DYJ News Developers sind die grundlegenden Marktanalyseindikatoren für Kalendertransaktions-Tools und makroökonomische Ereignisse. Hier finden Sie die Finanznachrichten und-indikatoren der größten Volkswirtschaft der Welt – von den USA und der Europäischen Union bis zu Australien und Japan – in neun Wirtschaftsnationen mit mehr als 60 Währungspaaren. Erfassung von über 800 makroökonomischen Indikatoren und Ereignissen aus öffentlichen Quellen in Echtzeit. Jeder Indikator weist historische, ak
75 USD
The  DYJ Williams Percent Range  is a unique High quality and easy to use and affordable trading tool because we have incorporated a number of proprietary features and  Williams' Percent Range  indicators. The Indicator values ranging between -80% and -100% indicate that the market is oversold. Indicator values ranging between -0% and -20% indicate that the market is overbought.  Input Parameters  WPR  settings InpSpread = 50 -- When the spread is greater than or equal to 50, the signal is ignor
150 USD
This StrongCurrency is a complete trading system based on a variety of technical indicators, moving averages and pivots. Each of those elements can be assessed in defined rules and coefficients (depending on the indicator) providing limitless optimization scenarios for the StrongCurrency. In order to work the StrongCurrency creates a trend strength and entry point signal list display by evaluating these data, that takes data from all symbols. It extrapolates all the information in order to get t
150 USD
This QuickClose help you to close all orders having profit immediately with only ONE CLICK, its work is very fast. You can choose which symbol you want or close all symbols so it will helpful for you in your trading to manage trading faster. This EA can quick close all Buy and Sell Orders by a selected symbol or total. This SymbolButton is designed for closing orders. There is available Manual and Automatic closing functions. Automatic closing function will close the orders according the paramet
30 USD
Professional traders know that a reversal in market price is the best entry points to trade. The trend changes K line state changes the most obvious. The SoarSignal is good to identify these changes, because we have incorporated the KDJ indicators. It is the closest to the K line state of the indicators. The two lines of KDJ Winner move within a range of 0 and 100. Values above 80 are considered to be in overbought territory and indicate that a reversal in price is possible. Values below 20 are
30 USD
StrongCurrency
Daying Cao
5 (1)
This StrongCurrency is a complete trading system based on a variety of technical indicators, moving averages and pivots. Each of those elements can be assessed in defined rules and coefficients (depending on the indicator) providing limitless optimization scenarios for the StrongCurrency. In order to work the StrongCurrency creates a trend strength and entry point signal list display by evaluating these data, that takes data from all symbols. It extrapolates all the information in order to get t
75 USD
PowerSignal
Daying Cao
5 (1)
Dieses PowerSignal ist ein komplettes Handelssystem, das auf ATR von technischen Indikatoren basiert. Diese Indikatoren zeichnen den aktuellen Status jedes POWERTRENDs in jedem analysierten Zeitrahmen und Währungspaar auf. Das PowerSignal erstellt durch Auswertung dieser Daten eine Trendstärken- und Einstiegspunkt-Signallistenanzeige. Wenn es bei einem Paar eine vollständige Übereinstimmung gibt, wird eine Warnung angezeigt, die auf einen solchen Fall hinweist. Listendaten umfassen Symbol, M5-M
150 USD
This indicator shows the crossing between two moving averages, a slower and faster moving average. Signal show alert pop-up, when MA1 crosses above the MA2. Signal show alert pop-up, when MA1 crosses below the MA2. Inputs Value Fast MA Setup Period = 5 - period of Faster Moving Average (value 5). Mode = SMA - type of Moving Average (SMA, EMA, SMMA, LWMA). Price = Close - type of price (Close, Open, Low, High, Median, Typical, Weighted). Slow MA Setup Period = 10 - period of Slower MA (value 10
30 USD
This EA is based on the classical trend-following system of opening the positions. The EA is based on DYJ TwoMACrossAlarm and ATR and CCI indicator. It uses two moving averages. The EA uses dynamic allocation MA period. The MA1 and MA2 period is the Fibonacci sequence, such as 5.8 or 13.21 or 21.34 or...; EA Entry Rules: Go long when fast MA1 crosses above the slow MA2 and CCI crosses above the zero line; Go short when fast MA1 crosses below the slow MA2 and CCI crosses below the zero line; the
75 USD
This indicator shows the crossing between three moving averages (slower, middle and faster ones). When fast MA crosses up middle MA and middle MA crosses up slow MA, the bullish alert is issued. When fast MA crosses down middle MA and middle MA crosses down slow MA, the bearish alert is issued. Signals to close buy positions are generated if fast MA crosses middle MA downwards, signals to close sell positions are generated if fast MA crosses middle MA upwards. Inputs Fast MA Setup MAPeriod1 =
30 USD
The Expert Advisor is based on three Moving Average indicators. ThreeMACross is based on the following idea: crossing of three Moving Average lines (Fast, Middle and slow ones) is used as a signal for opening and closing a position together. Go Long when Fast MA (MA1) crosses above Middle MA (MA2), and Middle MA (MA2) crosses above Slow MA (MA3). Go Short when Fast MA (MA1) crosses below Middle MA (MA2), and Middle MA (MA2) crosses below Slow MA (MA3). Signals to close buy positions are generate
75 USD
The RiseTrading is a unique High quality and easy to use and affordable trading tool because we have incorporated a number of proprietary features and PowerSignal and MACD and Stochastic indicators. The main advantages of the trend trading strategy used by the Expert Advisor are opening positions only in the direction of a trend, ability for the long-term retention of profitable positions allowing users to achieve good combinations of profit/loss distributions. That can work on a real account at
75 USD
DYJ-Aktien-Controller ist ein monetäres Transaktionssystem Es kann für jedes Währungspaar von M1 bis MN einen zufälligen Wert anzeigen. Wenn der Wert für Stoch in einem Zeitraum den Supermarkt und den Supermarkt erreicht, werden farbige Hinweise angezeigt. Sie können den richtigen Deal anhand dieser Informationen machen. Erstellen Sie eine Vorlage für den Bestandsindikator DYJ Inventory Controller, und speichern Sie diese. Wenn Sie mit der Maus auf einen Supermarkt oder einen Supermarkt klick
30 USD
The DYJ SoarTrading is based on SoarSignal indicator. It can be used for any currency pair and timeframe. Signals to buy are generated when SoarSignal has crossed oversold downwards, reached oversold and then crossed back up through oversold. Signals to sell are generated when SoarSignal has crossed overbought upwards, reached overbought, and then crossed back down through overbought. Close a trade when SoarSignal reaches the opposite side ( overbought for long order, oversold for short order).
75 USD
DYJ Sharp advanced algorithm that detects new trends and current trend continuations for use as an entry and exit strategy. The strategy display the SHARP trend demarcation area. This SHARP area has high HighLine and low LowLine. Falling of high below HighLine of SHARP and then falling of close below LowLine of SHARP can be interpreted as a signal to sell. Rising of close above HighLine of SHARP and then rising of low above LowLine of SHARP can be interpreted as a signal to buy. The signal for e
150 USD
DYJ TRENDWAVE features an advanced algorithm that detects new trends and current trend continuations for use as an entry strategy. DYJ TRENDWAVE's volatility is based on the power of buyers and sellers, it grabs total body size of candles and identifies the battle between buyers and sellers as a percentage of the total volume, like Sellers: (-)100% and Buyers: (+)100%. This information can be used for any entry and exit strategy. For bullish/Long Pin bar it is below the price line, for bearish/S
75 USD
DYJTRENDWAVE features an advanced algorithm that detects new trends and current trend continuations for use as an entry strategy. DYJTRENDWAVE's volatility is based on the power of buyers and sellers, it grabs total body size of candles and identifies the battle between buyers and sellers as a percentage of the total volume, like Sellers: (-)100% and Buyers: (+)100%. This information can be used for any entry and exit strategy. For bullish/Long Pin bar it is below the price line, for bearish/Sho
150 USD
DYJ Scalping ist ein vollautomatischer Expert Advisor. Für Einträge wird der Stochastische Indikatorfilter verwendet. Der Berater benötigt einen Hedging- und ECN-Kontotyp. Der Auftragsverlust wird durch das Spiel gerettet und wird zum Gewinn. Wenn die Bestellrichtung falsch ist. Sie können die Spielstrategie jederzeit deaktivieren. Allgemeine Empfehlungen Empfehlen Sie ECN-Konten, xauusd Spreads zwischen 8 und 11 oder niedriger, EUR/USD Spreads 1 Die Mindesteinzahlung beträgt 200€. Please downl
125 USD
DYJ Langfristige Strategie EA ist ein langfristiges Handelssystem Wir beginnen mit der Suche nach dem niedrigsten Preis in der Kerze als Long-Trend, und beginnen mit der Suche nach dem höchsten Preis als Short-Trend. Wir werden die Position für die längste Zeit halten und den maximalen Gewinn erzielen. Wenn der Auftrag in die falsche Richtung geht, kann die Strategie Verluste in Gewinne verwandeln. EA wird nur für eine Währung pro Periode im Diagramm ausgeführt. Signal URL INPUT InpMagicNumb
30 USD
The DYJBands opens and closes positions using Bollinger Bands signals: It performs trades after a price rebound from the borderlines of the indicator. It has the option to close positions by an opposite signal, by take profit and stop loss, move a trade to breakeven upon reaching the central Bollinger band or after a certain price movement. By default, the EA is configured for trading the GBPUSD currency pair on the H1 timeframe. Also, settings for the EURUSD, USDJPY, USDCAD and XAUUSD currency
125 USD
The DYJ MacdSto is a unique High quality and easy to use and affordable trading tool because we have incorporated a number of proprietary features and MACD and Stochastic and RSI and ADX indicators. The main advantages of the trend trading strategy used by the Expert Advisor are opening positions only in the direction of a trend, ability for the long-term retention of profitable positions allowing users to achieve good combinations of profit/loss distributions. DYJ MacdSto EA uses MACD and Stoch
75 USD
This StrongCurrency is a complete trading system based on a variety of technical indicators, moving averages and pivots. Each of those elements can be assessed in defined rules and coefficients (depending on the indicator) providing limitless optimization scenarios for the StrongCurrency. In order to work the StrongCurrency creates a trend strength and entry point signal list display by evaluating these data, that takes data from all symbols. It extrapolates all the information in order to get t
125 USD
The DYJ TrendPending EA tracks the new change of price of the currency pair and opens trades in case of a price low and high from the main movement in the direction of the trend. So EA uses the least risky grid and Add lots. And can attach a positive and reverse pending order. The PositivePending orders can reduce the number of grids and Add lots,  while ReversePending orders reduce the loss of orders . For more convenient search, the working timeframe has been added to inputs (Work timeframe).
150 USD
This is a multi-currency and multi-strategy EA. This EA is to create one or more polling trading strategies in a transaction. In the polling mode, the strategies filter a trend-free range market environment and trades are placed in the opposite direction at the edges of the range. With an additional main trend filter in the trend-following mode, the DYJ's ArtOfForexWar can also trade pull-backs during trends in the trend of loss. The winning rate is more than 95% within three orders or three cl
150 USD
DYJ ScalpingBurg EA ist ein vollautomatischer Expert Advisor. Der Burg Algorithmus Filter wird für Einträge verwendet. Der Berater benötigt einen Hedging- und ECN-Kontotyp. Der Auftragsverlust wird durch das Spiel gerettet und wird zum Gewinn. Wenn die Bestellrichtung falsch ist. Sie können die Spielstrategie jederzeit deaktivieren. Allgemeine Empfehlungen Empfehlen Sie ECN-Konten, xauusd Spreads zwischen 8 und 11 oder niedriger, EUR/USD Spreads 1 Die Mindesteinzahlung beträgt 200€. Bitte laden
150 USD
DYJ ArtOfMakingMoney attempts to gauge bullish and bearish forces in the market by using two separate measures, one for each type of directional pressure. The  EA's BearsIndex  attempts to measure the market's appetite for lower prices The EA's BullsIndex attempts to measure the market's appetite for higher prices Features Monitors all pairs at the same time. The EA monitors the top 35 pairs by default, but you can select less pairs if you wish. It is a multi-currency EA that can be run from a
125 USD
Unser Ziel ist es, einen zugänglichen und qualitativ hochwertigen Service zu bieten und Marktteilnehmern, Händlern und Analysten gleichermaßen die dringend benötigten Werkzeuge für fundierte, zeitnahe Handelsentscheidungen zu ermöglichen. Der optimierteste, äußerst robuste und benutzerfreundlichste DYJ-Trend-Analyst-Indikator. Der DYJ Trend-Analyst versucht, bullische und bärische Kräfte auf dem Markt zu messen, indem er zwei separate Messgrößen verwendet, eine für jede Art von Richtungsdru
125 USD
The DYJ Trend Analyser EA is based on  DYJ Trend Analyst  indicator. The most optimized, highly robust and easy to use DYJ Trend Analyser EA. DYJ Trend Analyser EA attempts to gauge bullish and bearish forces in the market by using two separate measures, one for each type of directional pressure. The  EA's BearsIndex  attempts to measure the market's appetite for lower prices. The EA's BullsIndex attempts to measure the market's appetite for higher prices. Pivot Point Extra Indicator for DYJ Tr
125 USD
This is an expert adviser that is intended to trade where sudden sharp movements occur on charts.  This EA is the trend breakout trading. However it makes only one trade per bar. Low risk EA with no too many positions, and there are predefined TP, SL and TS for each position. Features Monitors all pairs at the same time. The EA monitors the top 15 pairs by default, but you can select less pairs if you wish. It is a multi-currency EA that can be run from a single chart (M5 to D1,recommended timef
125 USD
Auswahl:
Marion Lancaster Dicaprio
180
Marion Lancaster Dicaprio 2021.09.07 07:21 
 

I highly recommended Dyj global for their products and customer's services. I sincerely think they are the best in the industry they will go above an beyond to make sure you get the best trading results. I have been using this service for approximately one year.

Antwort auf eine Rezension
Version 2.6 2021.09.18
Version 2.06 2021.09.18
Modify the bug without updating the number of signals in frame
Version 2.5 2021.09.16
Version 2.05 2021.09.16
Modify the bug without updating the number of activity signals immediately
Version 2.4 2021.09.16
Version 2.04 2021.09.16
Added: Add the text of a tooltip in signal frame.
Added: Activity signal of indicator from MinTimeframe to MaxTimeframe in rating signal lists
Version 2.3 2021.09.15
Version 2.03 2021.09.14

Modify vertical distance for title in chart signal
Version 2.2 2021.09.15
Version 2.02 2021.09.14

Added:mode of price chart indent from the right border when we receive the signal
Version 2.1 2021.09.13
Version 2.01 2021.09.13

Added:Automatically activate the opened chart window when there is a new signal
Version 2.0 2021.09.13

Added:We automatically add a signal indicator in the new chart
Added:Email and mobile push notifications
Version 1.9 2021.09.08
Version 1.09 2021.09.08

Added:Default background color is black for Frame windows

Version 1.8 2021.09.08
Version 1.08 2021.09.08

Added:When the search for the highest candle and lowest candle position coincide, an alarm will pop up

Added:Display the signal quantity rating of all time frames. You can click currency pairs with signal greater than 3 and time frame transactions
Version 1.6 2021.09.06
Version 1.06 2021.08.26
Added:Find the highest and lowest candles, and can choose to display Close price or High and Low price
Version 1.5 2021.09.05
Version 1.05 2021.08.26
Added:Horizontal solid line at the previous days highest wick and close of the candle this for both uptrend and downtrend daily candles only
Version 1.4 2021.08.26
Version 1.04 2021.08.26
Optimize code
Version 1.3 2021.08.25
Version 1.03 2021.08.25
Optimize code
Version 1.2 2021.08.25
Version 1.02 2021.08.25
Optimize code
Version 1.1 2021.08.24
Version 1.01 2021.08.24
Optimize code