WaveTheory Fully automatic calculation
- Göstergeler
- Kaijun Wang
- Sürüm: 7.10
- Güncellendi: 11 Nisan 2023
- Etkinleştirmeler: 5
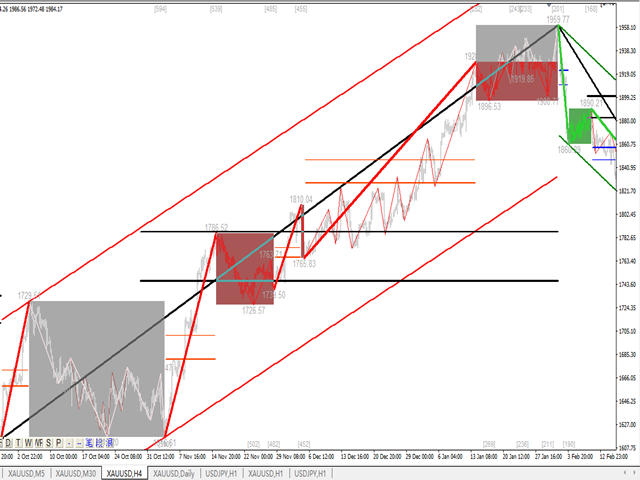
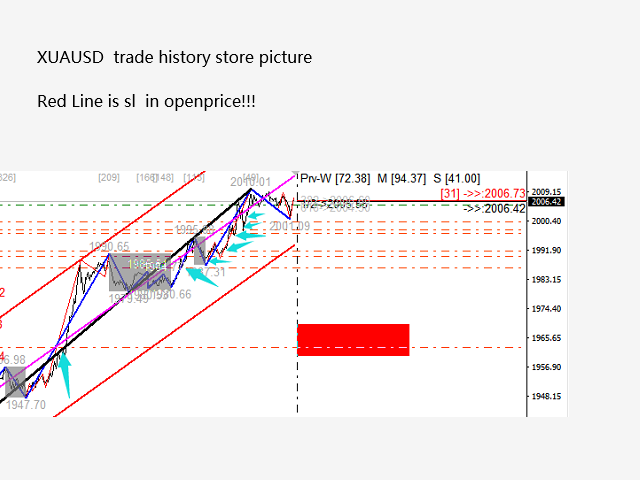
This indicator is a perfect wave automatic analysis indicator for practical trading!
The standardized definition of the band is no longer a wave of different people, and the art of man-made interference is eliminated, which plays a key role in strict analysis of the approach.=》Increase the choice of international style mode, (red fall green rise style)
The purchase discount is currently in progress!
Index content:
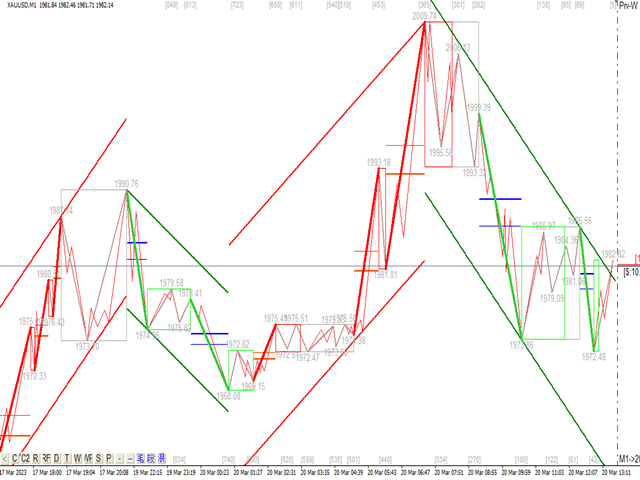
1.Basic wave: First, we found the inflection point of the basic fluctuation in the process of price fluctuation. Of course, his order is not too strong, which provides a basis for the next calculation.
2.Secondary band: On the basis of the basic wave, the second-level band with more obvious levels is obtained through algorithm analysis, and the second-level band provides the basis for wave analysis
3. Waves: There is a clearer trend and a clearer and more intuitive direction. To analyze whether a wave continues, you need to look at the shape of the secondary wave band, and analyze the composition of the secondary wave to get the subsequent prediction of the wave.
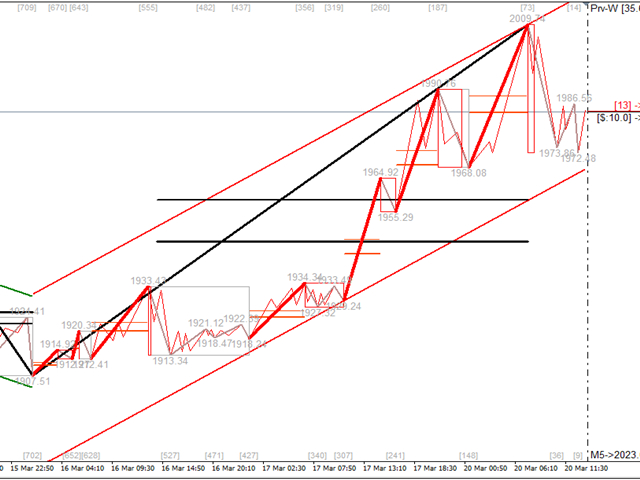
4. Channel: The channel calculation uses linear regression for calculation.
5. Retracement: The two important retracements in the wave will be displayed at the end of each wave. The relative strength of these important retracements in actual combat and the actual retracement determines the momentum of the trend
6.Oscillation interval: The oscillation interval is marked in the indicator
Indicator combat:
1. The source of actual combat theory is the basic wave theory, Taoist theory.
2. The theory of actual combat is more derived from actual combat, and you will always gain from reading pictures a thousand times.
3. I wanted to write some practical experience, but I found that the operation plan has been slightly adjusted in different varieties and strengths. The transaction is constantly being written and updated. The transaction is like a line buried in the sand even if it grabs the rope. But the sand keeps changing its shape.
4. When the wave is defined by quantification, trading will become simple and effective, the trend will become very clear, there is a general trend in the heart, and everything becomes simple and effective.
5. Whether it is trading on the left or on the right, whether it is trend trading or oscillating trading, this set of indicators has its answers. Everyone needs to feel the rhythm, level, momentum, and time of the trend and shock It is extremely important.
6. To understand the waves and trading waves, we must analyze the multi-level and multi-period.
Actual combat experience:
1.Wave theory and Taoist theory are written, but they are not completely in line with the laws of natural fluctuations. Many difficult situations will be found in the actual transaction analysis process.
2. Below we can divide the market into two types, the orderly and analyzable market and the disordered market.
3. There are trends and shocks in the orderly and analyzable market. This segment of the market can be analyzed by us, that is, the graphable part and the tradable part. Once this part is ordered, it will continue to have the characteristics of order, so We can get enough profit in it
4. Disordered market, fluctuations will appear disorderly, different from shocks, disordered market cannot participate. Picking up money in order, avoiding in disorder.
I hope to meet destined people, share the joy of trading together, and grow together!
It is more suitable for gold, oil, GBPJPY ,BTC and other trending varieties.
by kjoin.


这套波浪系统非常棒,解决了缠论的画线段问题,从级别的不断递推,分析行情有帮助,感谢作者