• 미리보기
  • 리뷰 (2)
  • 코멘트 (2)
  • 새 소식

WaveTheory Fully automatic calculation

5

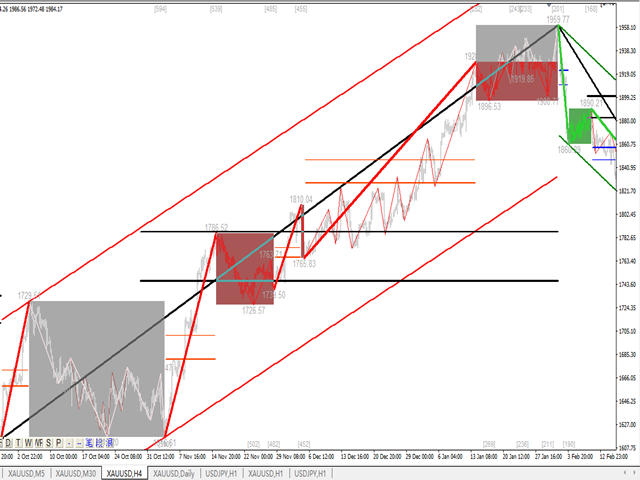
이 지표는 실용적인 거래를위한 완벽한 웨이브 자동 분석 지표입니다!=>Increase the choice of international style mode, (red fall green rise style)

대역의 표준화된 정의는 더 이상 다른 사람들의 물결이 아니며 인공 간섭의 그림이 제거되어 접근 방식의 엄격한 분석에서 핵심 역할을 합니다.

⭐⭐⭐      현재 구매 할인 중! ⭐⭐⭐

색인 내용:

1.    기본파동: 첫째, 가격변동과정에서 기본변동의 변곡점을 찾았고, 물론 그의 주문이 너무 강하지 않아 다음 계산의 기초가 된다.

2.    2차 대역 : 기본파를 기반으로 알고리즘 분석을 통해 보다 명확한 2차 대역을 획득하고, 2차 대역은 파동 분석의 기반 제공

삼.    Wave: 추세가 더 명확하고 직관적이고 방향성이 있습니다.파동의 지속 여부를 분석하기 위해서는 2차 파동 대역의 형태를 살펴보고, 2차 파동의 구성을 분석하여 차후의 예측을 얻을 수 있어야 합니다. 파도.

4.    채널: 채널 계산은 계산을 위해 선형 회귀 방법을 사용합니다.

5.    되돌림: 웨이브의 두 가지 중요한 되돌림이 각 웨이브의 끝에 표시됩니다. 실제 전투에서 이러한 중요한 되돌림과 실제 되돌림의 상대적 강도가 추세의 모멘텀을 결정합니다.

6.    진동 간격: 진동 간격 은 표시기에 표시됩니다.

표시 전투:

1. 실제 전투 이론의 근원은 기본 파동 이론, 도교 이론입니다.

2. 실제 전투 이론은 실제 전투에서 더 많이 파생되며 그림을 천 번 읽으면 항상 얻을 수 있습니다.

3. 원래는 실제 경험을 좀 쓰고 싶었지만, 운영 계획이 다른 종류와 강점에서 약간 조정된 것을 발견했습니다. 거래는 지속적으로 작성되고 업데이트되고 있습니다. 거래는 잡아도 모래에 묻힌 선과 같습니다. 밧줄 하지만 모래는 계속해서 모양이 바뀝니다.

4. 파동이 수량화에 의해 정의되면 거래가 간단하고 효과적이 될 것이며 추세가 매우 명확해질 것이며 마음에 일반적인 추세가 있고 모든 것이 간단하고 효과적이 될 것입니다.

5. 왼쪽이든 오른쪽이든, 추세 거래이든 오실레이팅 거래이든, 이 지표 세트에는 답이 있습니다. 모두가 추세와 충격의 리듬, 수준, 모멘텀 및 시간을 느껴야 합니다. 매우 중요합니다.

6. 파동과 거래 파동을 이해하려면 다단계 및 다기간을 분석해야 합니다.


실제 전투 경험:

1.파동설과 도교설이 쓰여져 있지만 자연변동의 법칙과 완전히 일치하지 않고 실제 거래를 분석하는 과정에서 어려운 상황을 많이 발견하게 된다.

2. 아래에서 우리는 시장을 두 가지 유형, 즉 질서 있는 분석 가능한 시장과 무질서한 시장으로 나눌 수 있습니다.

3. 질서 있고 분석 가능한 시장에는 추세와 충격이 있습니다. 시장의 이 세그먼트, 즉 그래프 가능한 부분과 거래 가능한 부분은 우리가 분석할 수 있습니다. 이 부분이 주문되면 질서 있는 특성을 계속할 것이므로 우리는 충분한 이익을 얻을 수 있습니다

4. 무질서한 시장, 변동이 무질서하게 나타나며, 충격과 달리 무질서한 시장은 참가할 수 없습니다. 순서대로 돈을 줍고, 무질서를 피합니다.


운명의 사람들을 만나고, 거래의 기쁨을 함께 나누며, 함께 성장하기를 바랍니다!

금, 원유, 파운드 데이, 비트코인 및 기타 트렌드 품종에 더 적합합니다.

kjoin에 의해.


리뷰 2
Peng Jin
319
Peng Jin 2023.03.20 04:36 
 

这套波浪系统非常棒,解决了缠论的画线段问题,从级别的不断递推,分析行情有帮助,感谢作者

elite luis
3037
elite luis 2023.03.08 17:15 
 

Amazing indicator, another quality product from Author, Big Thank you! Author is super friendly and responsive, any issue he get it fix fast also he is open to idea suggestions and continously updating to improve his indicators, he is extremely passionate in what he is doing, deserved more than 5 stars for his dedication! Well Done!

추천 제품
Introduction to Fractal Pattern Scanner Fractal Indicator refers to the technical indicator that makes use of the fractal geometry found in the financial market. Fractal Pattern Scanner is the advanced Fractal Indicator that brings the latest trading technology after the extensive research and development work in the fractal geometry in the financial market. The most important feature in Fractal Pattern Scanner is the ability to measure the turning point probability as well as the trend probabil
185 USD
Utilities
Douglas Lucio De Araujo
Indicator with 3 features - Clock : Clock independent of the chart, counting continues even when the market is closed. - Template : After setting up a configuration in any graphic, be it color patterns, indicators, zoom ... The configuration will be copied to all active graphics. - TimeFrame : Set the TimeFrame on a chart, and with just one click all the active charts will be changed to the same TimeFrame.
30 USD
Market Chopper Indicator - is the manual system for market scalping. Indicator uses most accurate points to enter, when current trend has lost it's power and new one starts. Indicator shows : Enter points(buy/sell arrows), Exit points(Stoploss/Takeprofit arrows). Indicator makes market analysis and adapts to any market, any timeframe showing most relevant strategy for exact conditions. Main Indicator's Features Signals are NOT repaint, late or disappear; Every signal comes at the open of new bar
199 USD
Introduction This indicator detects volume spread patterns for buy and sell opportunity. The patterns include demand and supply patterns. You might use each pattern for trading. However, these patterns are best used to detect the demand zone (=accumulation area) and supply zone (=distribution area). Demand pattern indicates generally potential buying opportunity. Supply pattern indicates generally potential selling opportunity. These are the underlying patterns rather than direct price action. T
80 USD
Cobalto MT5
Jorge Waldron
This is an automatic system that manages input signals correlating the price, places a market order and adds a stop order contrary to the opposite signal at the distance determined by the parameter "Space between orders". The concept of Cobalto is based on the volatility of the market - it looks for strong movements for buying or selling. This system is designed to be used on ECN accounts with a leverage of 1:300. Parameters Lot_Management Initial_lot: In this parameter the size of the initial
135 USD
Box Weis Wave
Thalles Nascimento De Carvalho
5 (1)
Box Weis Wave, Indicator shows the volume waves with a plot of the swing corresponding to the wave in the sub-window There are possibilities to explore 5 ways when creating the balance sheets (totalVol, length, width, barDVol, lengthDVol). This indicador can be for used the Wyckoff Method. Information provided: - Swing on customized ticks; - History limit for display; - Volume in ticks and Real Volume; - 5 forms of swing. * The Swing Point Volume indicator can be purchased at
30 USD
Descriptions A point point is a technical analysis indicator, or calculations, used to determine the overall trend of market over different time frames. This indicator calculate the highest or lowest pivots among left x and right y bars and show the high/low level during that period.   From that, you could clearly see the top resistance & bottom support level and how market goes break out. Instructions pivotLeft - pivot left bar count pivotRight - pivot right bar count pivotHighColor - c
30 USD
Triplet pro
Hashimoto Takuma
개요 트리플렛은 이름에서 알 수 있듯이 동시에 1~3쌍을 거래할 수 있는 그리드 거래(반복 시스템) EA입니다. 상관관계가 낮은 3쌍(예: USDCHF / EURGBP / AUDNZD) 또는 음의 상관관계가 있는 쌍(예: USDJPY / S&P500)을 결합하여 위험 분산이 가능합니다. 쌍     ||   제한 없음.   모든 쌍 사용 가능. "EURUSD" 및 "USDJPY"와 같은 FX 쌍뿐만 아니라 "S&P500(CFD)", "XAUUSD(선물)", "BTCUSD(암호화폐)" 등에도 사용할 수 있습니다. 최소 요구 보증금     ||   조정할 수 있습니다. 예를 들어     실계좌는 500,000 JPY(= 3,700 USD)로 시작했습니다. 기간    ||   원하는 것을 사용할 수 있습니다. 이 EA는 내부적으로 월간 차트를 사용하므로 MT5 측에서 EA를 실행하는 차트의 기간을 조정할 필요가 없습니다. 실계좌 실적 myfxbook에서 EA의 라이브 공연을 확
153.60 USD
Oneiroi
Oleksandr Powchan
5 (1)
Oneiroi trades hard oversold and overbought conditions. On M15 you can achieve a very high hitrate. The system does not trade a lot because meeting the three conditions is quite hard. It will work on any pair and any broker but some are better than others. The EA will work also on small accounts but i would highly recomend to use a 100kcent account. Our Goal is to help you be way more profitable and way more stress free, so you can enjoy the things that are important to you and your fa
200 USD
MetaForecast M5
Vahidreza Heidar Gholami
5 (1)
MetaForecast predicts and visualizes the future of any market based on the harmonics in price data. While the market is not always predictable, if there is a pattern in the price, MetaForecast can predict the future as accurately as possible. Compared to other similar products, Metaforecast can generate more accurate results by analyzing market trends. Input Parameters Past size Specifies the number of bars that MetaForecast uses to create a model for generating future predictions. The model
69 USD
Flag MT5
Dmitry Fedoseev
An indicator of patterns #21, #22, #23 ("Flag") from Encyclopedia of Chart Patterns by Thomas N. Bulkowski. Parameters: Alerts - show alert when an arrow appears Push - send a push notification when an arrow appears (requires configuration in the terminal) PeriodBars - period in bars K - an additional parameter that influences the accuracy of pattern shape recognition. The influence of the parameter will be visible if not all of the pattern variants are enabled (not all three parameters Expandin
30 USD
Hello Seasonal Traders! The seasonality trading strategy works because the smart money is doing the same thing every single year more often than not. The month of the year or the day of the week and the time of the day can call the shots in any market.   The seasonal cycle is another useful tool in your trading arsenal. I'm not saying to trade solely off of seasonality and forget anything else. I'm only giving you another trading tool that you can incorporate into your own trading strategy to ga
50 USD
The Rainbow Multiple Moving Average (MMA) is a technical analysis tool used to identify trends and potential reversal points in financial markets. It is based on a system of moving averages that are designed to be used together, with each moving average having a different time frame. The Rainbow MMA consists of multiple exponential moving averages (EMAs) of different lengths, with each EMA plotted in a different color. Typically, the Rainbow MMA includes EMAs of 2, 3, 4, 5, 6, 7, 8, 9, 10, 11, a
199 USD
Phoenix MT5
Vladimir Gribachev
지표가 아닌 Expert Advisor는 지표, 주문 그리드 또는 마틴게일을 사용하지 않습니다. 하루 거래 수는 엄격하게 제한될 수 있으며 한 번에 하나의 주문만 시장에 나올 수 있습니다. 거래는 손절매로 보호되며 실제 또는 가상일 수 있습니다(중개인에게 숨겨짐). 차분한 시장에서 아시아 세션 동안 작동합니다. 미끄럼 방지 및 퍼짐 방지 기능이 내장되어 있습니다. 월요일부터 금요일까지 거래를 이체하지 않으며, 금요일에 거래를 자동으로 마감하는 기능이 있습니다. 이 전략은 가격 패턴을 사용합니다. 이것은 단기 추세의 방향을 결정하는 보편적인 방법입니다. 편리한 자금 관리, 각 N 잔액에 대한 고정 로트가 있습니다. 차트는 거래 통계를 표시하며 설정 및 최적화가 쉽습니다. 기본 작업 시간 프레임은 M5, EURUSD 기호입니다. 다음 쌍이 고문에게 적합합니다: GBPUSD, USDCAD, EURUSD, USDJPY, USDCHF, AUDUSD, NZDUSD ... 옵
45 USD
The indicator determines a special pattern of Joe Dinapoli. It gives very high probability buy and sell signals. Indicator does not repaint. Indicator Usage Buy Signal ''B'' Entry : Market buy order at signal bar close Stop : Low of signal bar Take Profit : First swing high Sell Signal ''S'' Entry : Market sell order at signal bar close Stop : High of signal bar Take Profit : First swing low Indicator Parameters Fast EMA : External Parameter (should be kept as default) Slow EMA: External Param
70 USD
Индикатор Magneto Weekly Pro отображает: Недельные важные линии поддержки и сопротивления (выделены желтым, красным и синим цветами). Основные недельные цели (выделены белым цветом). Недельные паттерны возврата цены (обозначаются красными флажками). Применение индикатора Magneto Pro можно использовать и как дополнение к существующей стратегии, и как самодостаточную торговую стратегию. Данный продукт состоит из двух индикаторов, работающих на разных временных промежутках, и предназначен для скал
30 USD
I do not have the exact indicator for MT4 but the nearest possible look alike can be downloaded from here . Also you may check this link . This is the exact conversion from TradingView: "Donchian Trend Ribbon" By "LonesomeTheBlue". One of the coolest indicators out there to detect trend direction and strength. As a trader you always need such indicator to avoid getting chopped in range markets. There are ten buffers as colors to use in EAs also. The indicator is loaded light and non-repaint. Not
40 USD
Envelopes Trader MT5   is a fully automated online trading advisor that uses complex algorithm mainly based on Envelopes and Moving Averages as main triggers with ADX, RSI, RVI and ATR as confirmations. This expert robot does not use martingale, and it does use fixed and hidden stop loss with take profit depend on trend direction change. This Forex EA works on all timeframes and all pairs, but it is recommended to use on   EURUSD H1   timeframe. Main Features:  No Martingale. No Averaging. No
150 USD
Percent
Raphael Moretti
The indicator will plot a line on the chart that corresponds to the closing price of the previous day, and based on this, it will plot the percentage levels of change in the price of the asset in question. It can be used on any asset. Period: Determine whether the closing price should be daily, weekly or monthly Minimum percentage: Determine the percentage for the indicator to plot the levels and sub-levels on the chart, eg 0.5 it will plot on the chart a line for every 0.5% variation and the su
100 USD
Introduction to Harmonic Volatility Indicator Harmonic Volatility Indicator is the first technical analysis applying the Fibonacci analysis to the financial volatility. Harmonic volatility indicator is another level of price action trading tool, which combines robust Fibonacci ratios (0.618, 0.382, etc.) with volatility. Originally, Harmonic Volatility Indicator was developed to overcome the limitation and the weakness of Gann’s Angle, also known as Gann’s Fan. We have demonstrated that Harmonic
80 USD
Matreshka
Dimitr Trifonov
Matreshka self-testing and self-optimizing indicator: 1. Is an interpretation of the Elliott Wave Analysis Theory. 2. Based on the principle of the indicator type ZigZag, and the waves are based on the principle of interpretation of the theory of DeMark. 3. Filters waves in length and height. 4. Draws up to six levels of ZigZag at the same time, tracking waves of different orders. 5. Marks Pulsed and Recoil Waves. 6. Draws arrows to open positions 7. Draws three channels. 8. Notes support and re
245 USD
HFTi Fibo Inverse
Thiago De Oliveira Rocha
Novo HFTi Fibo Inverse 1.0 Uma técnica automatizada Fibonacci. Cerca de 94% de acertos. Rendimento m édio de 8% no mês. DrawDown médio 4%. (90% de aprovação em mesas proprietárias como a "True Forex Funds", 8% (30 dias 1ª fase) e 4% (60 dias 2ª fase). ,  risco max. 4% ao dia).  Complete nosso Programa de Avaliação e receba fundos de até US$ 400.000. Conheça a True Forex Funds aqui Quem é a HFT Investimentos? Compromisso com a qualidade e segurança. A HFT Investimentos é uma empresa de desenvolvi
1 800 USD
Long island MT5
Dmitry Fedoseev
An indicator of pattern #31 ("Long Island") from Encyclopedia of Chart Patterns by Thomas N. Bulkowski. Parameters: Alerts - show alert when an arrow appears   Push - send a push notification when an arrow appears (requires configuration in the terminal) GapSize - minimum gap size in points ArrowType - a symbol from 1 to 17 ArrowVShift - vertical shift of arrows ShowLevels - show levels ColUp - color of an upward line ColDn - color of a downward line   Auto5Digits - automatic multiplication of
30 USD
(FOR MT5)  Ultimate Engulfing Scanner Multi Pair And Multi Time Frame :   This indicator has been designed to find the strongest engulfing patterns in the forex market. - An engulfing pattern is very simple to trade, without the need for any complicated analysis. - This patterns provides an excellent risk and reward ratio. Because your potential wins will     always be considerably larger than your potential losses. And this is CRITICAL to your long term     trading success.  - You have th
79 USD
Elliott Wave Trend MT5
Young Ho Seo
4 (3)
Elliott Wave Trend was designed for the scientific wave counting. This tool focuses to get rid of the vagueness of the classic Elliott Wave Counting using the guideline from the template and pattern approach. In doing so, firstly Elliott Wave Trend offers the template for your wave counting. Secondly, it offers Wave Structural Score to assist to identify accurate wave formation. It offers both impulse wave Structural Score and corrective wave Structure Score. Structural Score is the rating to sh
200 USD
RSIScalperPro
PATRICK WENNING
RSIScalperPro를 소개합니다 - 메타트레이더 5용 RSI 기반의 혁신적인 인디케이터로, 1분 차트에서의 스캘핑에 최적화되어 있습니다! RSIScalperPro를 사용하면 정확한 진입 및 청산 신호를 제공하는 강력한 도구를 손에 넣을 수 있습니다. RSIScalperPro는 서로 다른 두 가지 RSI 지표를 사용하여 과매수 및 과매도 레벨에 대한 명확한 신호를 제공합니다. 2개의 RSI의 시간 프레임 및 제한 값을 원하는 대로 조정하여 트레이딩 전략에 최적화된 결과를 얻을 수 있습니다. 차트 상의 개별 화살표는 거래 진입 및 청산 타이밍을 쉽게 파악하는 데 도움이 됩니다. 또한 RSIScalperPro의 특징 중 하나는 사용자 정의 가능한 3개의 이동 평균선입니다. 이를 통해 트렌드의 방향을 판단하고 강력한 거래 신호를 확인하는 데 도움이 됩니다. 이를 통해 조기에 트렌드를 감지하고 수익성 높은 거래에 참여할 수 있습니다. 뿐만 아니라 RSIScalperPro는 새로운 거래
30 USD
Buy and Sell Arrows On The Chart According To Price Action Sends Alerts On MT5 To Your Phone To You Email Does NOT repaint. Works on any pair, any timeframe.     10 Activations allowed so you are free from limitations. MT4 Version here . When you get a signal, all you need to do is check the previous structue highs and lows to use as your stop loss and take profit. See the video below. Settings: Apart from the times you want to get signals and where you want alerts, there is only o
297 USD
Impulse fractals indicator - is counter-trend oriented complex market fractal pattern.  Market creates bull/bear impulse, trend starts, fractals on impulsed wave are an agressive pullback signals. Buy arrow is plotted when market is bearish and it's impulse showed up-side fractal, and sell arrow is plotted when market is bullish and it's impulse showed dn-side fractal. Main indicator's adjustable inputs : impulsePeriod - main period of impulse histogram  filterPeriod  - smoothes impulse accordi
199 USD
XFlow
Maxim Kuznetsov
XFlow shows an expanding price channel that helps determine the trend and the moments of its reversal. It is also used when accompanying transactions to set take profit/stop loss and averages. It has practically no parameters and is very easy to use - just specify an important moment in the history for you and the indicator will calculate the price channel. DISPLAYED LINES ROTATE - a thick solid line. The center of the general price rotation. The price makes wide cyclical movements around the
250 USD
A useful scanner/dashboard that shows the RSI values for multiple symbols and Time-frames. It can be easily hidden/displayed with a simple click on the scanner man top left of the dashboard. You can input upper and lower RSI values and the colours can be set to show when above/below these values. The default values are 70 and 30. There are also input colours for when the RSI is above or below 50 (but not exceeding the upper/lower levels Symbols and time-frames are input separated by commas.
80 USD
이 제품의 구매자들이 또한 구매함
Advanced Supply Demand MT5
Bernhard Schweigert
4.42 (12)
현재 33% 할인! 초보자나 전문 트레이더를 위한 최고의 솔루션! 이 보조지표는 우리가 다수의 독창적 기능과 새로운 공식을 통합한 독특하고 고품질이며 저렴한 거래 도구입니다. 이 업데이트를 통해 이중 시간대를 표시할 수 있습니다. 더 높은 TF를 표시할 수 있을 뿐만 아니라 차트 TF와 더 높은 TF 모두를 표시할 수 있습니다: 중첩 영역 표시. 모든 Supply Demand 트레이더들이 좋아할 것입니다. :) 중요한 정보 공개 Advanced Supply Demand의 잠재력을 극대화하려면 다음을 방문하십시오. https://www.mql5.com/ko/blogs/post/720245   진입 또는 목표의 명확한 트리거 포인트를 정확히 찾아냄으로 해서 거래가 어떻게 개선될지 상상해 보십시오. 새로운 알고리즘을 기반으로 매수자와 매도자 간의 잠재적인 불균형을 훨씬 더 쉽게 분간할 수 있습니다. 왜냐하면 가장 강한 공급영역과 가장 강한 수요 영역과 과거에 어떻게 진행 되었는지를(이
199 USD
PZ Harmonacci Patterns MT5
PZ TRADING SLU
3.25 (4)
This is arguably the most complete harmonic price formation auto-recognition indicator you can find for the MetaTrader Platform. It detects 19 different patterns, takes fibonacci projections as seriously as you do, displays the Potential Reversal Zone (PRZ) and finds suitable stop-loss and take-profit levels. [ Installation Guide | Update Guide | Troubleshooting | FAQ | All Products ] It detects 19 different harmonic price formations It plots primary, derived and complementary Fibonacci p
249 USD
Introduction to EFW Analytics EFW Analytics was designed to accomplish the statement "We trade because there are regularities in the financial market". EFW Analytics is a set of tools designed to maximize your trading performance by capturing the repeating fractal geometry, known as the fifth regularity in the financial market. The functionality of EFW Analytics consists of three parts. Firstly, Equilibrium Fractal Wave Index is an exploratory tool to support your trading logic to choose which r
200 USD
IVISTscalp5
Vadym Zhukovskyi
당신에게 소개하는 iVISTscalp5 지표는 독특하면서도 거래 작업에서 효과적입니다. 이 지표는 시간 데이터를 기반으로 하며 금융 시장의 많은 경험과 깊은 분석의 결과입니다. iVISTscalp5 지표는 수동 거래에 뛰어난 도구입니다. 편리성, 간단함 및 시각화 - 모든 복잡성은 숨겨져 있습니다. 우리는 iVISTscalp5 지표의 설정과 사용을 최대한 단순화했습니다. 이 지표는 MT5 터미널에서 가지고 있는 모든 금융 상품에 적합합니다. 시간 기준으로 작동하는 시간은 4am에서 8pm (UTC+3)입니다. iVISTscalp5 지표 메뉴 (스크린샷 1 참조): History - 표시할 주간 수 계산 dT_min - 시간 설정 간격 선택 (분) TFline - 수평 볼륨 생성 (타임프레임) BARSline - 수평 볼륨 생성 (바 수) TFtrend1 - 매일 채널 생성 (타임프레임) BARStrend1 - 매일 채널 생성 (바 수) TFtrend2 - 주간 채널 생성 (타임프레임
500 USD
WAPV Full MT5
Eduardo Da Costa Custodio Santos
## WAPV Full을 사용하여 전문적으로 작동하고 추적할 수 있습니다. 큰 선수 돈은 어디에 있습니까 당신의 손에 혼자 읽기를 수행하는 도구가 있다고 상상해보십시오. 최고의 거래 지역을 보여주는 주요 마켓 플레이어의 가격 및 볼륨 분석을 기반으로 합니다. WAPV Full은 R. Wyckoff의 운영에 100% 초점을 맞춘 완전한 도구입니다. 거래 파동에서 시장 움직임을 매핑하는 것 외에도 매핑합니다. 가격과 거래량을 읽어 시장. 프로페셔널 마켓은 R. Wyckoff의 3가지 법칙에 따라 운영됩니다. # 원인과 결과 # 수요와 공급 # 노력 x 결과 이 모든 것이 WAPV Full로 제공되며 16가지 기본 도구를 제공합니다. 시장을 전문적으로 분석하고 결과적으로 결과를 개선하십시오. 내가 말하는 내용을 이해하려면 이미지와 비디오를 참조하십시오. ## WAPV Fulleul sayonghayeo jeonmunjeog-eulo jagdonghago chujeoghal su isss
199 USD
ToolBox 360 is the swiss knife of all indicators. It is full packed with useful tools to help you with your trading. It can be used to find best entry and exit points and help you to decide if you should open a trade or not. It shows market trends, candlestick formations outside / inside bars and you can sett time based allerts. Main features: Time based Fibonacci lines Choose a start and end time and the indicator shows you Fibonacci lines within the selected time range including range high
399 USD
Introduction to X3 Chart Pattern Scanner X3 Cherart Pattern Scanner is the non-repainting and non-lagging indicator detecting X3 chart patterns including Harmonic pattern, Elliott Wave pattern, X3 patterns, and Japanese Candlestick patterns. Historical patterns match with signal patterns. Hence, you can readily develop the solid trading strategy in your chart. More importantly, this superb pattern scanner can detect the optimal pattern of its kind. In addition, you can switch on and off individu
250 USD
VTrende Pro
Andrey Dyachenko
VTrende Pro - MTF indicator for trend trading with a display panel for MT5 *** Videos can be translated into any language using subtitles (video language - Russian) Although the signals of the VTrende Pro indicator can be used as signals of a full-fledged trading system, it is recommended to use them in conjunction with the Bill Williams TS. VTrende Pro is an extended version of the VTrende indicator. Difference between Pro version and VTrende: - Time zones - Signal V - signal 1-2 waves
697 USD
Buy and Sell Alerts when price breaks out following strict price action. Sends Alerts – #On MT5 To Your Phone To Your Email Does not repaint . Works on any Forex pair, any timeframe. 10 Activations allowed so you are free from limitations >> MT4 Version Here Description When the indicator detects a possible trade, it sends you an alert. It shows you where to place your trade and even suggests Stop Loss and Take Profits for you. How To Trade With The Breakout Entry Signals Indicator
297 USD
Quantum Volume Point of Control Indicator for MT5
QUANTUM TRADING SOFTWARE LIMITED
4 (1)
The Quantum VPOC indicator has been developed to expand the two dimensional study of volume and price, to a three dimensional one which embraces time. The volume/price/time relationship then provides real insight to the inner workings of the market and the heartbeat of sentiment and risk which drives the price action accordingly. The Quantum VPOC indicator displays several key pieces of information on the chart as follows: Volume Profile - this appears as a histogram of volume on the vertical pr
197 USD
Setups 9 Larry Williams
Luigi Nunes Labigalini
Buy and sell signals based on Larry Williams's exponential moving average strategies 9.1, 9.2, 9.3 and 9.4 for trend reversals and continuations. To understand the logic and how to trade the signals, please check: Setup 9.1:  https://www.mql5.com/pt/market/product/50986 Setup 9.2:  https://www.mql5.com/pt/market/product/52268 Setup 9.3:  https://www.mql5.com/pt/market/product/52269 Setup 9.4:  https://www.mql5.com/pt/market/product/52273 Notices:  - This indicator displays a lot of signals.
199 USD
The Volume Spread Analysis indicator is based on the original Volume Spread Analysis method. It was designed for quick and easy recognition of VSA patterns. Even though this indicator looks very simple, it is the most sophisticated tool we've ever made. It is a really powerful analytical tool that generates very reliable trading signals. Because it is very user-friendly and understandable, it is suitable for every type of trader, regardless of his experience. What is VSA? VSA - Volume Spread
199 USD
Please send me Direct message on MQL5 CHAT after purchasing the Indicator for Training and Installation Support There are some additional files that is important to use with the Indicator . So be sure to contact me after purchasing the Indicator So that I can add you for training and support . If you find any difficulty with installation then send me Direct message here So that I can connect with you via Anydesk or Teamview for the product installation. " Smart Order Block Indicator " to find
249 USD
Seconds Charts
Aleksandr Goryachev
Micro  ******************* Секундные графики MT5 ********************** Более точного инструмента для входа в сделку вы не найдёте. Входные параметры: Timeframe, sek - период построения графика, секунды Displayed bars - отображаемые бары Step of price levels, pp, 0-off - шаг отрисовки ценовых уровней, пункты Scale points per bar, 0-off - масштаб в пунктах на бар Show lines - отображение текущих уровней Show comment - отображение комментария Standard color scheme - стандартная цветовая сх
1 500 USD
Mystery Signal
Cristian Mihail Pauna
Mystery Signal is a reliable trading signal based on pure price action and filtered with Relative Momentum and Relative Cyclicality. If you love simple charts, Mystery Signal is fitting your needs and it is providing efficient entries for any market and any timeframe. There are more than 20 years of work behind this indicator, and it was tested with good results on M15, H1, H4, and D1 timeframes. Mystery Signal confirmed by Order Blocks is giving us good leverage. A stable  Risk and Capital M
500 USD
Robos
Namu Makwembo
5 (1)
Big promotion on the Robos, Get yours now Robos Indicator The   ROBOS   indicator is a multi timeframe oscillator that targets the   overbought   and   oversold  regions of a price chart, a signal is indicated by the two lines crossing, compatible with all tradable instruments Latest Release The latest release is the version 4.0 #What's new in version 4.0 ? Features Extreme oversold and overbought levels ROBOS version  4.0  comes with cool new feature , the ability to target on
499 USD
Offer 249 down from 350 for the next 3 copies. then back to 350 $ Are you tired of using outdated indicators that leave you guessing where to set your profit targets? Look no further than the AK CAP Opening Range Breakout Indicator. This powerful tool is backed by a US patent and has already helped countless traders pass funded challenges like FTMO. We use it daily on our prop traders and internal funds, and now it's available to you as well. The calculation behind the indicator is incredibly
249 USD
Big promotion! , prices are now on discount , get your copy now  The   Rubdfx Price Tracker   that is used to show price price bound , the price almost never goes out of the channel and most of the time price will react when it touches the channel limits .It determines the best highest and lowest prices at which you can sell and buy respectively Suitable for scalping & swing trading It Draws arrows that appear after a candle close , The arrows indicate bullish or bearish pressure For bearish an
499 USD
Modified RMI Indicator
Carl August Landstorp
This is my own modified version of the RMI indicator. Its one of the best indicators i've found to take small profits from the market and i've been able to make it slightly better by modifying and fine tuning some parts Default settings works best for M1 timeframe The Relative Momentum Index calculates a ratio of upwards changes to downwards changes in prices over N-period bars. The RMI values range between 0 and 100. 30 and 70 are the two levels of oversold and overbought market conditions re
500 USD
Incinerat8
Paulos Ngwenya
This algorithm uses real time data to generate signals with an accuracy rate of 80%. It shows entries and where you should place both the stoploss and the take profit for each trade. It determines trend! It can even help you to become a signal provider! And it can generate up to 8 signals a day! You get access to a free forex trading community  Operates on any broker compatible to synthetic indices and forex   if you need any assistance whatsapp +2774 35 35 744 or telegram link @pipsempire01
400 USD
God win spike system
Israr Hussain Shah
1 (1)
• Non Repaint • DelayNo Lag •Pop Up notification • 98% Verified Accuracy • Real time arrows to catch spikes at least 4-8 bars We forward guide video how milk spikes  We also add in telegram group for better quality help  +see live trading results  https://youtu.be/DCG4CAWlg4I you will see an arrow signal and open trade for spike stop-loss of trade will be 8 or 10 candles if no spike exit you just need to follow spike arrow signals and for more good results follow inst
200 USD
Adaptive Cyclicality
Cristian Mihail Pauna
The Adaptive Cyclicality indicator defines the cycles of any price evolution. This indicator is computed by applying the "Cyclicality" mathematical transformation to the Adaptive Moving Average function introduced by Perry J. Kaufmann. The Adaptive Cyclicality defines very good entry and exit trading signals near the minimal and maximal points. It is a very accurate indicator that can be used on any market and any timeframe. The Adaptive Cyclicality indicator can be used to generate automated en
600 USD
Weis Wave with Alert MT5
Trade The Volume Waves Single Member P.C.
4.93 (14)
Rental Package Options and Privilages  * For optimum results the yearly package is suggested due to live training and Discord  channel trading with the  creator! Rent Monthly Six Months   Yearly Weis Wave with Speed with Alert+Speed Index x x x Manual  x x x Quick Set up Video x x x Blog x x x Lifetime Updates x x x Setup and Training Material x x Free Rectangle Break Alert Tool      x Discord Access Channel "The SI traders" x 2-hour live methodology training x ** NEW PLUTUS SIGN
379 USD
Meco Ultimate Channel
Thapelo Kapwe
5 (1)
This indicator belongs to the family of channel indicators. These channel indicator was created based on the principle that the market will always trade in a swinging like pattern. The swinging like pattern is caused by the existence of both the bulls and bears in a market. This causes a market to trade in a dynamic channel. it is designed to help the buyer to identify the levels at which the bulls are buying and the bear are selling. The bulls are buying when the Market is cheap and the bears a
199 USD
Prices move for many reasons and these can vary from one operator to another: software, private and institutional traders simultaneously contribute to the formation of the price, making predictive art very difficult. However, there are measurable factors that bind the price to an underlying trend in line with the physical reality that the financial asset represents: these are the macroeconomic indicators. Large investors use this information wisely to set their strategies. Understanding these m
249 USD
AO unpaid divergences
Diego Arribas Lopez
5 (1)
[ How to use the Demo version ] [ MT4 Version ] AO unpaid divergences MT5 AO unpaid divergences is the first indicator developed to detailed analyze Regular and Hidden Divergences. It uses this analysis to find out possible entry points and targets. Below some of the characteristics of this indicator:  Time saving Highly customizable Working for all pairs (Crypto, Forex, Stocks, Indices, Commodities...) Suitable for Scalping or Swing trading Possible reversal swings Alerts and Notifications on M
224 USD
Relative Cyclicality
Cristian Mihail Pauna
The Relative Cyclicality indicator defines the cycles of any price evolution. This indicator is computed by applying the "Cyclicality" mathematical transformation to the classic Relative Strength Index indicator made by J. Welles Wilder. The Relative Cyclicality defines very good entry and exit trading signals near the minimal and maximal points. It is better than RSI itself due to the unicity of the minimal and maximal points on a specific time interval. The Relative Cyclicality indicator can b
600 USD
Price Cyclicality MT5
Cristian Mihail Pauna
The Price Cyclicality indicator defines the cycles of any price evolution. It shows clearly the ascending and descending intervals with asymptotic evolution near the minimal and maximal price values. The Price Cyclicality indicator can be used to generate automated entry signals near the minimal price values. Also, the Price Cyclicality indicator can be used to define limit conditions to generate automated exit signals near the maximal price values. The efficiency of this indicator was proved du
400 USD
Quantum Currency Array Indicator for MT5
QUANTUM TRADING SOFTWARE LIMITED
This indicator has been developed to identify and display these trends quickly and easily, allowing you to see instantly, those currency pairs which are trending, and those which are not – and in all timeframes, with just one click. The 28 currency pairs are displayed as a fan as they sweep from strong to weak and back again, and this is why we call it the ‘currency array’. All 28 pairs are arrayed before you, giving an instant visual description of those pairs that are trending strongly, those
197 USD
Quantum Currency Matrix Indicator for MT5
QUANTUM TRADING SOFTWARE LIMITED
Of all the four principle capital markets, the world of foreign exchange trading is the most complex and most difficult to master, unless of course you have the right tools! The reason for this complexity is not hard to understand. First currencies are traded in pairs. Each position is a judgment of the forces driving two independent markets. If the GBP/USD for example is bullish, is this being driven by strength in the pound, or weakness in the US dollar. Imagine if we had to do the same thing
197 USD
제작자의 제품 더 보기
The most friendly Copier interactive interface, the most abundant easy-to-use functions, and the best Copy solution.     EASY   : Easy to use, load and select the Master or SLAVE to use easily FAST:   Quickly copy orders, algorithmic optimal follow-up mechanism, priority calculation of new signals, priority queue processing received special signals Multiple:   1. Support multiple signals to be sent at the same time, multiple accounts can select multiple accounts to copy at the same time 2. Mul
68 USD
Necessary for traders: tools and indicators Waves automatically calculate indicators, channel trend trading Perfect trend-wave automatic calculation channel calculation , MT4 Perfect trend-wave automatic calculation channel calculation , MT5 Local Trading copying Easy And Fast Copy , MT4 Easy And Fast Copy , MT5 Local Trading copying For DEMO Easy And Fast Copy , MT4 DEMO Easy And Fast Copy , MT5 DEMO 砖图 Renko PRO->>>   The display of the brick map on the main map. The Renko chart ideal
FREE
Pivot trading: 1.pp pivot 2. r1 r2 r3, s1 s2 s3 Necessary for traders: tools and indicators Waves automatically calculate indicators, channel trend trading Perfect trend-wave automatic calculation channel calculation , MT4 Perfect trend-wave automatic calculation channel calculation , MT5 Local Trading copying Easy And Fast Copy , MT4 Easy And Fast Copy , MT5 Local Trading copying For DEMO Easy And Fast Copy , MT4 DEMO Easy And Fast Copy , MT5 DEMO Cooperation QQ:556024" Cooperation w
FREE
상인을 위한 최고의 파트너!   거래 보조: 이것은 매우 기능이 풍부한 거래 지원입니다. 개발이 쉽지 않습니다, Pro Click to jump를 응원해주세요 케이 트레이드 어시스턴트 프로 MT5 기본 사용 설정 기초적인: 언어 선택 스위치 지원(현재 중국어 및 영어 지원)       자동 언어 인식 위치를 열고 닫는   단축키 바인딩을 지원하고 단축키를 사용하여 위치를 빠르게 열고 닫습니다... 위치   를 닫기 위한 단축키. 잠금 해제는   테스트 환경   에서 사용할 수 있는 대부분의 기능   재생   작업을 지원합니다. 오픈 및 클로즈 포지션: 원클릭 포지션 오픈(   이익 및 손절을 위한 편리한 설정, 로트 크기 자동 계산 및 기타 편리한 기능 포함) 원클릭 청산   (잠금), 미니멀한 스타일 디자인, 청산 포지션 유형, 청산 포지션 유형(장기 주문, 빈 주문, 보류 주문), 이익이 0보다 큰 주문을 청산할지 여부를 자유롭게 선택할 수 있습니다
FREE
Pivot Trading 4
Kaijun Wang
5 (15)
Pivot trading: 1.pp pivot 2. r1 r2 r3, s1 s2 s3 Necessary for traders: tools and indicators Waves automatically calculate indicators, channel trend trading Perfect trend-wave automatic calculation channel calculation , MT4 Perfect trend-wave automatic calculation channel calculation , MT5 Local Trading copying Easy And Fast Copy , MT4 Easy And Fast Copy , MT5 Local Trading copying For DEMO Easy And Fast Copy , MT4 DEMO Easy And Fast Copy , MT5 DEMO Strongly recommend trend indicators,   a
FREE
Interfaceless documentary EA. It has been operating stably and efficiently for more than 5 years, and has accumulated many customers. Copier Advanced Version (On sale) Copier-MT4-FULL(click to download) Copier-MT5-FULL(click to download) MT4->DEMO Try(click to download) MT5->DEMO Try(click to download) Copier Interface Version Copier-MT4-FULL(click to download) Copier-MT5-FULL(click to download) MT4->DEMO Try(click to download) MT5->DEMO Try(click to download) Copier No Interface Version Copier
30 USD
이 지표는 실용적인 거래를위한 완벽한 웨이브 자동 분석 지표입니다! =》Increase the choice of international style mode, (red fall green rise style) 대역의 표준화된 정의는 더 이상 다른 사람들의 물결이 아니며 인공 간섭의 그림이 제거되어 접근 방식의 엄격한 분석에서 핵심 역할을 합니다.             현재 구매 할인 중!   색인 내용: 1.         기본파동:   첫째, 가격변동과정에서 기본변동의 변곡점을 찾았고, 물론 그의 주문이 너무 강하지 않아 다음 계산의 기초가 된다. 2.         2차 대역   : 기본파를 기반으로 알고리즘 분석을 통해 보다 명확한 2차 대역을 획득하고, 2차 대역은 파동 분석의 기반 제공 삼.         Wave:   추세가 더 명확하고 직관적이고 방향성이 있습니다.파동의 지속 여부를 분석하기 위해서는 2차 파동 대역의 형태를 살펴보고, 2차 파동의 구성을
188 USD
트레이더를 위한 최고의 파트너!   기본 사용 설정 기초적인: 언어 선택 스위치 지원(현재 중국어 및 영어 지원)       자동 언어 인식 위치를 열고 닫는   단축키 바인딩을 지원하고 단축키를 사용하여 위치를 빠르게 열고 닫습니다... 위치   를 닫기 위한 단축키. 잠금 해제는   테스트 환경   에서 사용할 수 있는 대부분의 기능   재생   작업을 지원합니다. 오픈 및 클로즈 포지션: 원클릭 포지션 오픈(   이익 및 손절매를 위한 편리한 설정, 로트 크기 자동 계산 및 기타 편리한 기능 포함) 원클릭 청산   (잠금), 미니멀한 스타일의 디자인, 청산 포지션 유형, 청산 포지션 유형(장기 주문, 빈 주문, 보류 주문), 이익이 0보다 큰 주문을 청산할지 여부를 자유롭게 선택할 수 있습니다. , 손실 주문 청산 여부, 청산 비율(0~100%) 설정, 청산 취소 여부, 잠금 기능은 옵션에서 직접 구현할 수 있습니다. 멀티 키 닫기 라인 청구 통제 롱
88.88 USD
Necessary for traders: tools and indicators Waves automatically calculate indicators, channel trend trading Perfect trend-wave automatic calculation channel calculation , MT4 Perfect trend-wave automatic calculation channel calculation , MT5 Local Trading copying Easy And Fast Copy , MT4 Easy And Fast Copy , MT5 Local Trading copying For DEMO Easy And Fast Copy , MT4 DEMO Easy And Fast Copy , MT5 DEMO MACD is called Convergence and Divergence Moving Average, which is developed from the double e
FREE
Necessary for traders: tools and indicators Waves automatically calculate indicators, channel trend trading Perfect trend-wave automatic calculation channel calculation , MT4 Perfect trend-wave automatic calculation channel calculation , MT5 Local Trading copying Easy And Fast Copy , MT4 Easy And Fast Copy , MT5 Local Trading copying For DEMO Easy And Fast Copy , MT4 DEMO Easy And Fast Copy , MT5 DEMO Advanced Bollinger Bands: 1. The Bollinger rail will change color with the direction" 2. T
FREE
K Trade Assistant
Kaijun Wang
4.95 (22)
트레이더를 위한 최고의 파트너! 거래 보조: 이것은 매우 기능이 풍부한 거래 지원입니다. 개발이 쉽지 않습니다, Pro Click to jump를 응원해주세요 케이 트레이드 어시스턴트 프로     기본 사용 설정 기초적인: 언어   를 자동으로 식별하는   언어 선택 스위치 지원(현재 중국어 및 영어 지원) 위치를 열고 닫는 단축키를   지원하고 단축키를 사용하여 위치를 빠르게 열고 닫습니다... 위치   를 닫기 위한 단축키. 잠금 해제는   테스트 환경   에서 사용할 수 있는 대부분의 기능   및 재생   작업을 지원합니다. 오픈 및 클로즈 포지션: 원클릭 포지션 오픈(   이익 및 손절매를 위한 편리한 설정, 자동 로트 계산 및 기타 편리한 기능 포함) 원클릭 청산   (잠금), 미니멀한 스타일 디자인, 청산 포지션 유형, 청산 포지션 유형(장기 주문, 빈 주문, 보류 주문), 이익이 0보다 큰 주문을 청산할지 여부를 자유롭게 선택할 수
FREE
Renko indicator MainChart
Kaijun Wang
4.62 (21)
Necessary for traders: tools and indicators Waves automatically calculate indicators, channel trend trading Perfect trend-wave automatic calculation channel calculation , MT4 Perfect trend-wave automatic calculation channel calculation , MT5 Local Trading copying Easy And Fast Copy , MT4 Easy And Fast Copy , MT5 Local Trading copying For DEMO Easy And Fast Copy , MT4 DEMO Easy And Fast Copy , MT5 DEMO 砖图Renko PRO->>> The display of the brick map on the main map. The Renko chart ideally remo
FREE
KDJ Index For MT5
Kaijun Wang
4.1 (10)
Necessary for traders: tools and indicators Waves automatically calculate indicators, channel trend trading Perfect trend-wave automatic calculation channel calculation , MT4 Perfect trend-wave automatic calculation channel calculation , MT5 Local Trading copying Easy And Fast Copy , MT4 Easy And Fast Copy , MT5 Local Trading copying For DEMO Easy And Fast Copy , MT4 DEMO Easy And Fast Copy , MT5 DEMO "Cooperative QQ:556024"  "Cooperation wechat:556024"  "Cooperative email:556024@qq.com" Strong
FREE
Necessary for traders: tools and indicators Waves automatically calculate indicators, channel trend trading Perfect trend-wave automatic calculation channel calculation , MT4 Perfect trend-wave automatic calculation channel calculation , MT5 Local Trading copying Easy And Fast Copy , MT4 Easy And Fast Copy , MT5 Local Trading copying For DEMO Easy And Fast Copy , MT4 DEMO Easy And Fast Copy , MT5 DEMO Advanced Bollinger Bands: 1. The Bollinger rail will change color with the direction" 2. T
FREE
Indicators are for trend followers! A trading system constructed by three moving averages. Trade with the trend and let profits run. Strongly recommend trend indicators,   automatic calculation of wave standard   and   MT5 version of automatic calculation of wave standard Necessary for traders: tools and indicators Waves automatically calculate indicators, channel trend trading Perfect trend-wave automatic calculation channel calculation , MT4 Perfect trend-wave automatic calculation channe
FREE
KDJ Index 4
Kaijun Wang
5 (11)
Necessary for traders: tools and indicators Waves automatically calculate indicators, channel trend trading Perfect trend-wave automatic calculation channel calculation , MT4 Perfect trend-wave automatic calculation channel calculation , MT5 Local Trading copying Easy And Fast Copy , MT4 Easy And Fast Copy , MT5 Local Trading copying For DEMO Easy And Fast Copy , MT4 DEMO Easy And Fast Copy , MT5 DEMO "Cooperative QQ:556024"  "Cooperation wechat:556024"  "Cooperative email:556024@qq.com" Strong
FREE
Necessary for traders: tools and indicators Waves automatically calculate indicators, channel trend trading Perfect trend-wave automatic calculation channel calculation , MT4 Perfect trend-wave automatic calculation channel calculation , MT5 Local Trading copying Easy And Fast Copy , MT4 Easy And Fast Copy , MT5 Local Trading copying For DEMO Easy And Fast Copy , MT4 DEMO Easy And Fast Copy , MT5 DEMO The homeopathic indicator is also called the CCI indicator. The CCI indicator was propos
FREE
Indicators are for trend followers! A trading system constructed by three moving averages. Trade with the trend and let profits run. Necessary for traders: tools and indicators Waves automatically calculate indicators, channel trend trading Perfect trend-wave automatic calculation channel calculation , MT4 Perfect trend-wave automatic calculation channel calculation , MT5 Local Trading copying Easy And Fast Copy , MT4 Easy And Fast Copy , MT5 Local Trading copying For DEMO Easy And Fast Copy
FREE
Donchian通道(唐奇安通道指标)是用于交易突破的最古老、最简单的技术指标之一。   一般来说,唐奇安通道的宽度越宽,市场波动就越大,而唐奇安通道越窄,市场波动性也就越小 。此外,价格走势可以穿过布林带,但你看不到唐奇安通道的这种特征,因为其波段正在测量特定时期的最高价和最低价。 交易实用必备工具指标 波浪自动计算指标,通道趋势交易 完美的趋势-波浪自动计算通道计算 , MT4版本 完美的趋势-波浪自动计算通道计算 , MT5版本 本地跟单复制交易 Easy And Fast Copy , MT4版本 Easy And Fast Copy , MT5版本 本地跟单复制交易 模拟试用 Easy And Fast Copy , MT4 模拟账号运行 Easy And Fast Copy , MT5 模拟账号运行 唐奇安通道指标计算: 唐奇安上阻力线 - 由过去N天的当日最高价的最大值形成。 唐奇安下支撑线 - 由过去N天的当日最低价的最小值形成。 中心线 - (上线 + 下线)/ 2   唐奇安通道信号   唐奇安通道常用作突破指标。它提供了两种主要类型的突破信号,一个是上阻力线或下支
FREE
Fit Channel
Kaijun Wang
5 (4)
The market price usually falls between the borders of the channel. If the price is out of range, it is a trading signal or trading opportunity. Basically, Fit Channel can be used to help determine overbought and oversold conditions in the market. When the market price is close to the upper limit, the market is considered overbought (sell zone). Conversely, when the market price is close to the bottom range, the market is considered oversold (buy zone). However, the research can be used to
30 USD
XM Channel
Kaijun Wang
4.67 (3)
The market price usually falls between the borders of the channel . If the price is out of range, it is a trading signal or trading opportunity . Basically, Fit Channel can be used to help determine overbought and oversold conditions in the market. When the market price is close to the upper limit, the market is considered overbought (sell zone). Conversely, when the market price is close to the bottom range, the market is considered oversold (buy zone). However, the research can be used
30 USD
Necessary for traders: tools and indicators Waves automatically calculate indicators, channel trend trading Perfect trend-wave automatic calculation channel calculation , MT4 Perfect trend-wave automatic calculation channel calculation , MT5 Local Trading copying Easy And Fast Copy , MT4 Easy And Fast Copy , MT5 Local Trading copying For DEMO Easy And Fast Copy , MT4 DEMO Easy And Fast Copy , MT5 DEMO Can set the cycle for other varieties of K line graph covered this window, fluctuations obse
FREE
KTrade Fibo For MT5
Kaijun Wang
4.9 (10)
Necessary for traders: tools and indicators Waves automatically calculate indicators, channel trend trading Perfect trend-wave automatic calculation channel calculation , MT4 Perfect trend-wave automatic calculation channel calculation , MT5 Local Trading copying Easy And Fast Copy , MT4 Easy And Fast Copy , MT5 Local Trading copying For DEMO Easy And Fast Copy , MT4 DEMO Easy And Fast Copy , MT5 DEMO Fibo: from KTrade 1. Automatically calculate and analyze the band. -> Get the desired band 2.
FREE
Necessary for traders: tools and indicators Waves automatically calculate indicators, channel trend trading Perfect trend-wave automatic calculation channel calculation , MT4 Perfect trend-wave automatic calculation channel calculation , MT5 Local Trading copying Easy And Fast Copy , MT4 Easy And Fast Copy , MT5 Local Trading copying For DEMO Easy And Fast Copy , MT4 DEMO Easy And Fast Copy , MT5 DEMO Strongly recommend trend indicators,   automatic calculation of wave standard   and   MT5 ve
FREE
History Trading Path
Kaijun Wang
4.43 (7)
Necessary for traders: tools and indicators Waves automatically calculate indicators, channel trend trading Perfect trend-wave automatic calculation channel calculation , MT4 Perfect trend-wave automatic calculation channel calculation , MT5 Local Trading copying Easy And Fast Copy , MT4 Easy And Fast Copy , MT5 Local Trading copying For DEMO Easy And Fast Copy , MT4 DEMO Easy And Fast Copy , MT5 DEMO Strongly recommend trend indicators,   automatic calculation of wave standard   and   MT5 ve
FREE
KTrade Fibo
Kaijun Wang
4.89 (9)
Necessary for traders: tools and indicators Waves automatically calculate indicators, channel trend trading Perfect trend-wave automatic calculation channel calculation , MT4 Perfect trend-wave automatic calculation channel calculation , MT5 Local Trading copying Easy And Fast Copy , MT4 Easy And Fast Copy , MT5 Local Trading copying For DEMO Easy And Fast Copy , MT4 DEMO Easy And Fast Copy , MT5 DEMO Fibo: from KTrade 1. Automatically calculate and analyze the band. -> Get the desired band 2.
FREE
Donchian通道(唐奇安通道指标)是用于交易突破的最古老、最简单的技术指标之一。 一般来说,唐奇安通道的宽度越宽,市场波动就越大,而唐奇安通道越窄,市场波动性也就越小 。此外,价格走势可以穿过布林带,但你看不到唐奇安通道的这种特征,因为其波段正在测量特定时期的最高价和最低价。 交易实用必备工具指标 波浪自动计算指标,通道趋势交易 完美的趋势-波浪自动计算通道计算 , MT4版本 完美的趋势-波浪自动计算通道计算 , MT5版本 本地跟单复制交易 Easy And Fast Copy , MT4版本 Easy And Fast Copy , MT5版本 本地跟单复制交易 模拟试用 Easy And Fast Copy , MT4 模拟账号运行 Easy And Fast Copy , MT5 模拟账号运行 唐奇安通道指标计算: 唐奇安上阻力线 - 由过去N天的当日最高价的最大值形成。 唐奇安下支撑线 - 由过去N天的当日最低价的最小值形成。 中心线 - (上线 + 下线)/ 2   唐奇安通道信号   唐奇安通道常用作突破指标。它提供了两种主要类型的突破信号,一个是上阻力线或下支撑线
FREE
Necessary for traders: tools and indicators Waves automatically calculate indicators, channel trend trading Perfect trend-wave automatic calculation channel calculation , MT4 Perfect trend-wave automatic calculation channel calculation , MT5 Local Trading copying Easy And Fast Copy , MT4 Easy And Fast Copy , MT5 Local Trading copying For DEMO Easy And Fast Copy , MT4 DEMO Easy And Fast Copy , MT5 DEMO MACD is called Convergence and Divergence Moving Average, which is developed from the double e
FREE
Necessary for traders: tools and indicators Waves automatically calculate indicators, channel trend trading Perfect trend-wave automatic calculation channel calculation , MT4 Perfect trend-wave automatic calculation channel calculation , MT5 Local Trading copying Easy And Fast Copy , MT4 Easy And Fast Copy , MT5 Local Trading copying For DEMO Easy And Fast Copy , MT4 DEMO Easy And Fast Copy , MT5 DEMO Can set the cycle for other varieties of K line graph covered this window, fluctuations obse
FREE
필터:
Peng Jin
319
Peng Jin 2023.03.20 04:36 
 

这套波浪系统非常棒,解决了缠论的画线段问题,从级别的不断递推,分析行情有帮助,感谢作者

elite luis
3037
elite luis 2023.03.08 17:15 
 

Amazing indicator, another quality product from Author, Big Thank you! Author is super friendly and responsive, any issue he get it fix fast also he is open to idea suggestions and continously updating to improve his indicators, he is extremely passionate in what he is doing, deserved more than 5 stars for his dedication! Well Done!

Kaijun Wang
113282
개발자의 답변 Kaijun Wang 2023.03.09 03:04
Thank you for your support.
리뷰 답변
버전 7.10 2023.04.11
>>>>>>>>>>>>>>>
버전 6.83 2023.03.17
>>>>>>>>>>
버전 6.82 2023.03.09
>>>>>>>>>>>
버전 6.81 2023.03.08
>>>>>>>>>>>>>>
버전 6.8 2023.03.08
>>>>>
1.增加动态组件的大小调整,和自适应大小
2.增加小组件控制,可以删除屏幕中的各项组件,可以多样化加载图表
3.增加国际交易风格的自动切换,自适应国际交易习惯
4.增加震荡区闪烁控制,可以设置关闭.
5.优化更新算法逻辑,优化判断条件细节
6.增加主趋势浪显示
버전 3.3 2022.03.21
>>>>>>>>>>>
버전 3.2 2022.03.19
>>>>
1.算法更新
2.纠错更新
버전 3.1 2021.11.22
>>>>>>>>>>>>
버전 2.88 2021.06.19
>>>>>
1.更新第一次图表计算计算K限制,0为取消限制....
2.更新指标加载后,关闭指标后复原图表的各项设置
버전 2.6 2021.03.29
>>>>>>
修复长时间间隔运行未计算的空白段
버전 2.5 2020.12.28
>>>>>>>>>>
버전 2.2 2020.12.27
>>>>>>增加风格自动设置为白底,可关闭
버전 2.0 2020.12.19
>>>>>>>>>>
updata alert function...
버전 1.20 2020.12.06
>>>>>>>>>算法优化
버전 1.10 2020.10.20
>>>>更新通道显示不友好