ZigZag Dashboard for MT4
- Göstergeler
- Taras Slobodyanik
- Sürüm: 4.70
- Güncellendi: 14 Mart 2024
- Etkinleştirmeler: 10
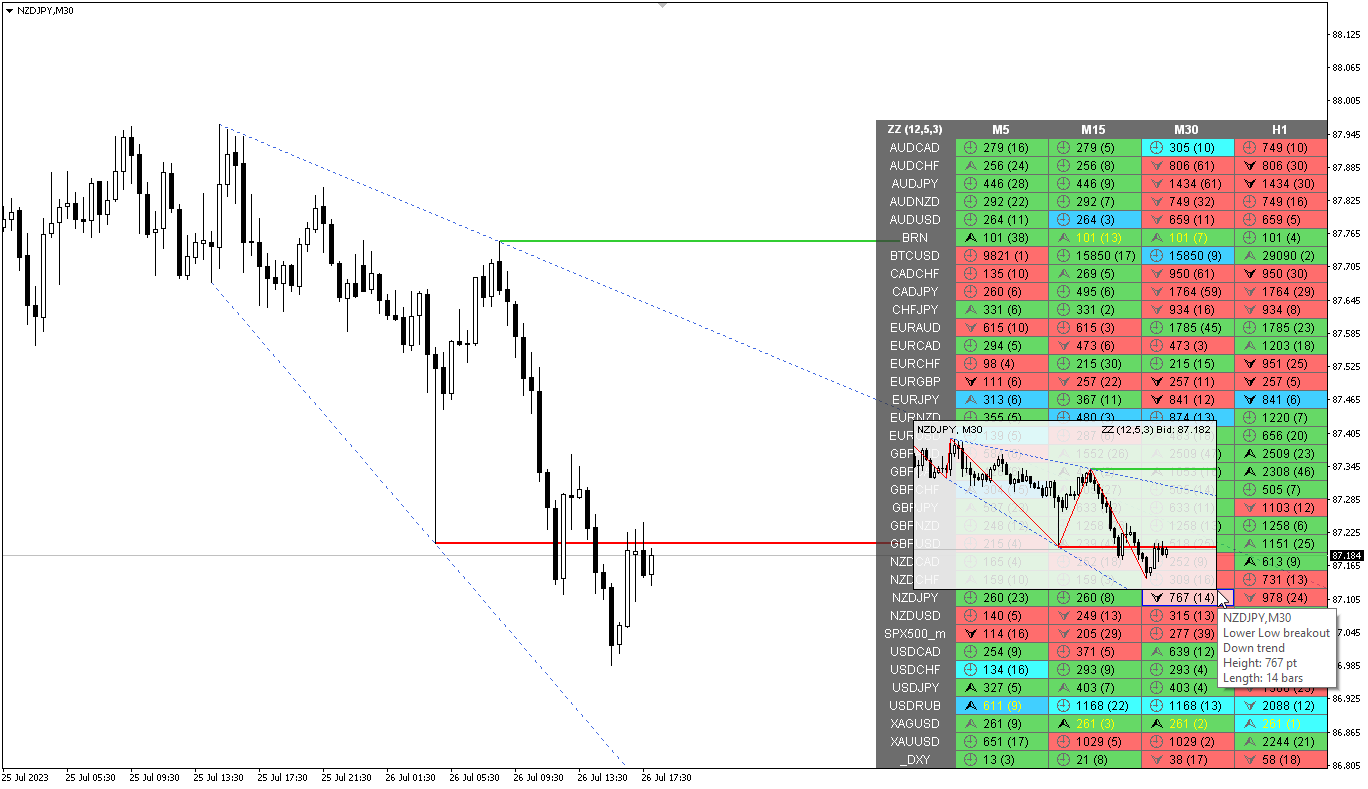
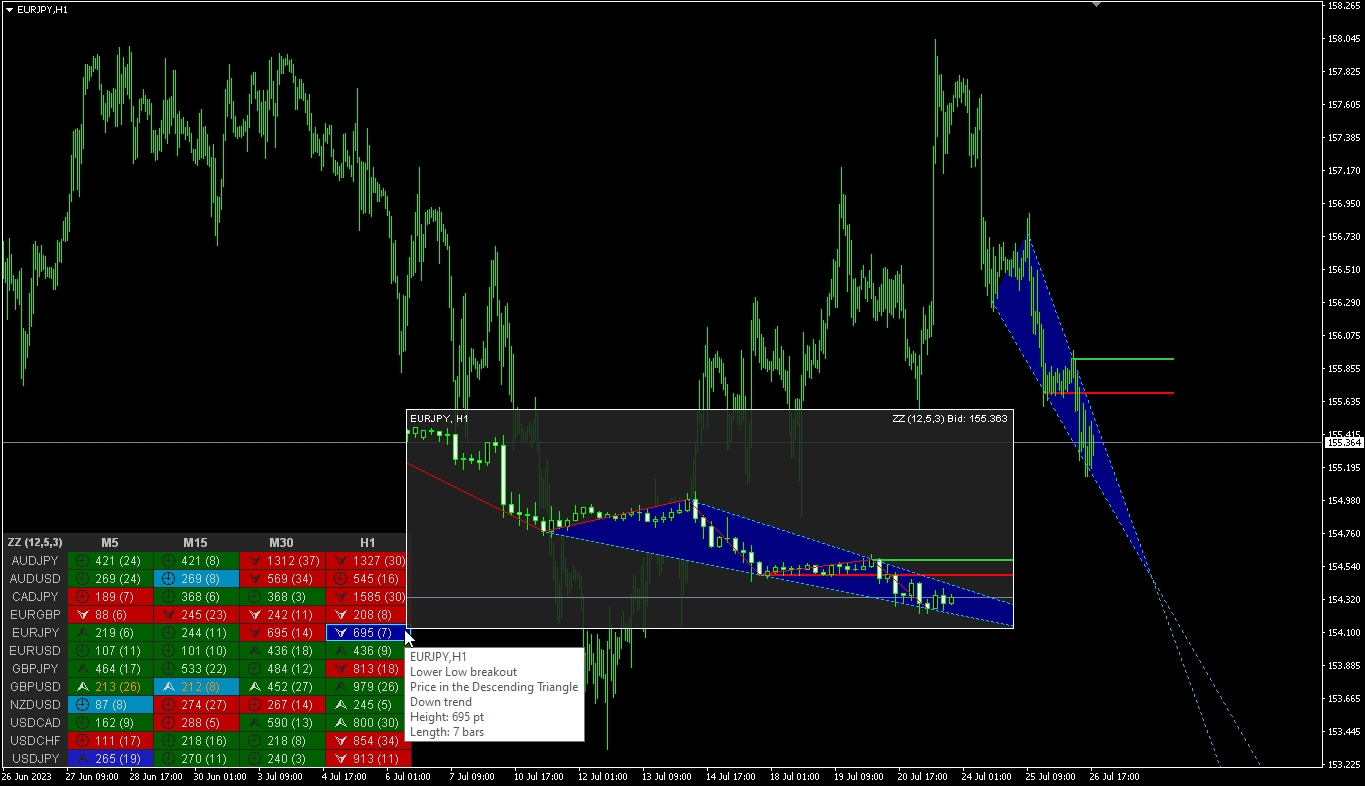
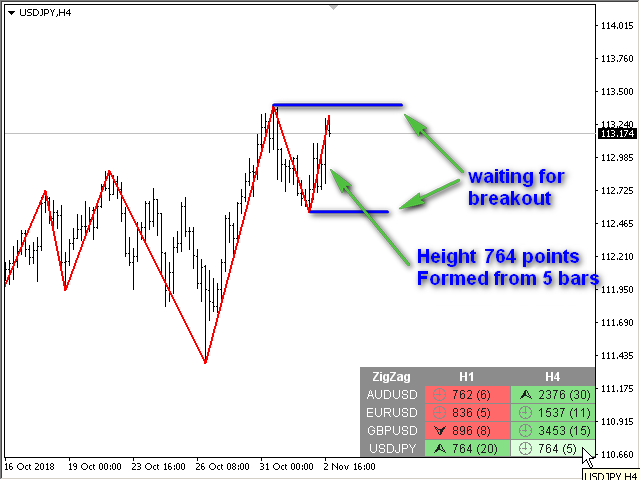
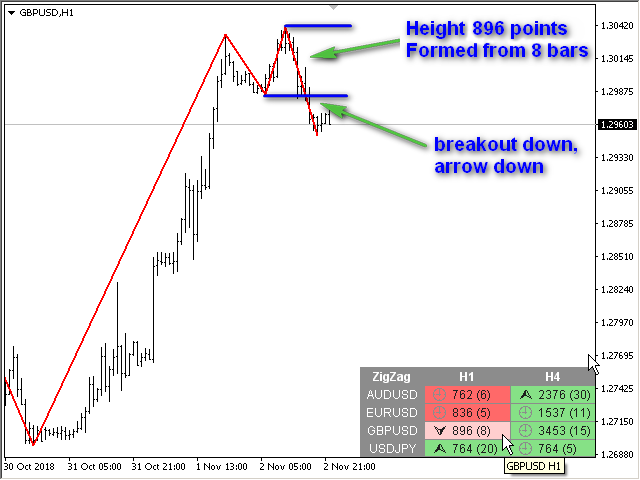
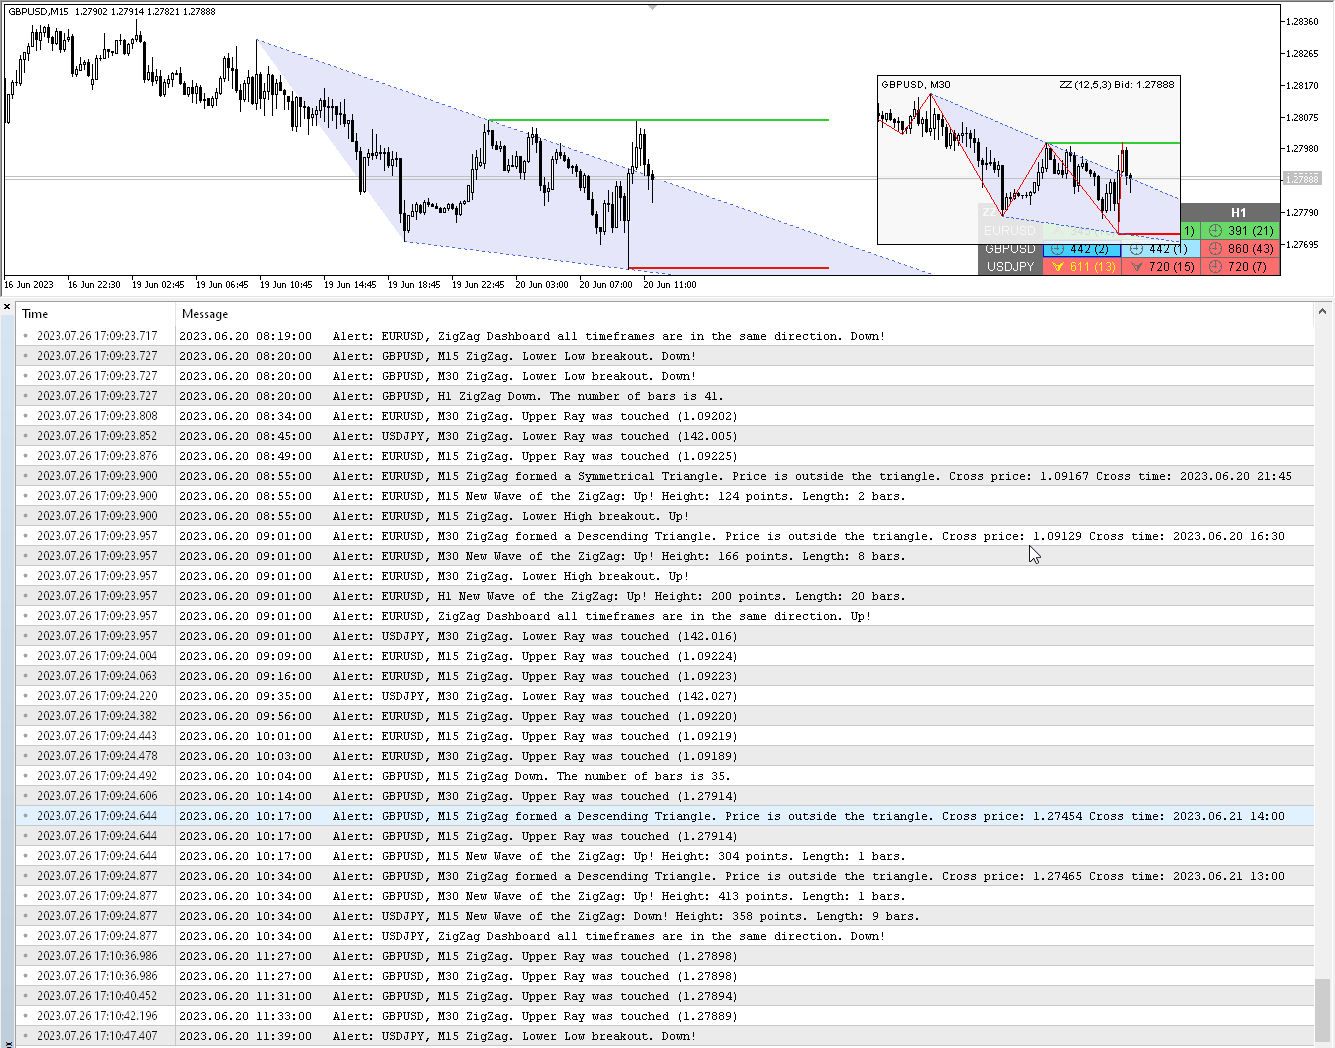
ZigZag göstergesinin çoklu para birimi ve çoklu zaman çerçevesi modifikasyonu. Piyasanın mevcut yönünü, son hareketin yüksekliğini, bu hareketteki çubuk sayısını ve ZigZag'ın önceki noktasının (yatay çizgi) kırılmasını görüntüler. Bu MTF Tarayıcıdır.
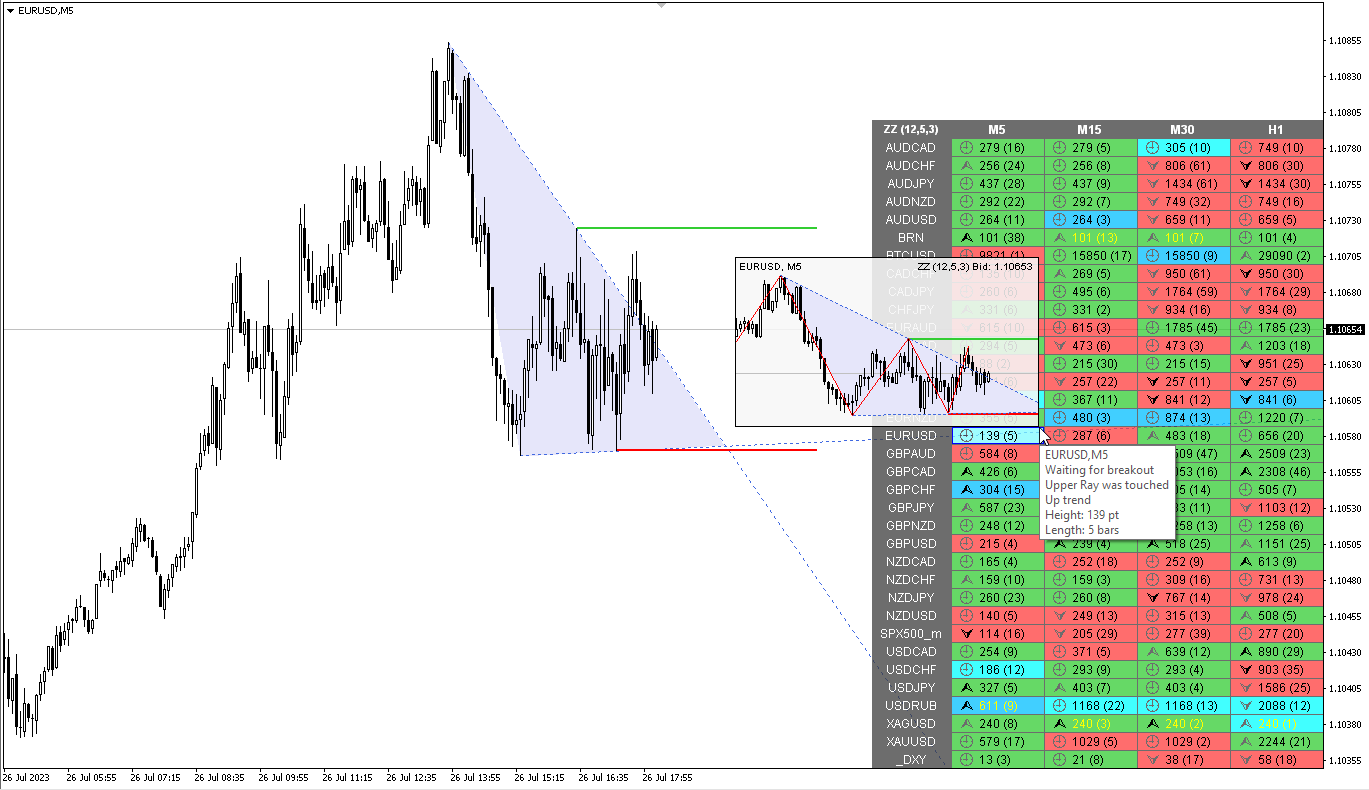
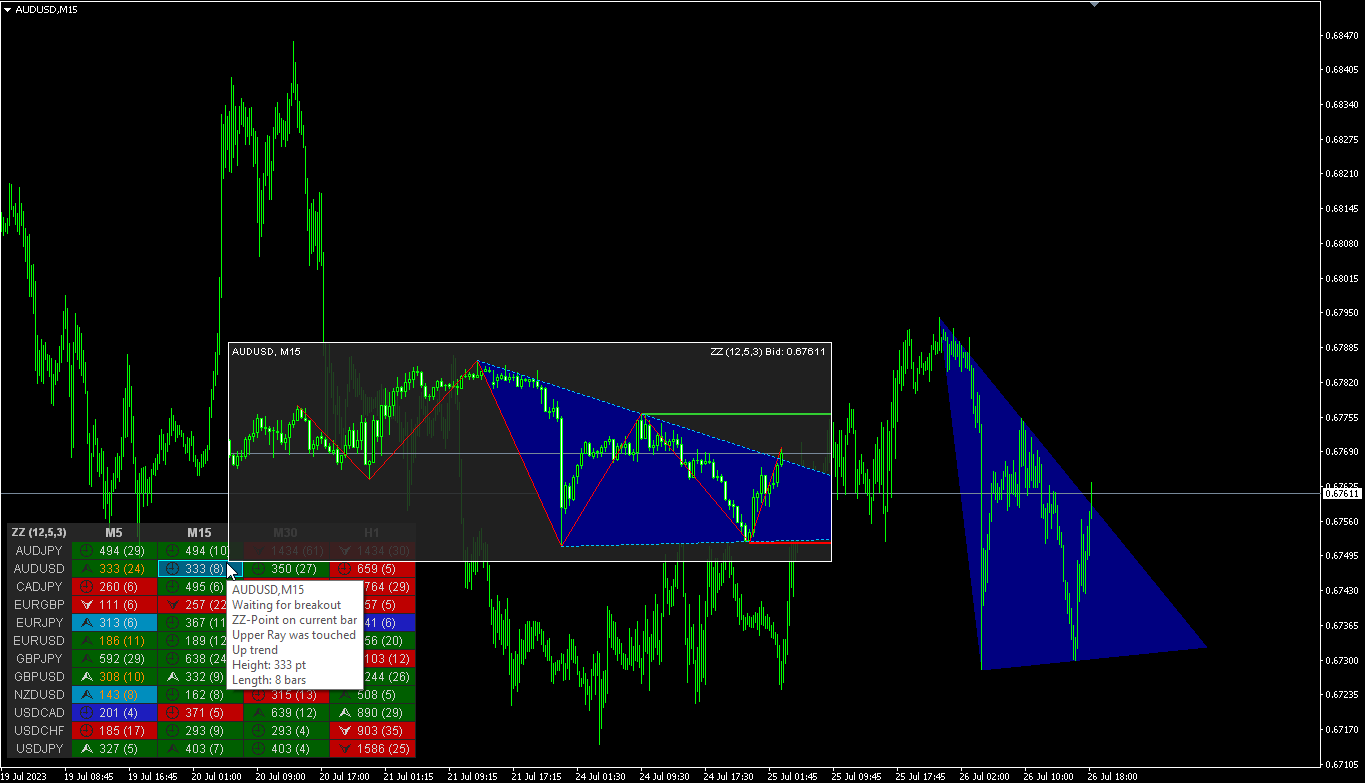
Parametrelerde istediğiniz para birimini ve zaman dilimlerini belirtebilirsiniz. Ayrıca panel, ZigZag yön değiştirdiğinde veya önceki noktada bir ilerleme olduğunda bildirim gönderebilir. Noktalı bir hücreye tıkladığınızda bu sembol ve nokta açılacaktır.
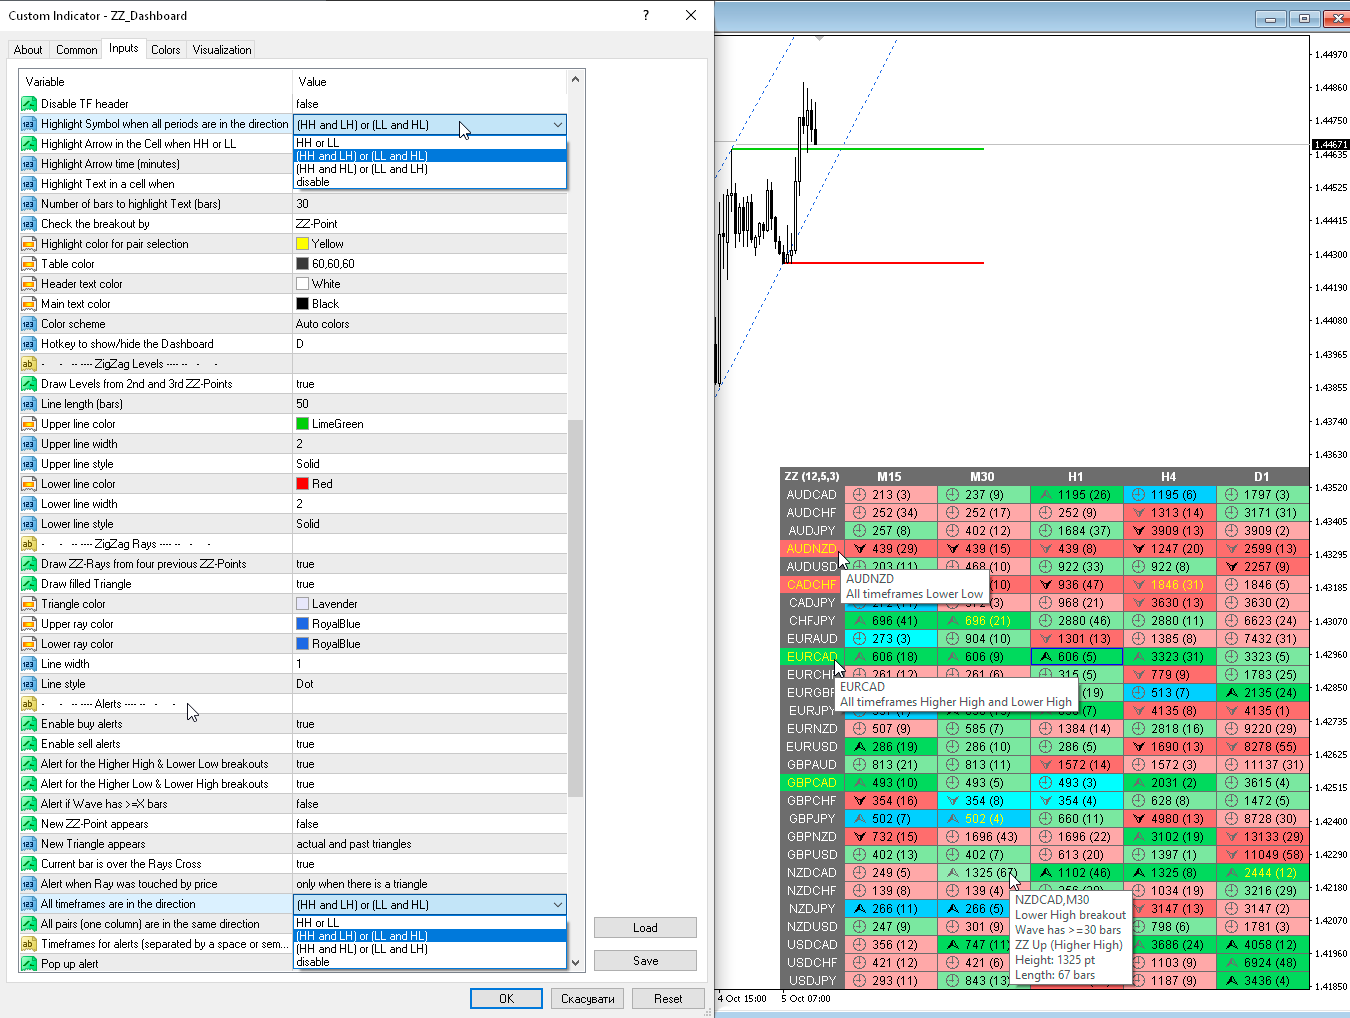
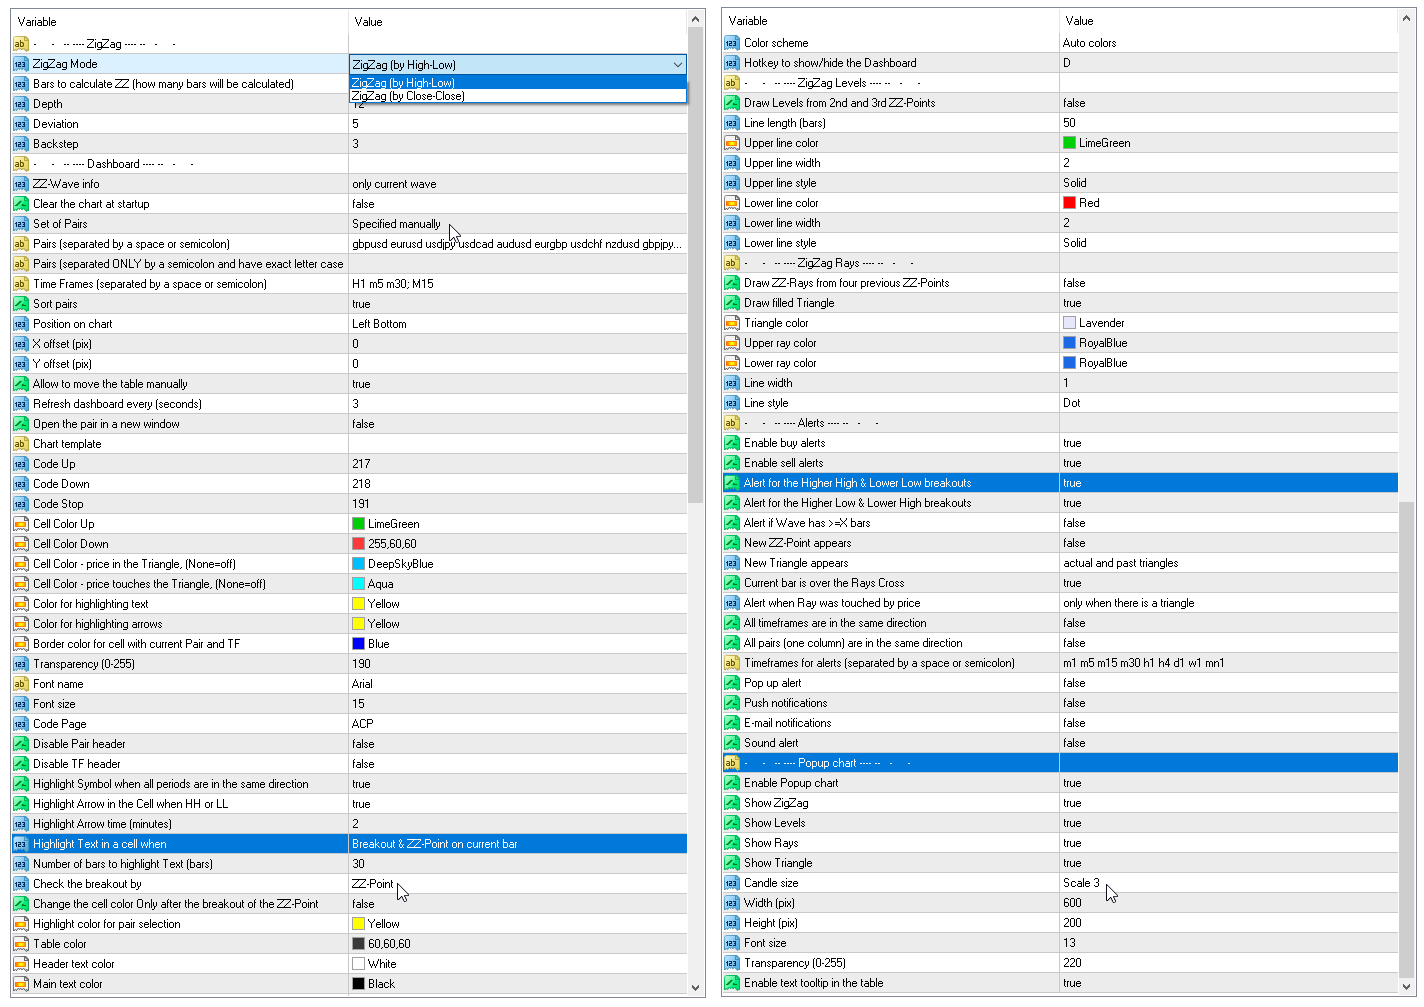
Parametreler
Depth — eğer sonuncusu öncekinden daha az (veya daha büyük) Sapma ise, Zigzag'ın ikinci maksimumu (veya minimumu) çekmeyeceği minimum mum çubuğu sayısı;
Deviation — Zigzag'ın yerel bir tepe/dip oluşturması için iki bitişik mum çubuğunun Yüksek/Düşük noktaları arasındaki minimum nokta sayısı;
Backstep — yerel Yüksekler/Düşükler arasındaki minimum mum çubuğu sayısı;
Bars to calculate ZZ — ZigZag noktalarını bulmak için geçmişteki çubukların sayısı;
ZZ-wave info — dalga hakkında hangi bilgilerin tabloda gösterileceği - yalnızca mevcut dalga veya mevcut + önceki dalga;
Highlight the symbol when all periods are in the same direction — Tüm periyotlar aynı yönde olduğunda sembolü vurgulayın;
Symbol highlight time (minutes, 0-all the time) — Sembol vurgulama süresi (dakika, 0-her zaman);
Highlight cells mode — Hücre modunu vurgula
— Wave has >=X bars — çubuk sayısının X'ten büyük veya X'e eşit olduğu hücreleri vurgulayın;— Breakout & ZZ-pt on current bar — önceki ZigZag noktası kırıldığında hücreleri vurgulayın (ZZ noktası geçerli çubuktadır);— ZZ-pt on current bar — geçerli çubukta bir ZZ noktası göründüğünde hücreleri vurgulayın. Yeni veya değişen dalga;— Price touched ZZ-Ray — fiyat ZigZag ışınına dokunduğunda hücreleri vurgular;— disable - hücre vurgulamayı devre dışı bırak;
Number of bars to highlight cells (bars) — hücreyi vurgulamak için ZigZag dalgasında kaç çubuk olması gerekir;
Clear the chart at startup — başlangıçta grafiği temizleyin.
Set of Pairs — semboller kümesi
— Market Watch — "Piyasa İzlemesi"nden eşlemeler. Çok fazla sembol kullanmayın; bu, göstergenin yavaşlamasına neden olabilir;— Specified manually — "Çiftler" parametrelerinde manüel olarak belirtilen çiftler;— Current pair — Mevcut çift;
Pairs (separated by a space or semicolon) — boşluk veya noktalı virgülle ayrılmış sembollerin listesi. Para birimi adları, büyük/küçük harf ve önek/sonek korunarak tam olarak komisyoncununki gibi yazılmalıdır.
Time Frames (separated by a space or semicolon) — boşluk veya noktalı virgülle ayrılmış zaman dilimlerinin listesi (çoklu zaman dilimi).
Sort pairs — çiftlerin listesini sıralama.
Position on chart — panelin grafikte görüntüleneceği köşe.
X offset (pix) — paneli X ekseni boyunca kaydırın;
Y offset (pix) — paneli Y ekseni boyunca kaydırın;
Refresh dashboard every (seconds) — tüm çiftler ve zaman dilimleri için güncelleme süresi.
Open the pair in a new window — tıklayarak yeni bir grafik penceresinde bir sembol açın.
Chart template — grafik yeni bir pencerede açılırsa, grafiğin şablonunun adı.
Color Up — gösterge artarsa hücre rengi.
Color Down — gösterge azalırsa hücre rengi.
Color Highlight — metin vurgulama rengi.
Transparency (0-255) — panelin şeffaflığı.
Font name — Yazı tipi adı.
Font size — Yazı Boyutu.
Uyarılar
Timeframes for alerts (separated by a space or semicolon) — uyarının gönderileceği dönemlerin listesi (boşluk veya noktalı virgülle ayrılmış olarak).
Alert if wave has >= X bars — ZigZag dalgasının X'ten büyük veya X'e eşit sayıda çubuğu varsa uyarı verin.
Alert for the Higher High & Lower Low breakouts — önceki HH veya LL kırılırsa uyarı verir.
Alert for the Higher Low & Lower High breakouts — önceki HL veya LH kırılırsa uyarı verir.
New ZZ-Point appears — yeni bir ZigZag noktası belirirse uyarı verir.
New Triangle appears — Yeni Üçgen belirir.
Current bar is over the Rays Cross — Mevcut çubuk Rays Cross'un üzerindedir.
Alert when Ray was touched by price — Ray fiyattan etkilendiğinde uyarı verdi.
All timeframes are in the same direction — Tüm zaman dilimleri aynı yöndedir.
All pairs (one column) are in the same direction — Tüm çiftler (bir sütun) aynı yöndedir.
All timeframes are in the same direction — Tüm zaman dilimleri aynı yöndedir; tüm zaman dilimleri aynı yönde olduğunda uyarı verir.
All pairs (one column) are in the same direction — Tüm çiftler (bir sütun) aynı yöndedir.
Pop up alert — Açılan uyarı.
Push notifications — Push bildirimleri.
E-mail notifications — E-posta Bildirimleri.
Sound alert — Ses Alarmi.


Найкращий розробник, з найкращими продуктами в маркеті