ZigZag Dashboard for MT4
- Indicadores
- Taras Slobodyanik
- Versão: 4.70
- Atualizado: 14 março 2024
- Ativações: 10
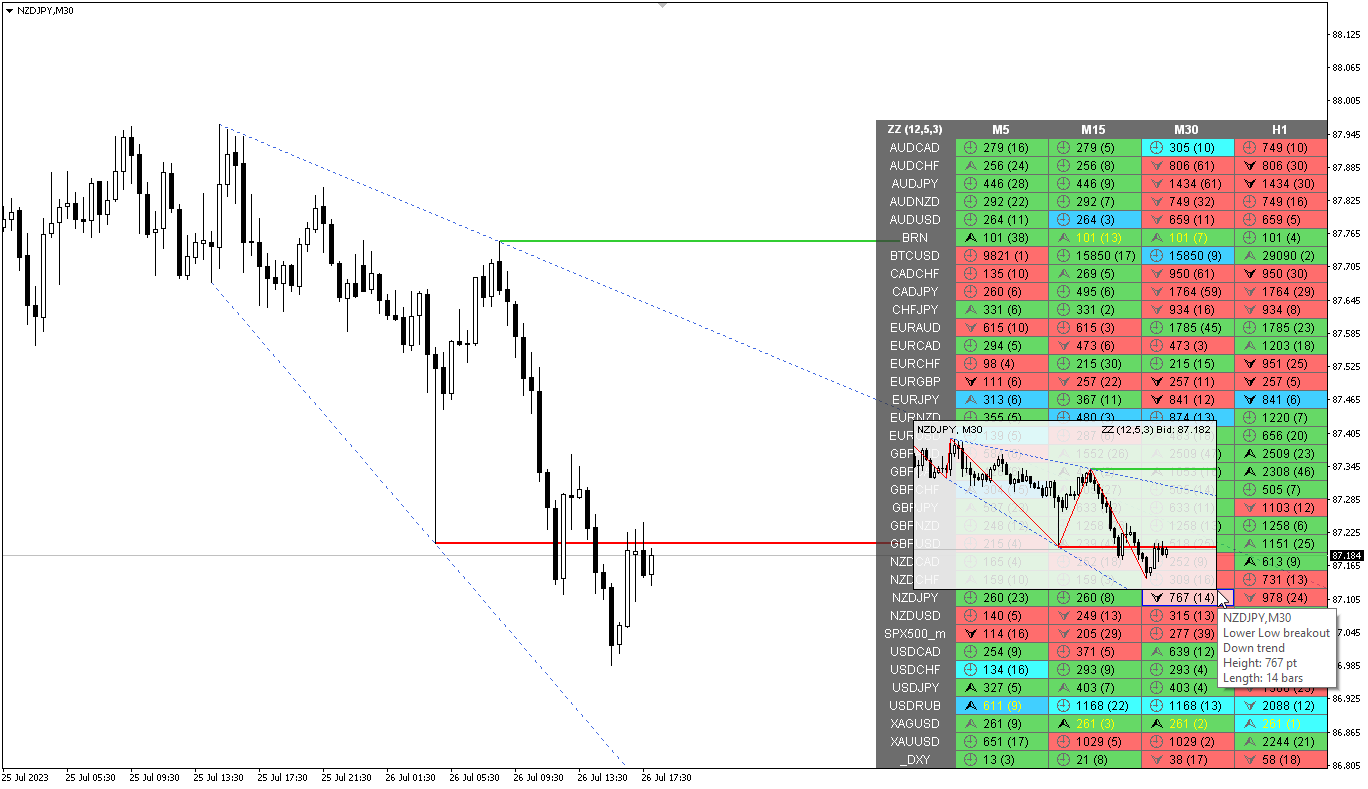
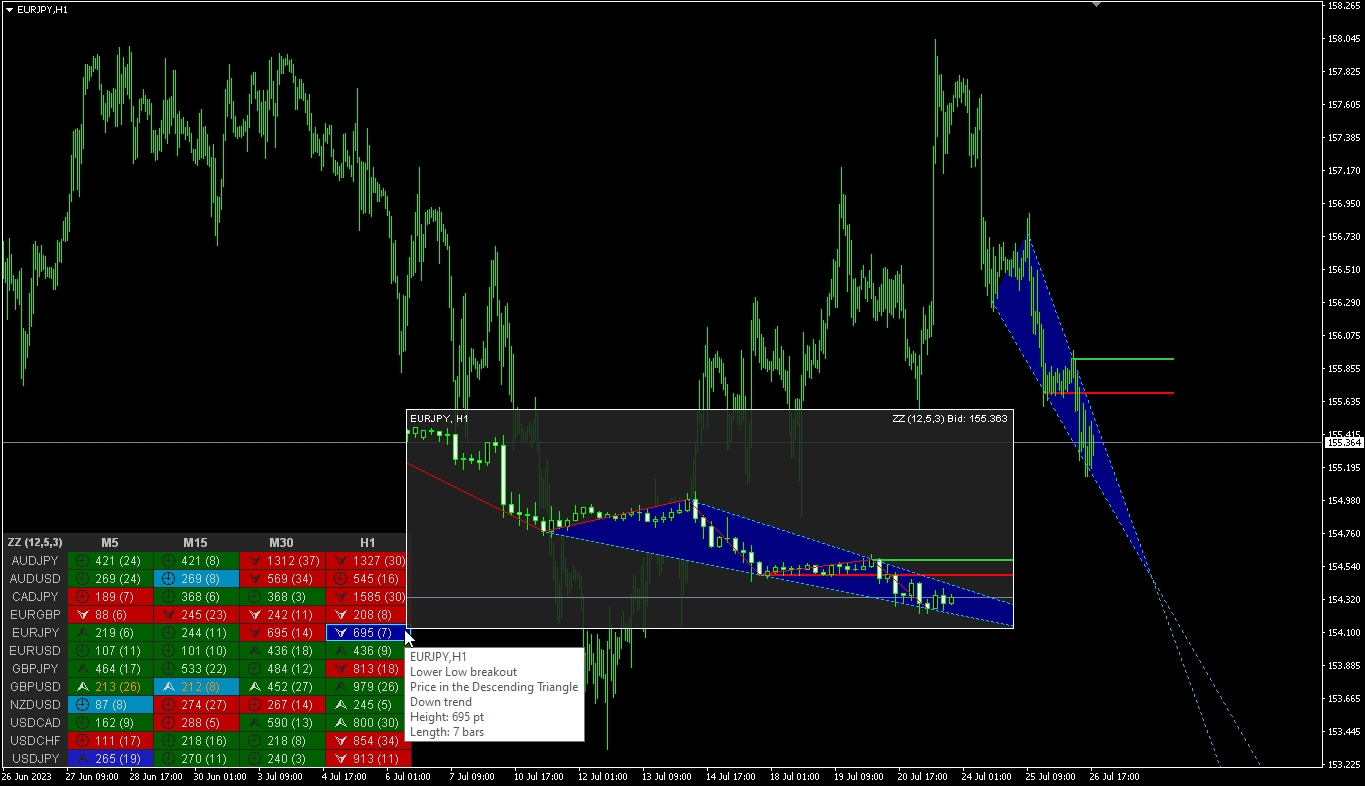
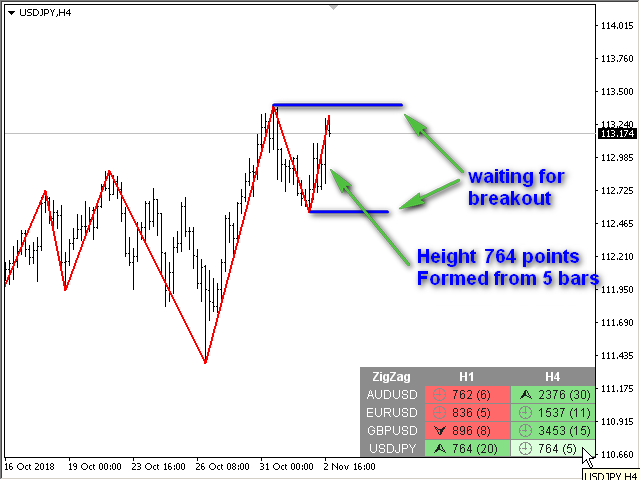
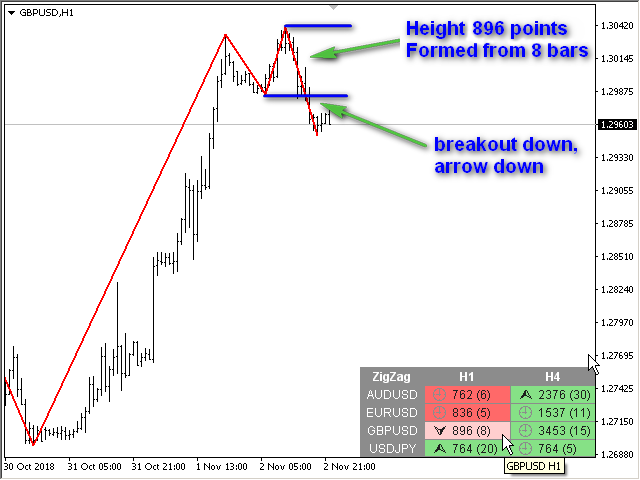
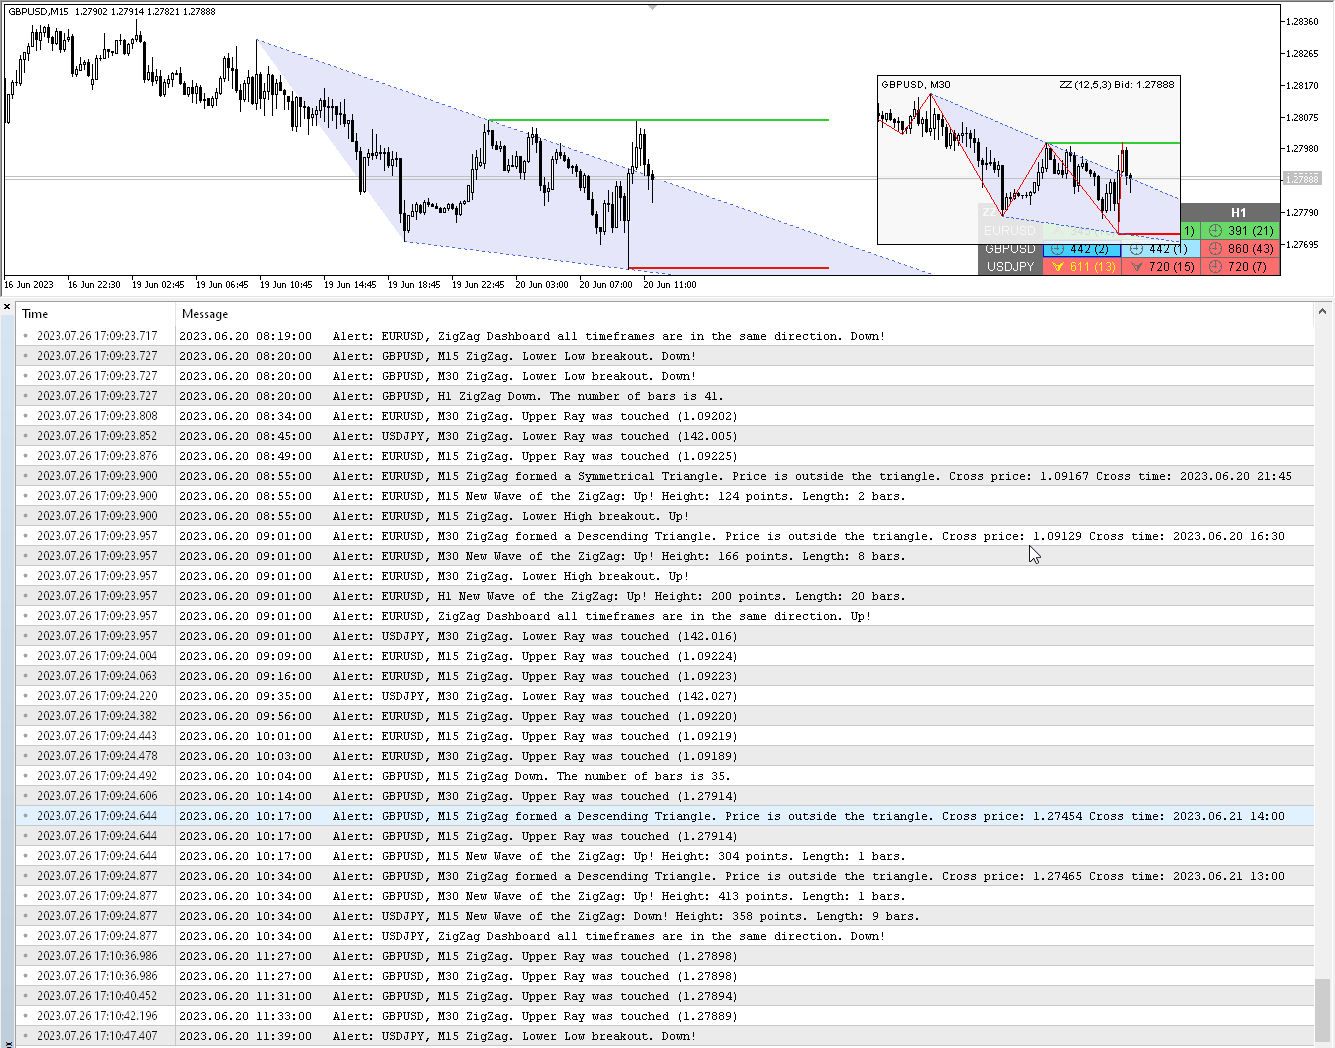
Modificação multimoeda e multitimeframe do indicador ZigZag. Exibe a direção atual do mercado, a altura do último movimento, o número de barras neste movimento e a quebra do ponto anterior do ZigZag (linha horizontal). Este é o scanner MTF.
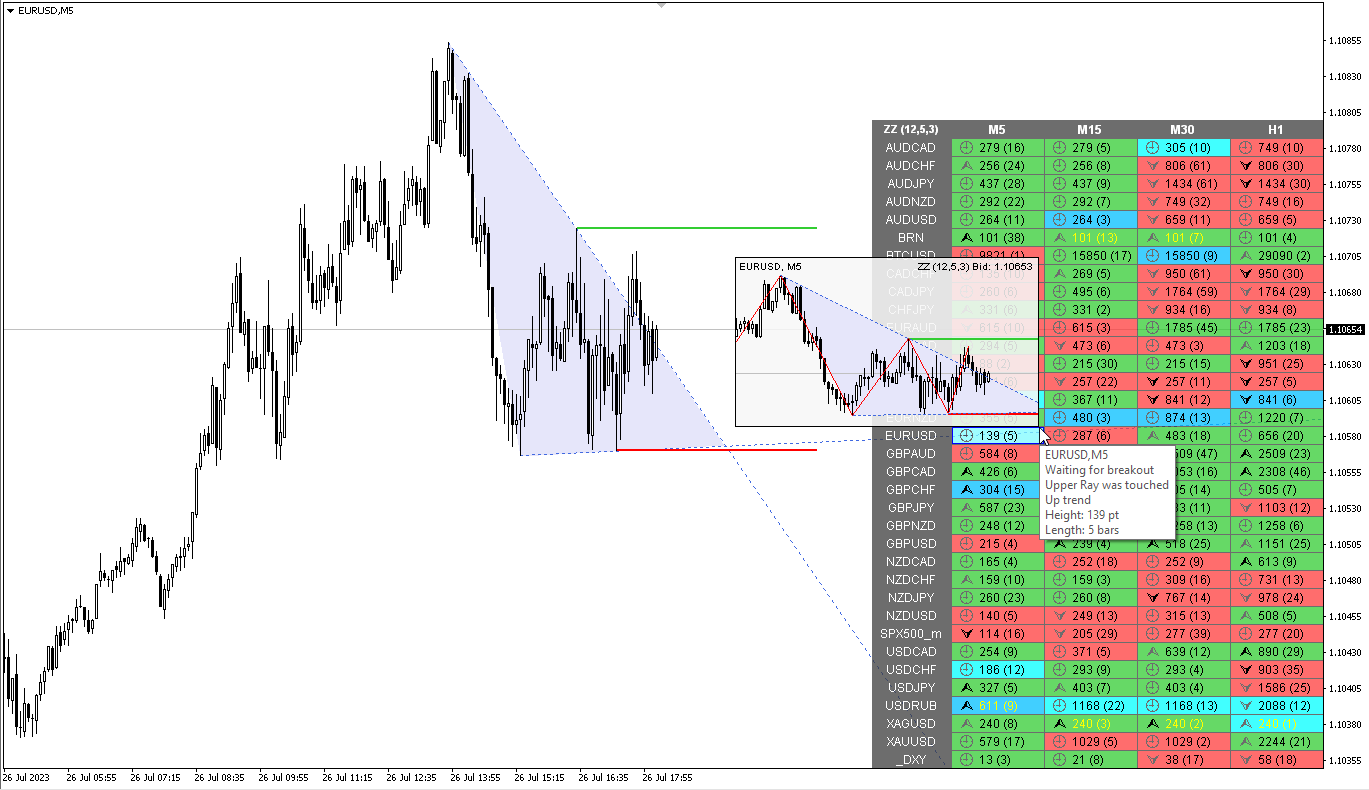
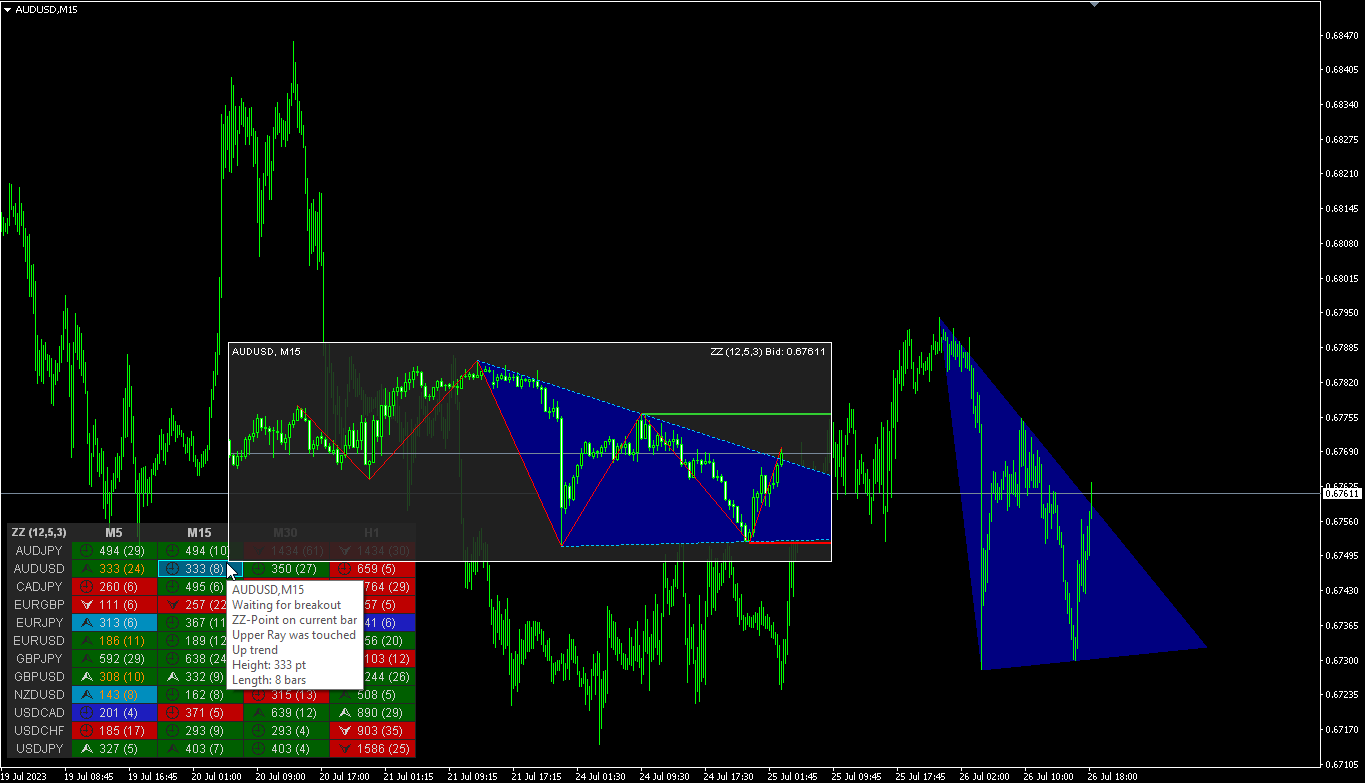
Você pode especificar quaisquer moedas e prazos desejados nos parâmetros. Além disso, o painel pode enviar notificações quando o ZigZag mudar de direção ou quando houver um rompimento do ponto anterior. Ao clicar em uma célula com ponto final, este símbolo e ponto final serão abertos.
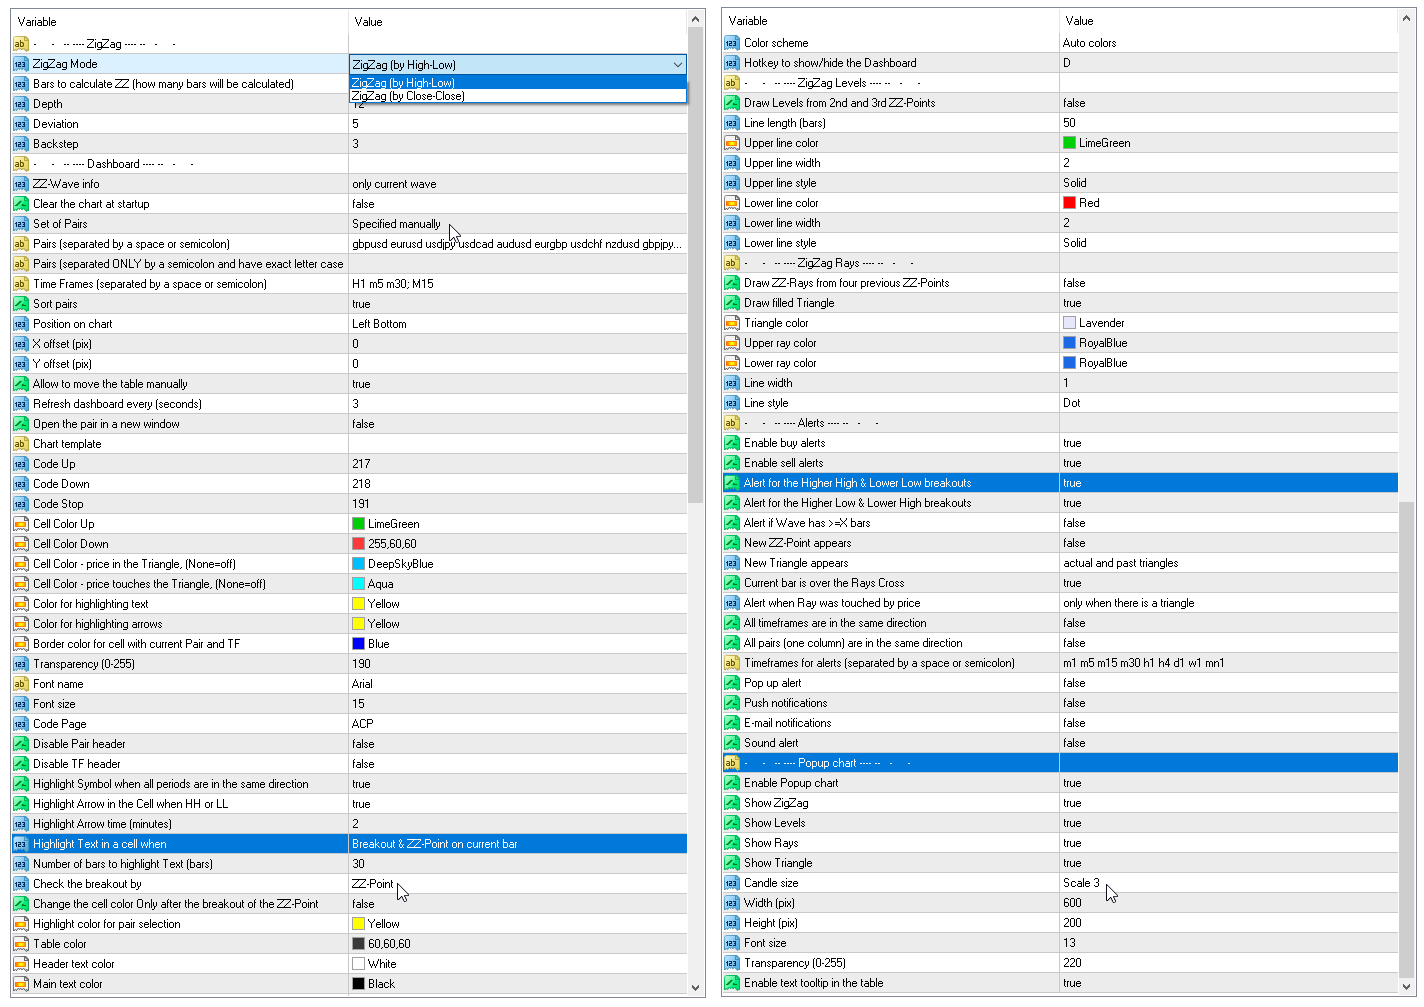
Parâmetros
Depth — número mínimo de velas, para as quais o Zigzag não sorteará o segundo máximo (ou mínimo), se o último for Desvio menor (ou maior) que o anterior;
Deviation — o número mínimo de pontos entre os Máximos/Mínimos de duas velas adjacentes para que o Ziguezague forme um topo/fundo local;
Backstep — o número mínimo de velas entre os máximos/mínimos locais;
Bars to calculate ZZ — o número de barras no histórico para encontrar pontos ZigZag;
ZZ-wave info — quais informações sobre a onda, mostrar na tabela — apenas a onda atual ou a atual + anterior;
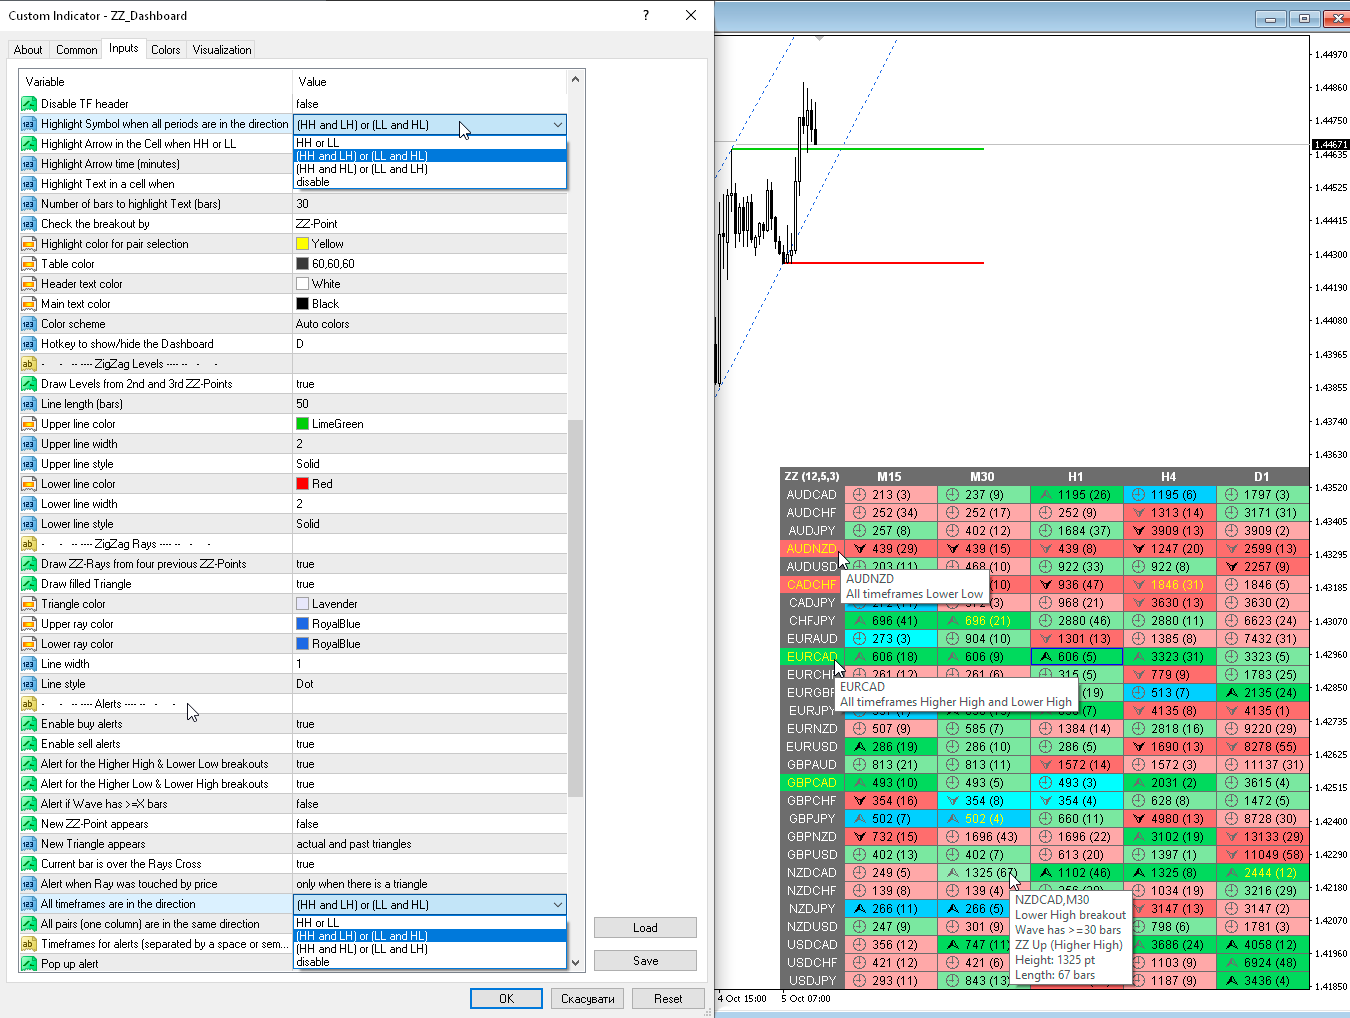
Highlight the symbol when all periods are in the same direction — Destaque o símbolo quando todos os períodos estiverem na mesma direção;
Symbol highlight time (minutes, 0-all the time) — Tempo de destaque do símbolo (minutos, 0-o tempo todo);
Highlight cells mode — Modo de destaque de células
— Wave has >=X bars — destaca células em que o número de barras é maior ou igual a X;— Breakout & ZZ-pt on current bar — estaca células quando o ponto ZigZag anterior é quebrado (o ponto ZZ está na barra atual);— ZZ-pt on current bar — destaca células quando um ponto ZZ aparece na barra atual. A onda nova ou alterada;— Price touched ZZ-Ray — destaca as células quando o raio ZigZag é tocado pelo preço;— disable - desabilita o destaque da célula;
Number of bars to highlight cells (bars) — quantas barras devem existir na onda ZigZag para destacar a célula;
Clear the chart at startup — limpe o gráfico na inicialização.
Set of Pairs — conjunto de símbolos
— Market Watch — pares do "Market Watch". Não use muitos símbolos, isso pode fazer com que o indicador fique lento;— Specified manually — pares especificados manualmente, nos parâmetros “Pares”;— Current pair — Par atual;
Pairs (separated by a space or semicolon) — lista de símbolos separados por espaço ou ponto e vírgula. Os nomes das moedas devem ser escritos exatamente como os da corretora, mantendo a caixa e o prefixo/sufixo.
Time Frames (separated by a space or semicolon) — lista de prazos separados por espaços ou ponto e vírgula (vários prazos).
Sort pairs — classificando a lista de pares.
Position on chart — canto para exibir o painel no gráfico.
X offset (pix) — desloca o painel ao longo do eixo X;
Y offset (pix) — desloca o painel ao longo do eixo Y;
Refresh dashboard every (seconds) — período de atualização para todos os pares e intervalos de tempo.
Open the pair in a new window — abra um símbolo em uma nova janela do gráfico clicando.
Chart template — o nome do modelo do gráfico, se o gráfico for aberto em uma nova janela.
Color Up — cor da célula se o indicador aumentar.
Color Down — cor da célula se o indicador diminuir.
Color Highlight — cor de destaque do texto.
Transparency (0-255) — transparência do painel.
Font name — Nome da fonte.
Font size — Tamanho da fonte.
Alertas
Timeframes for alerts (separated by a space or semicolon) — lista de períodos para os quais o alerta será enviado (separados por espaço ou ponto e vírgula).
Alert if wave has >= X bars — alerta se a onda ZigZag tiver um número de barras maior ou igual a X.
Alert for the Higher High & Lower Low breakouts — alerta se o HH ou LL anterior estiver quebrado.
Alert for the Higher Low & Lower High breakouts — alerta se o HL ou LH anterior for rompido.
New ZZ-Point appears — alerta se um novo ponto ZigZag aparecer.
New Triangle appears — Novo Triângulo aparece.
Current bar is over the Rays Cross — A barra atual está acima do Rays Cross.
Alert when Ray was touched by price — Alerta quando Ray foi tocado pelo preço.
All timeframes are in the same direction — Todos os prazos estão na mesma direção.
All pairs (one column) are in the same direction — Todos os pares (uma coluna) estão na mesma direção.
All timeframes are in the same direction — Todos os prazos estão na mesma direção – alerta quando todos os prazos estão na mesma direção.
All pairs (one column) are in the same direction — Todos os pares (uma coluna) estão na mesma direção.
Pop up alert — Alerta pop-up.
Push notifications — Notificações via push.
E-mail notifications — Notificações por e-mail.
Sound alert — Alerta sonoro.


Найкращий розробник, з найкращими продуктами в маркеті