AIS Volatility Meter MT5
- Göstergeler
- Aleksej Poljakov
- Sürüm: 1.0
- Etkinleştirmeler: 5
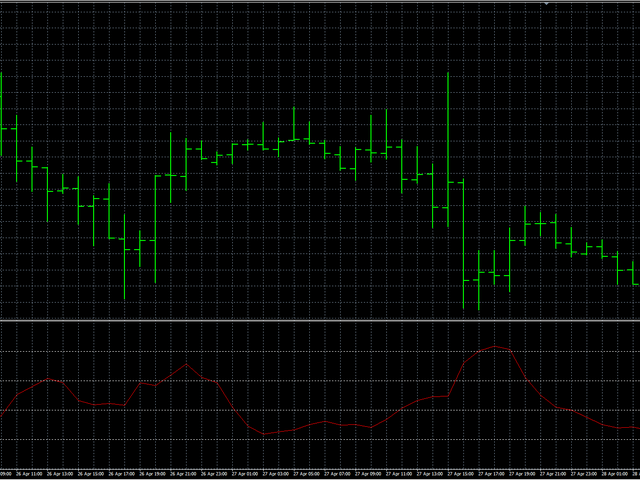
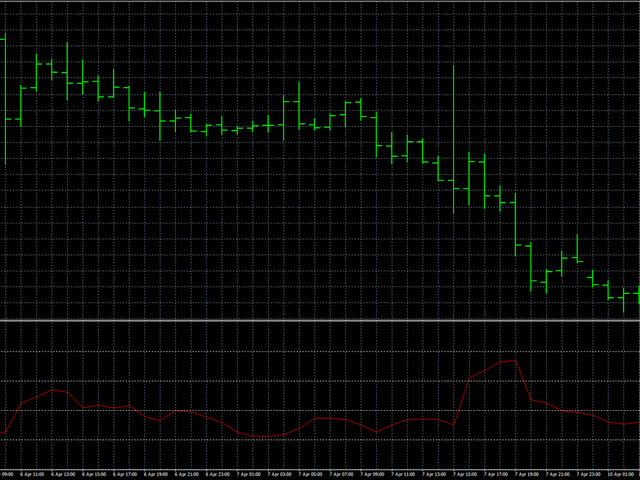
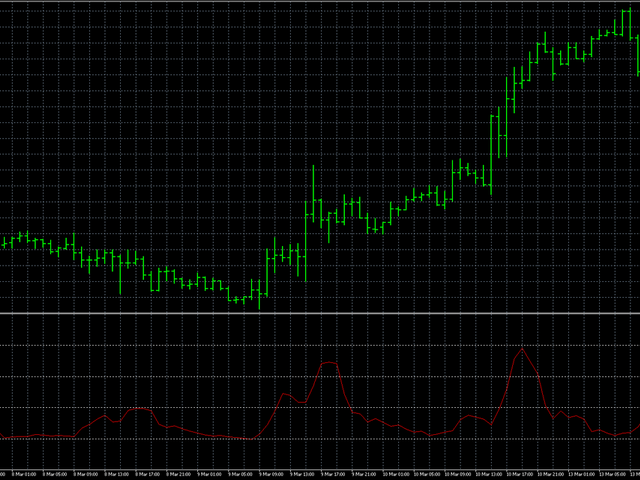
The indicator is designed to measure the price volatility. This allows determining the moments for opening or closing trade positions more accurately.
High intensity of the market indicates the instability of its movement, but allows for better results. And, conversely, low intensity of the market indicates the stability of its movement.
Parameters
- Bars to process - the number of bars to measure the price movements. A low value of this parameter allows determining the moments of rapid price movement. A high value allows obtaining a more smoothed value and tracking the periodic price movements.


Kullanıcı incelemeye herhangi bir yorum bırakmadı