Boring Candle

Boring & Explosive Supply/Demand Zones

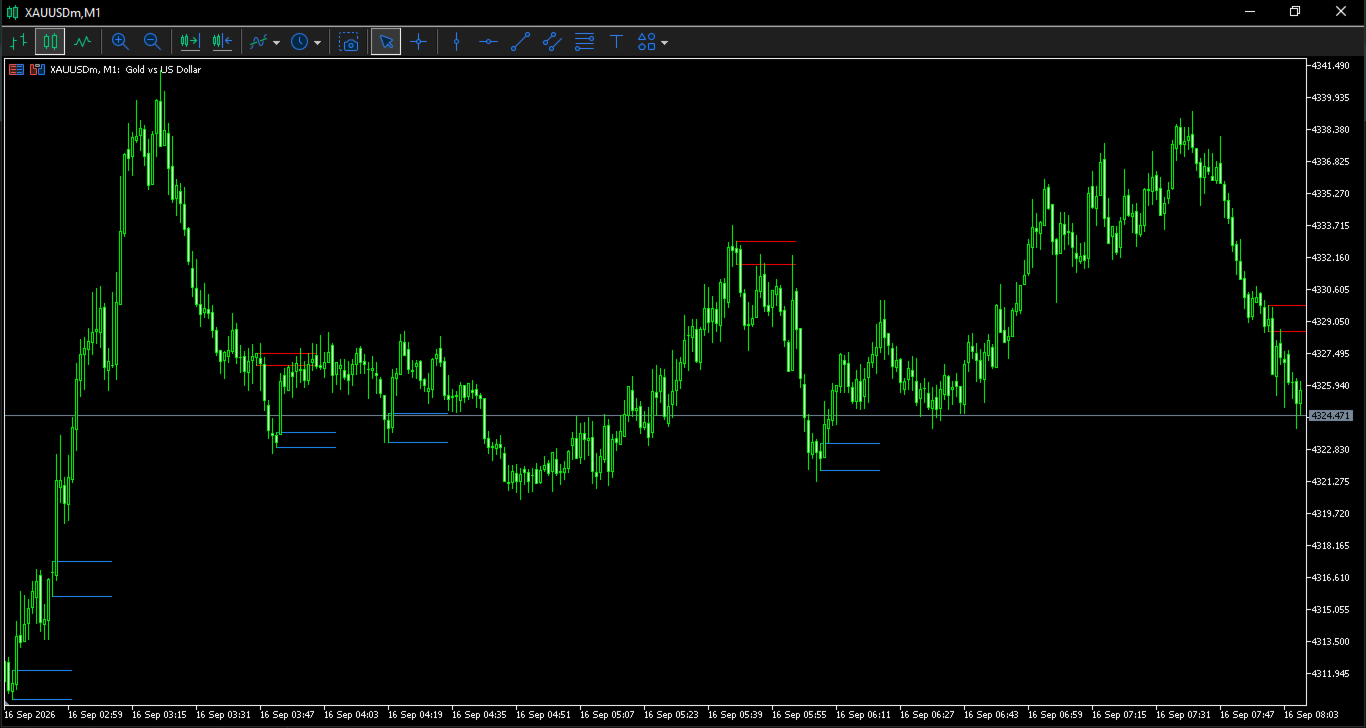
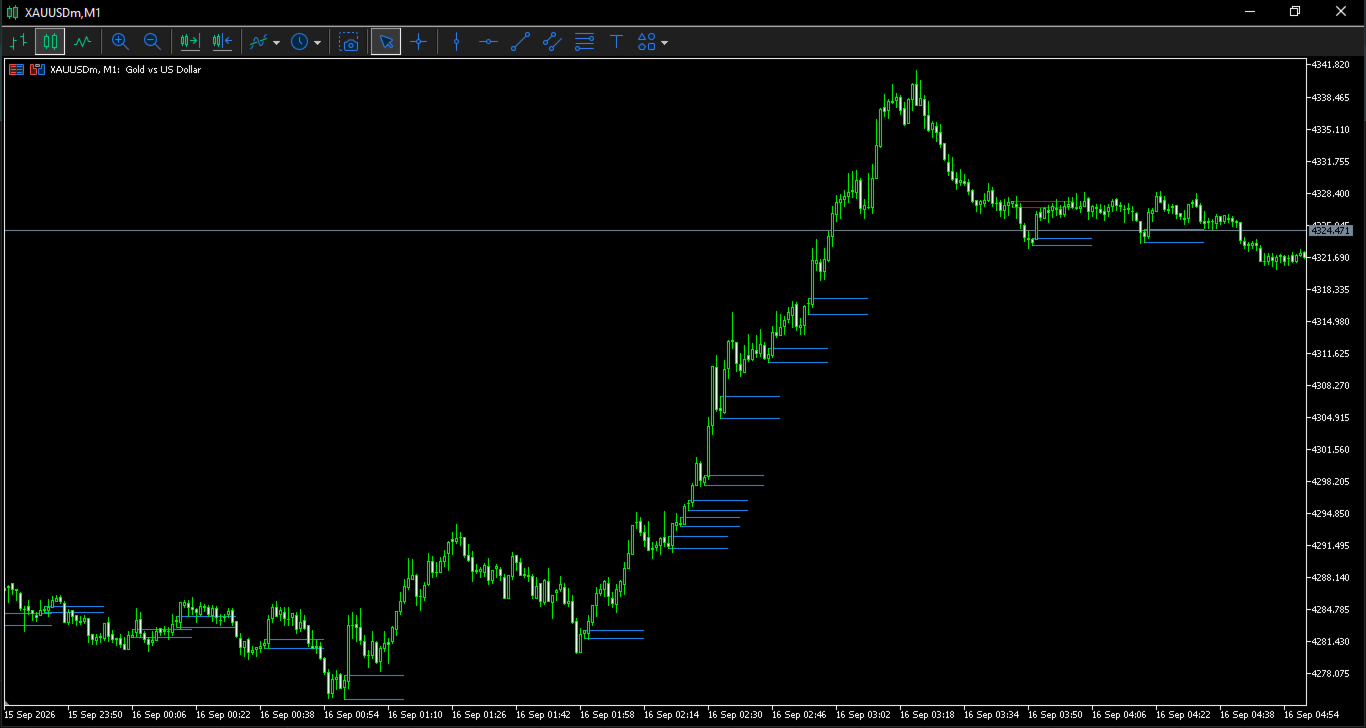
This indicator automatically detects and marks small, precise supply and demand zones directly on your chart, based on a simple but powerful price-action pattern: a "boring" candle (a candle with more wick than body) followed by an "explosive" candle (a candle whose range is significantly larger than the boring candle's range).

This combination often marks the exact point where price paused, absorbed orders, and then broke out sharply — a classic footprint of institutional supply or demand. Because zones are drawn from a single boring candle rather than a wide consolidation, they are tighter and more precise than typical supply/demand indicators, making them well suited for scalping and short-term entries.

How it works

  • Scans historical bars for a boring candle immediately followed by an explosive candle.
  • If the explosive candle closes bullish, the boring candle's high/low is marked as a Demand zone.
  • If the explosive candle closes bearish, it's marked as a Supply zone.
  • Zones are drawn as two horizontal trend lines (top and bottom of the zone) in your chosen colors.
  • Zones are automatically deleted once price trades back through and fills them, keeping your chart clean and only showing active, untested zones.

Inputs

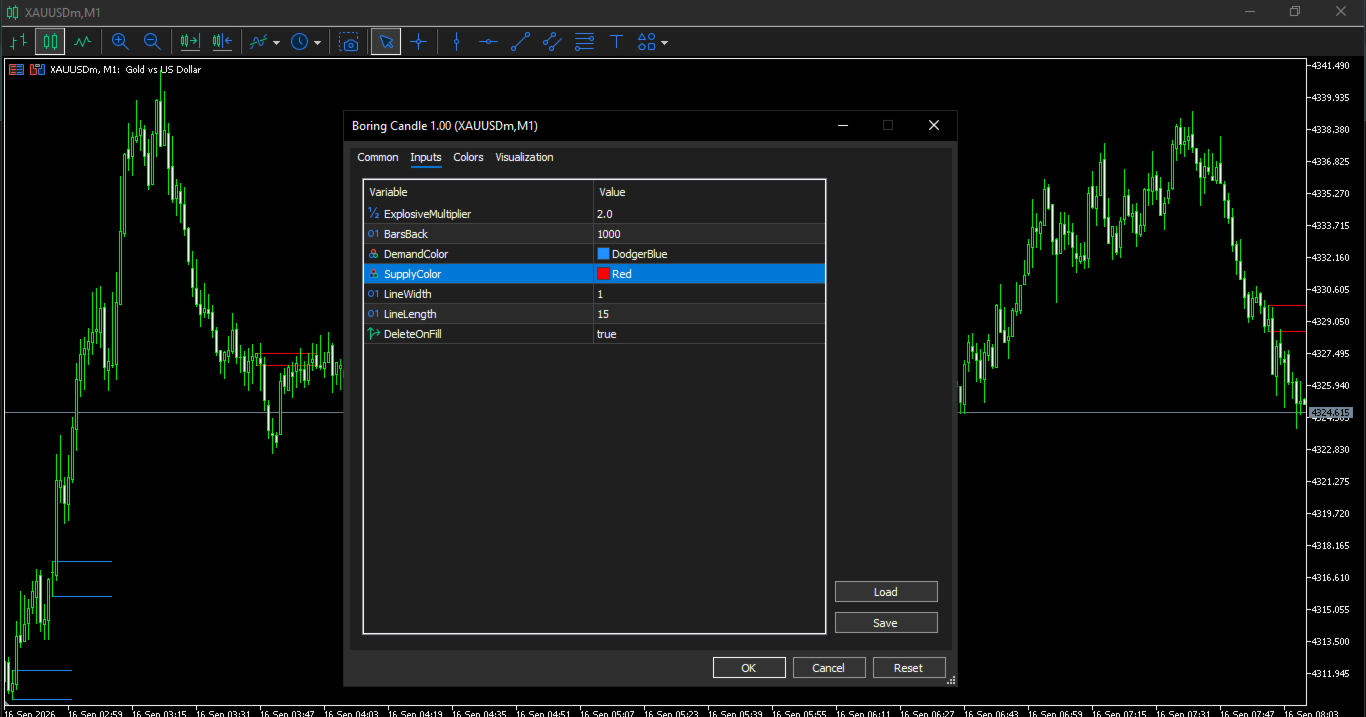
  • ExplosiveMultiplier – how many times larger the explosive candle's range must be compared to the boring candle's range (default: 2).
  • BarsBack – how many historical bars to scan for zones (default: 500).
  • DemandColor / SupplyColor – colors for demand and supply zone lines.
  • LineWidth – thickness of the zone lines.
  • LineLength – how far the zone lines extend to the right (in bars).
  • DeleteOnFill – automatically remove a zone once price closes through it.
Yazarın diğer ürünleri
IFVG Auto-RR Engine — Inversion Fair Value Gap Entry & Risk Dashboard IFVG Auto-RR Engine detects Inversion Fair Value Gaps (IFVG) directly on the chart and turns them into structured, risk-managed trade setups — complete with entry, stop loss, take profit, and a live performance dashboard. Core Features Automatic IFVG Detection — Identifies fair value gaps that have been broken and inverted, tracking them as potential reversal zones with configurable memory, age limits, and minimum size filters
FREE
ATR Fib Trailer
Mikiyas Berhe Birhane
ATR Fib Trailer — ATR Trailing Stop with Fibonacci Retracement Zones ATR Fib Trailer combines a volatility-adjusted trailing stop with Fibonacci retracement bands, giving you both a clear trend-following stop level and visual zones for potential entries, exits, or profit-taking. How it works The indicator calculates a Chandelier-style trailing stop using the Average True Range (ATR), smoothed with Wilder's method. As price trends, the stop line tightens toward price on pullbacks and only flips d
FREE
Range Filter MTF — Multi-Symbol, Multi-Timeframe Range Filter Range Filter MTF brings the classic Range Filter trend/volatility indicator to any symbol and any timeframe, independent of the chart you're viewing it on. The Range Filter plots a smoothed, adaptive line that hugs price during trends and stays flat during consolidation, changing color (green/red) whenever the underlying trend shifts. It's a favorite for spotting trend direction, filtering noise, and timing entries/exits without repai
FREE
Multi-Symbol Fair Value Gap (FVG) Detector This indicator automatically detects and draws Fair Value Gaps (3-bar imbalance zones) on your chart — and unlike most FVG tools, it can source those gaps from a completely different symbol and timeframe than the one you're currently viewing. What it does A Fair Value Gap occurs when price moves so fast that a 3-candle imbalance forms — the low of one candle doesn't overlap with the high of the candle two bars earlier (or vice versa for bearish gaps). T
FREE
HeikenAshi Smoothed Pro — Multi-Symbol A smoothed Heiken Ashi indicator with the ability to source its candles from any symbol and timeframe — not just the chart you have open. Key Features: Double smoothing — applies two configurable moving averages (SMA, EMA, SMMA, or LWMA) in sequence to the OHLC data before building Heiken Ashi candles, producing a cleaner, less noisy trend picture than standard Heiken Ashi. Multi-symbol / multi-timeframe sourcing — display Heiken Ashi candles calculated fro
FREE
Trading Sessions Open/Close + Dashboard Visualize the world's major Forex trading sessions directly on your chart — Asia, London, New York, and NYSE — with colored session boxes and an interactive on-chart dashboard. Key Features: Four Major Sessions — Asia, London (Europe), New York, and NYSE, each fully customizable Interactive Dashboard — Clickable ON/OFF buttons let you toggle any session's visibility directly from the chart, no need to dig into settings Automatic Broker Time Alignment — Det
FREE
MTF SuperTrend AutoSync MTF SuperTrend AutoSync plots the classic SuperTrend indicator calculated from a higher (or any chosen) timeframe, while displaying it seamlessly on your current chart — no manual switching between timeframes required. Unlike a standard SuperTrend, this version pulls its ATR, high, and low data directly from the timeframe you select in the settings, then automatically syncs and redraws it bar-by-bar on your active chart. This lets you see the bigger-picture trend structur
FREE
RR Tool — Visual Risk/Reward Backtesting Assistant Backtest your risk/reward ideas manually, right on the chart, without opening a spreadsheet. RR Tool lets you draw risk and reward zones onto historical price action, automatically checks whether each setup would have hit take-profit or stop-loss, and tracks a simulated equity curve so you can see how your strategy would have performed over time. Key Features: Fast manual backtesting — Scroll back through history, press L or S , and click to dro
MTF SuperTrend – Multi-Symbol & Multi-Timeframe A non-repainting SuperTrend indicator that lets you plot the trend of any symbol and any timeframe on your current chart — for example, view the Daily SuperTrend of XAUUSD while trading on a 15-minute EURUSD chart. Key Features Multi-Symbol / Multi-Timeframe sourcing — calculate SuperTrend from a different symbol and/or timeframe than the one you're viewing, and have it accurately mapped onto your current chart. No repainting, no drift — uses a str
FREE
Filtrele:
Değerlendirme yok
Değerlendirmeye yanıt