Boring Candle
- 지표
- 버전: 1.0

Boring & Explosive Supply/Demand Zones
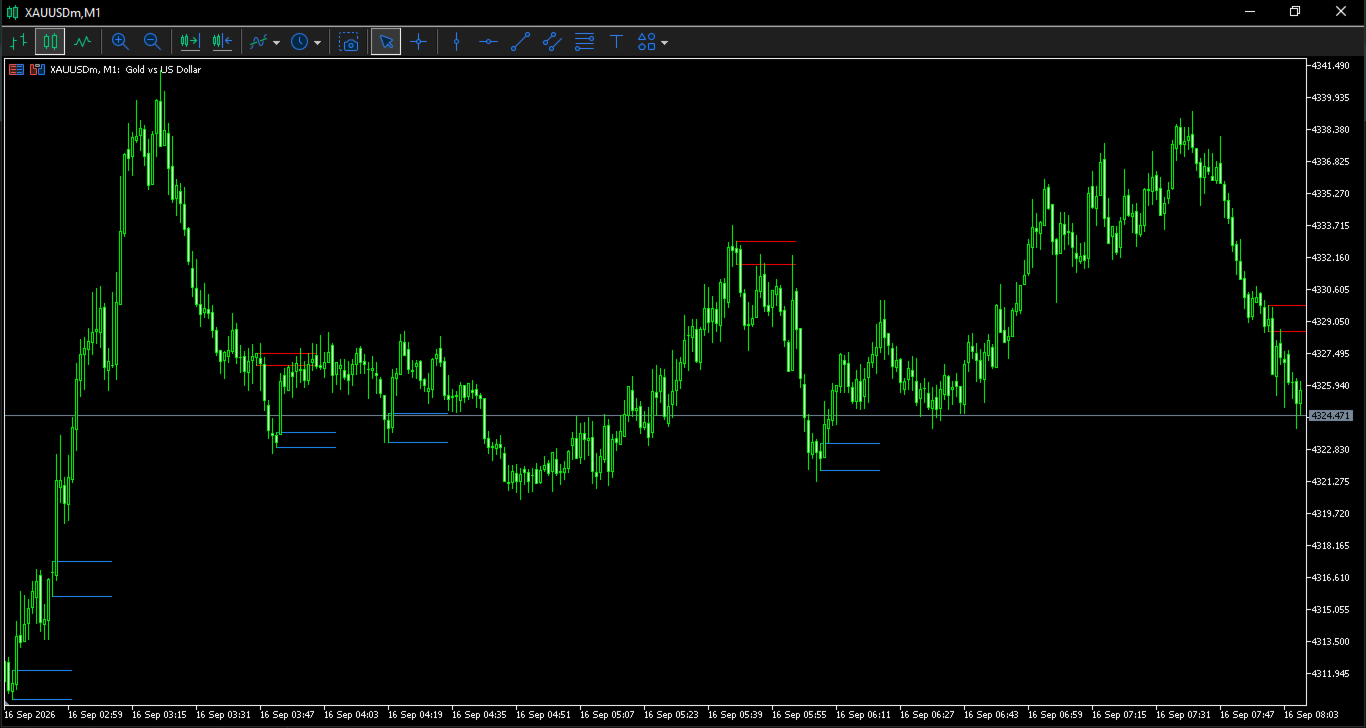
This indicator automatically detects and marks small, precise supply and demand zones directly on your chart, based on a simple but powerful price-action pattern: a "boring" candle (a candle with more wick than body) followed by an "explosive" candle (a candle whose range is significantly larger than the boring candle's range).
This combination often marks the exact point where price paused, absorbed orders, and then broke out sharply — a classic footprint of institutional supply or demand. Because zones are drawn from a single boring candle rather than a wide consolidation, they are tighter and more precise than typical supply/demand indicators, making them well suited for scalping and short-term entries.
How it works
- Scans historical bars for a boring candle immediately followed by an explosive candle.
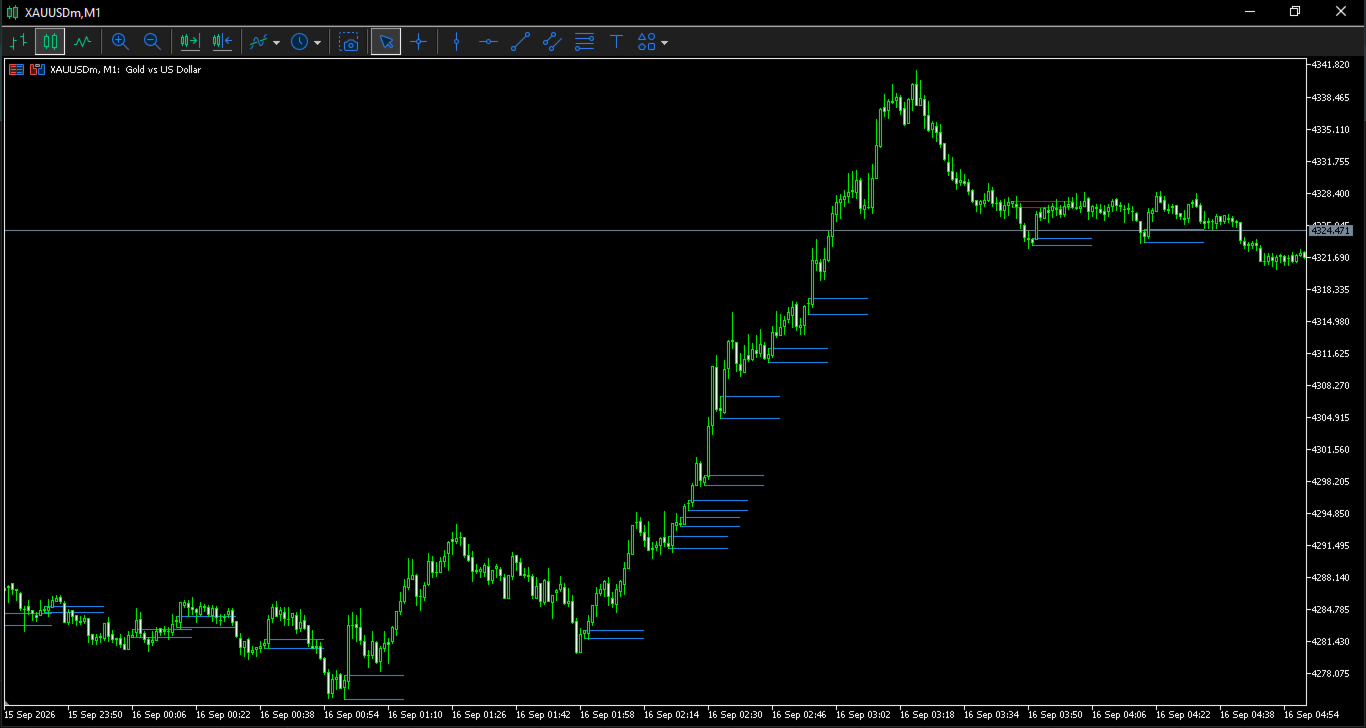
- If the explosive candle closes bullish, the boring candle's high/low is marked as a Demand zone.
- If the explosive candle closes bearish, it's marked as a Supply zone.
- Zones are drawn as two horizontal trend lines (top and bottom of the zone) in your chosen colors.
- Zones are automatically deleted once price trades back through and fills them, keeping your chart clean and only showing active, untested zones.
Inputs
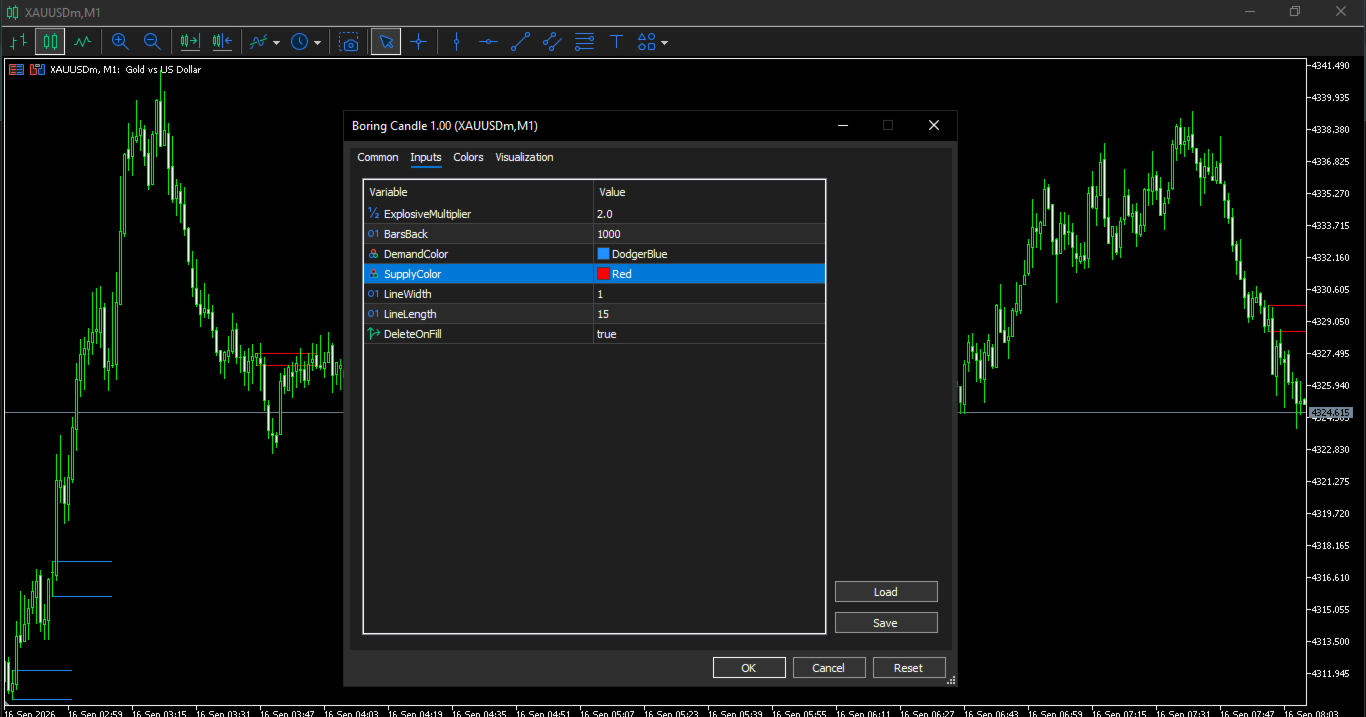
- ExplosiveMultiplier – how many times larger the explosive candle's range must be compared to the boring candle's range (default: 2).
- BarsBack – how many historical bars to scan for zones (default: 500).
- DemandColor / SupplyColor – colors for demand and supply zone lines.
- LineWidth – thickness of the zone lines.
- LineLength – how far the zone lines extend to the right (in bars).
- DeleteOnFill – automatically remove a zone once price closes through it.