GapsTrendFilter MultiSymbol
- Göstergeler
- Sürüm: 1.10

Multi-Symbol Fair Value Gap (FVG) Detector
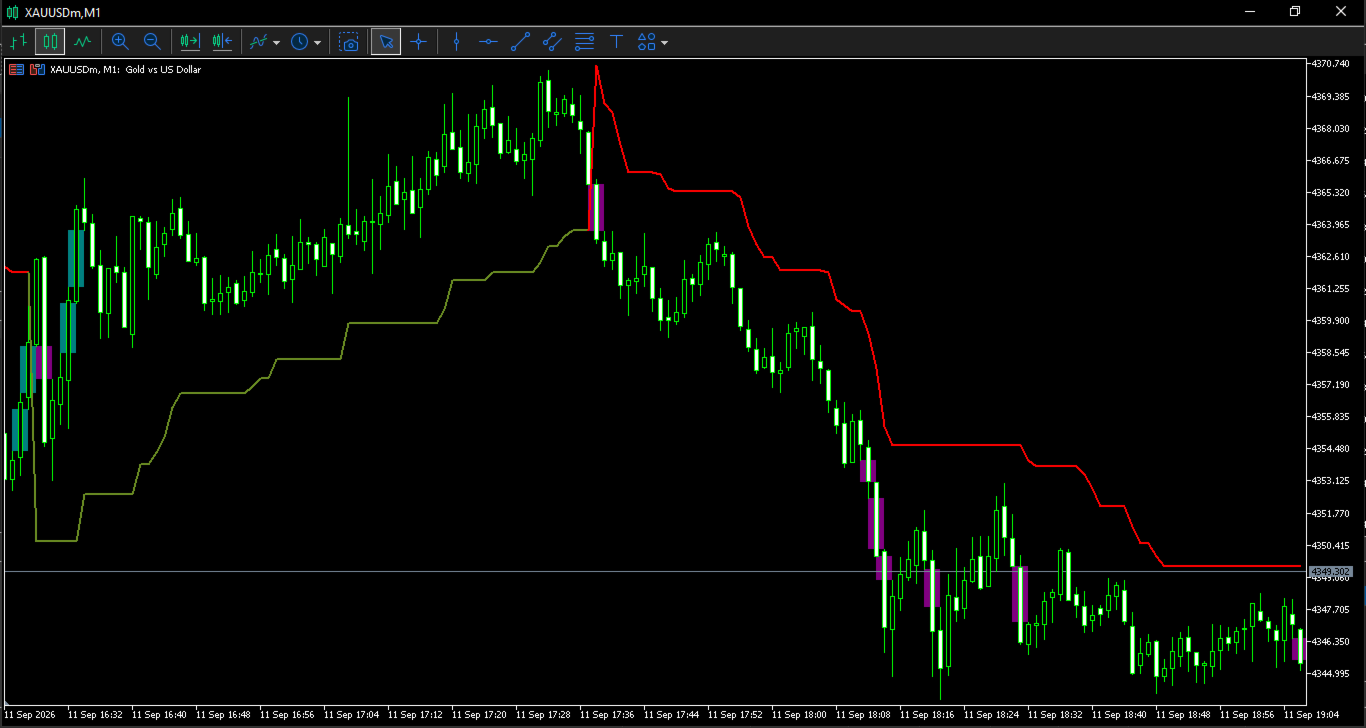
This indicator automatically detects and draws Fair Value Gaps (3-bar imbalance zones) on your chart — and unlike most FVG tools, it can source those gaps from a completely different symbol and timeframe than the one you're currently viewing.
What it does
A Fair Value Gap occurs when price moves so fast that a 3-candle imbalance forms — the low of one candle doesn't overlap with the high of the candle two bars earlier (or vice versa for bearish gaps). These zones often act as magnets or support/resistance areas price returns to later. This indicator scans for that pattern and draws it as a shaded rectangle directly on your chart, non-repainting — a gap is only confirmed and drawn once the pattern is fully closed.
Key features
- Multi-symbol, multi-timeframe sourcing — detect gaps on one symbol/timeframe (e.g. EURUSD H1) while viewing a completely different chart. Great for correlated-pair analysis or higher-timeframe gap context on a lower-timeframe chart.
- Statistical gap filtering — rather than a fixed pip/point threshold, gaps are measured against a rolling standard deviation of recent gap sizes, so the filter adapts automatically to each symbol's volatility instead of needing manual re-tuning per instrument.
- Non-repainting — gaps are only drawn once the 3-bar pattern is fully closed and confirmed.
- Live cross-symbol polling — a background timer checks the source symbol for new bars independently of your chart's own tick stream, so gaps appear even if the symbol you're viewing is quiet.
- Historical backfill on load — scans back through recent history (configurable) so you see prior gaps immediately, not just ones that form after you attach the indicator.
- Customizable colors for bullish and bearish gaps.
Inputs
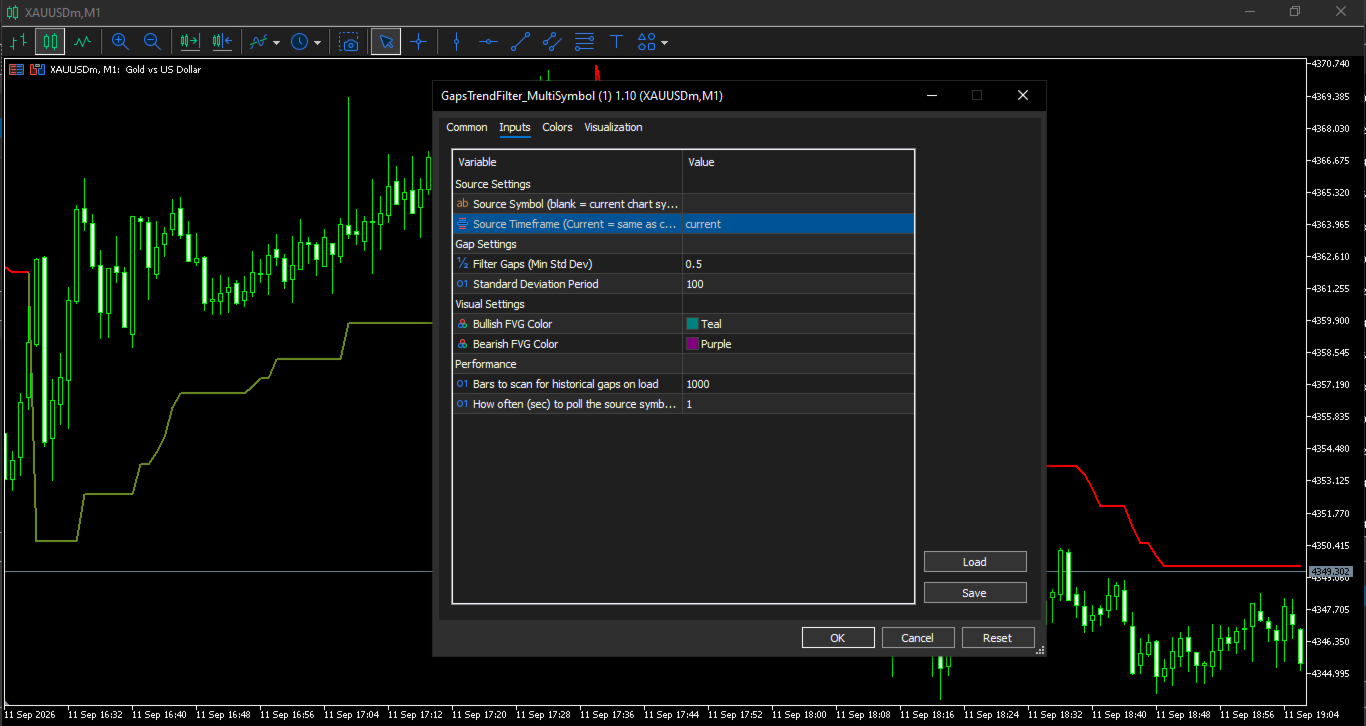
- Source Symbol — symbol to scan for gaps (blank = current chart's symbol)
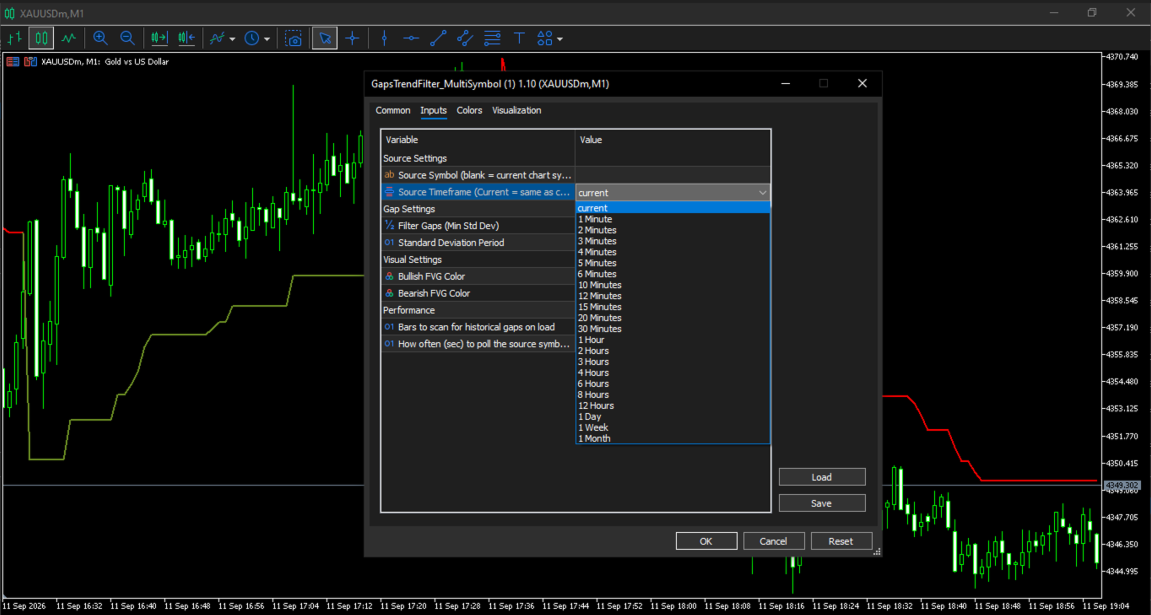
- Source Timeframe — timeframe to scan (default = current chart timeframe)
- Filter Gaps (Min Std Dev) — minimum gap size, expressed in standard deviations of recent gap sizes, before it's drawn
- Standard Deviation Period — lookback length for the gap-size statistics
- Bullish/Bearish FVG Color — box colors
- Bars to Scan on Load — how far back to backfill historical gaps when the indicator first loads
- Poll Seconds — how often to check the source symbol for a new bar
Who it's for
Traders who track imbalance/gap zones as part of their strategy — especially those who want gap context from a related instrument (e.g. a correlated pair, an index vs. its futures, or a higher timeframe) displayed directly on the chart they're actually trading.