Smartflow
- Göstergeler
- Sürüm: 6.20
- Güncellendi: 13 Ağustos 2026
- Etkinleştirmeler: 5

Overview
Smartflow is a technical indicator for MetaTrader 5 that displays directional trade signals, trend state and supply and demand levels in one chart window. It calculates a direction state from a volatility based trailing stop model using the Average True Range (ATR), and it prints buy and sell markers where that state changes on a closed bar.
The indicator does not open trades and does not manage positions. All outputs are visual, and the decision to enter or exit a trade remains with the trader.
Displayed elements
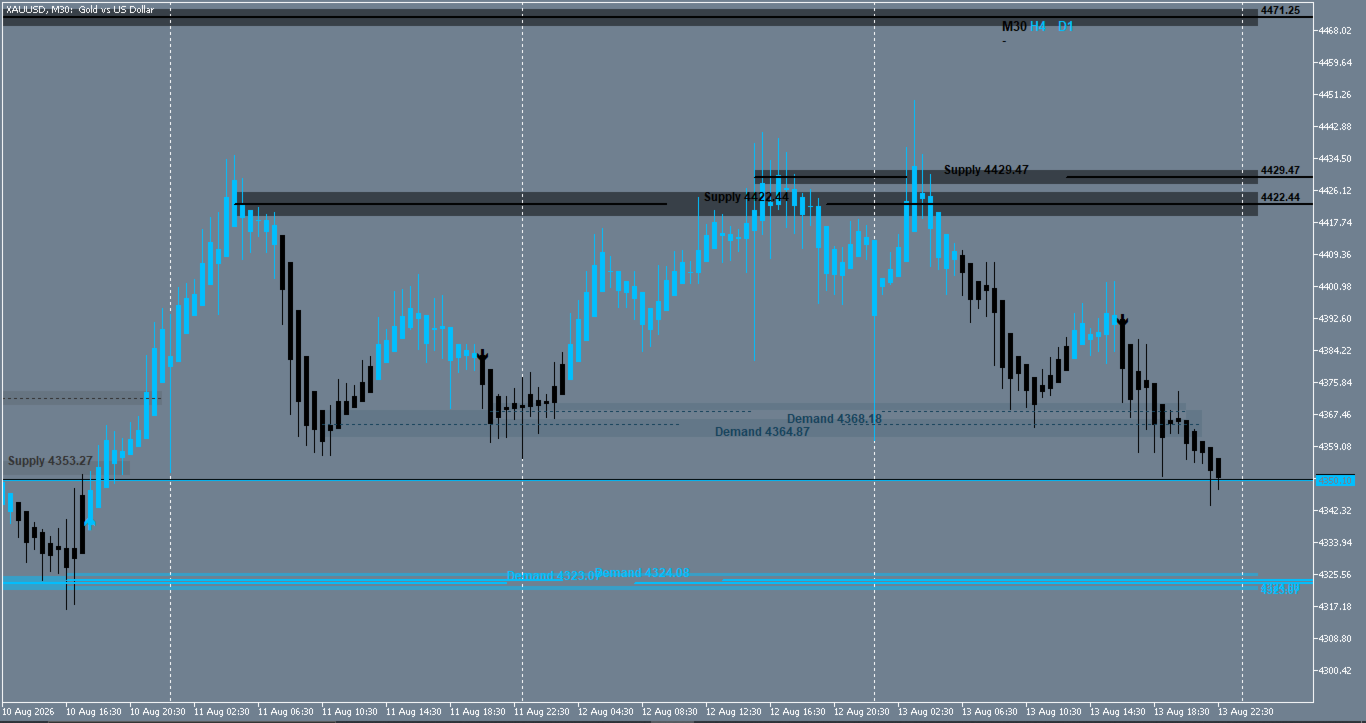
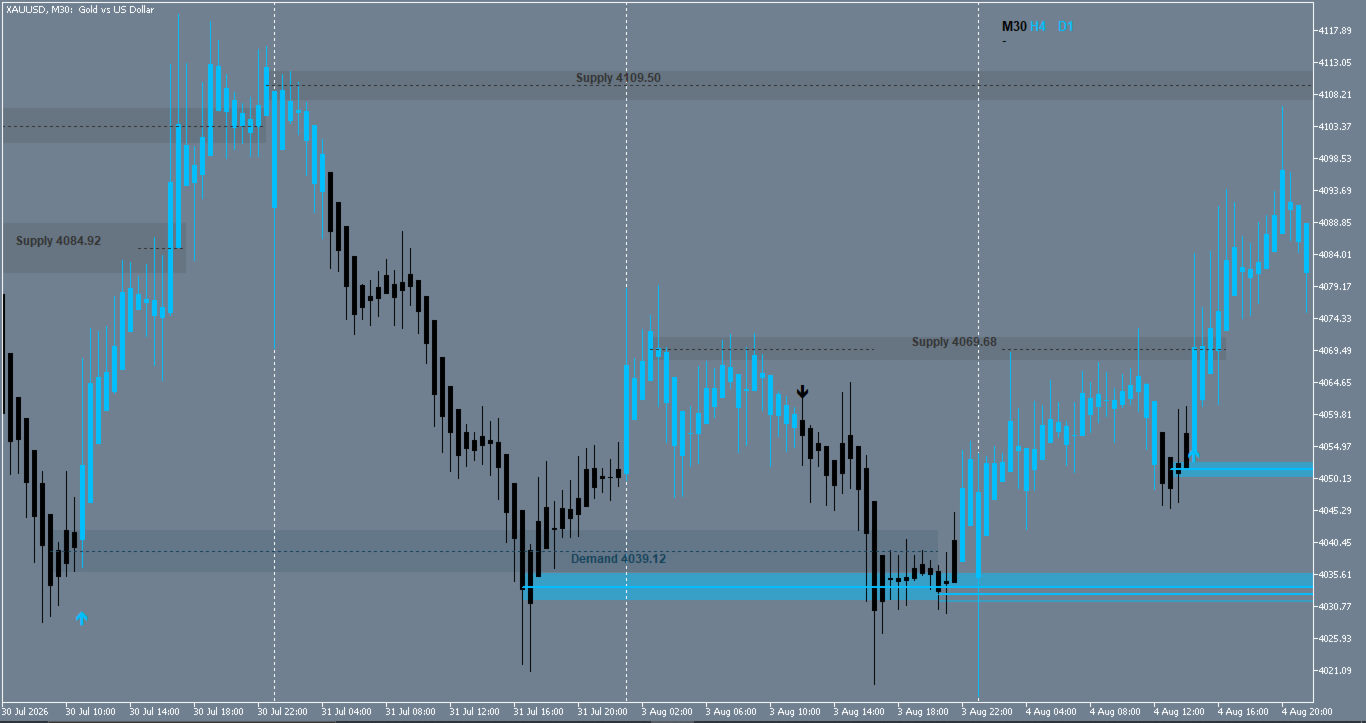
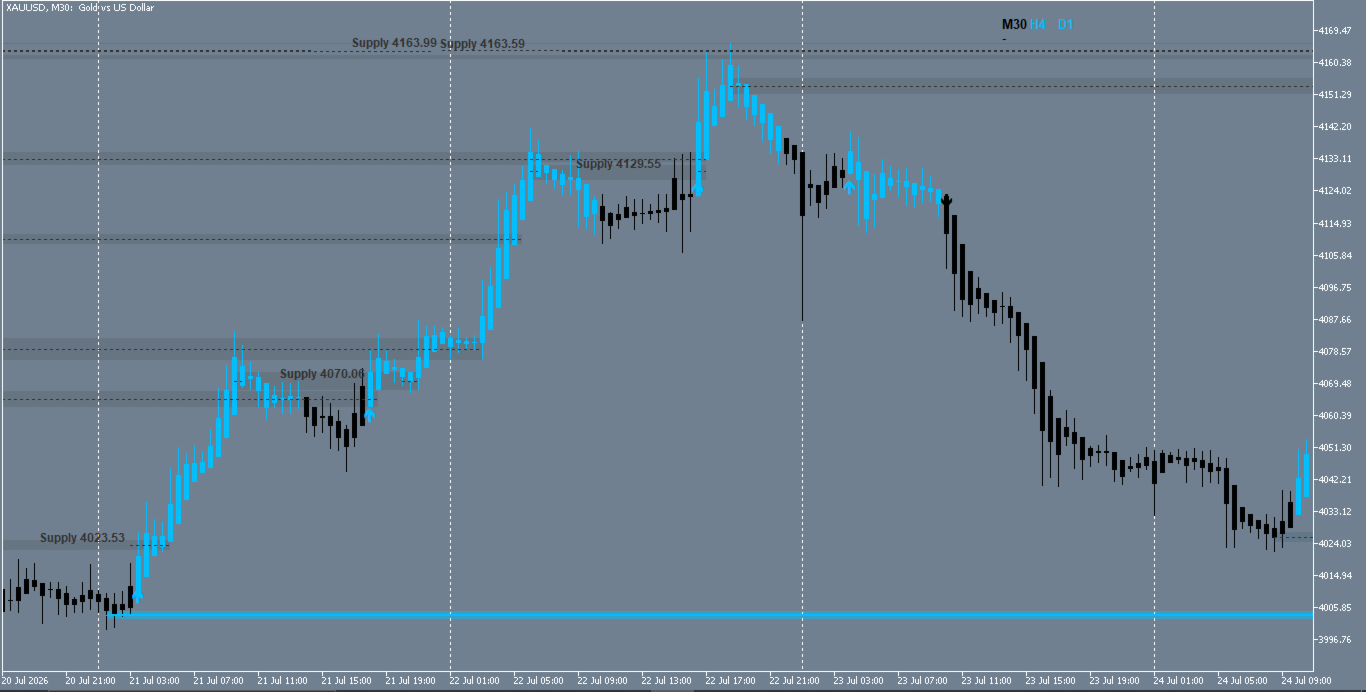
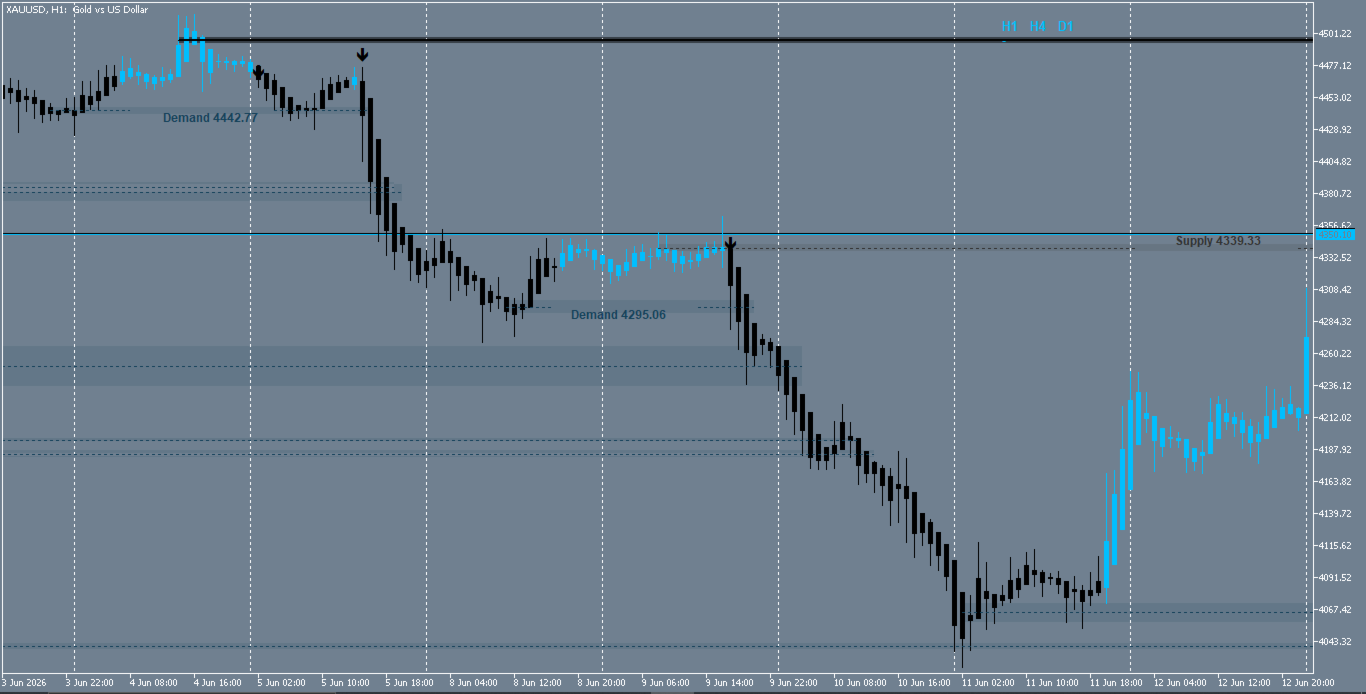
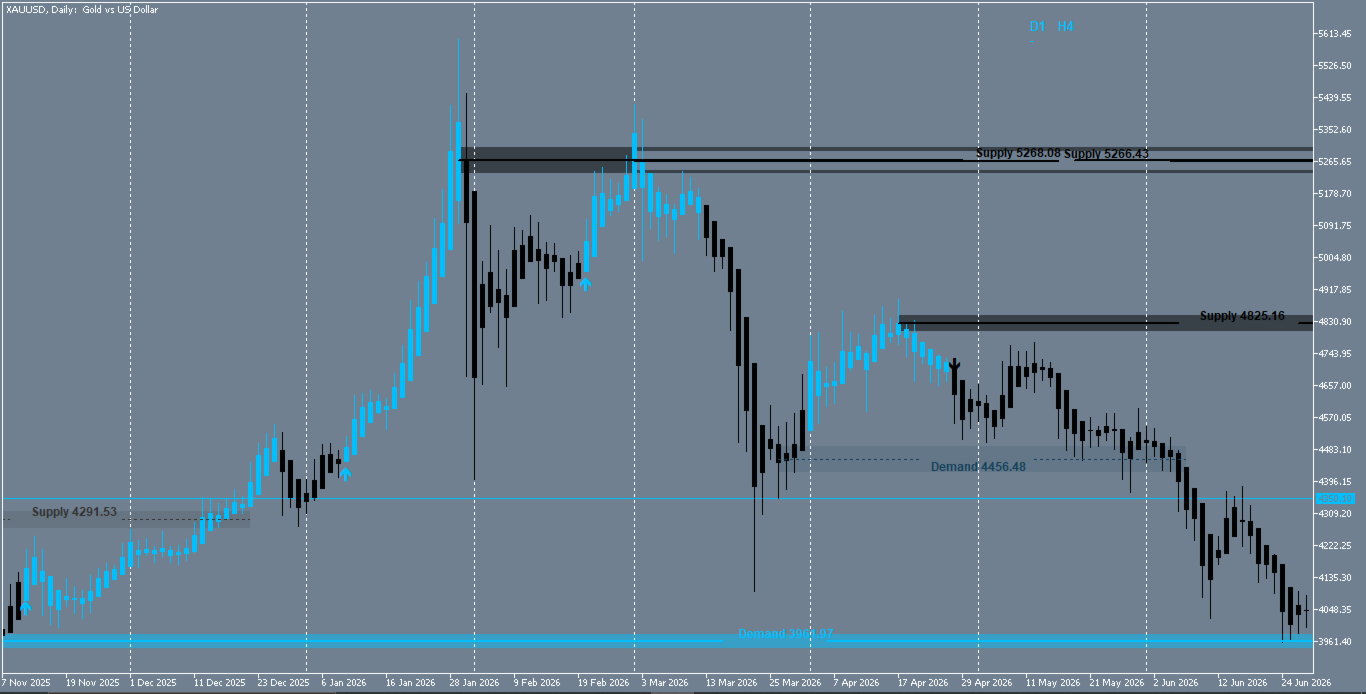
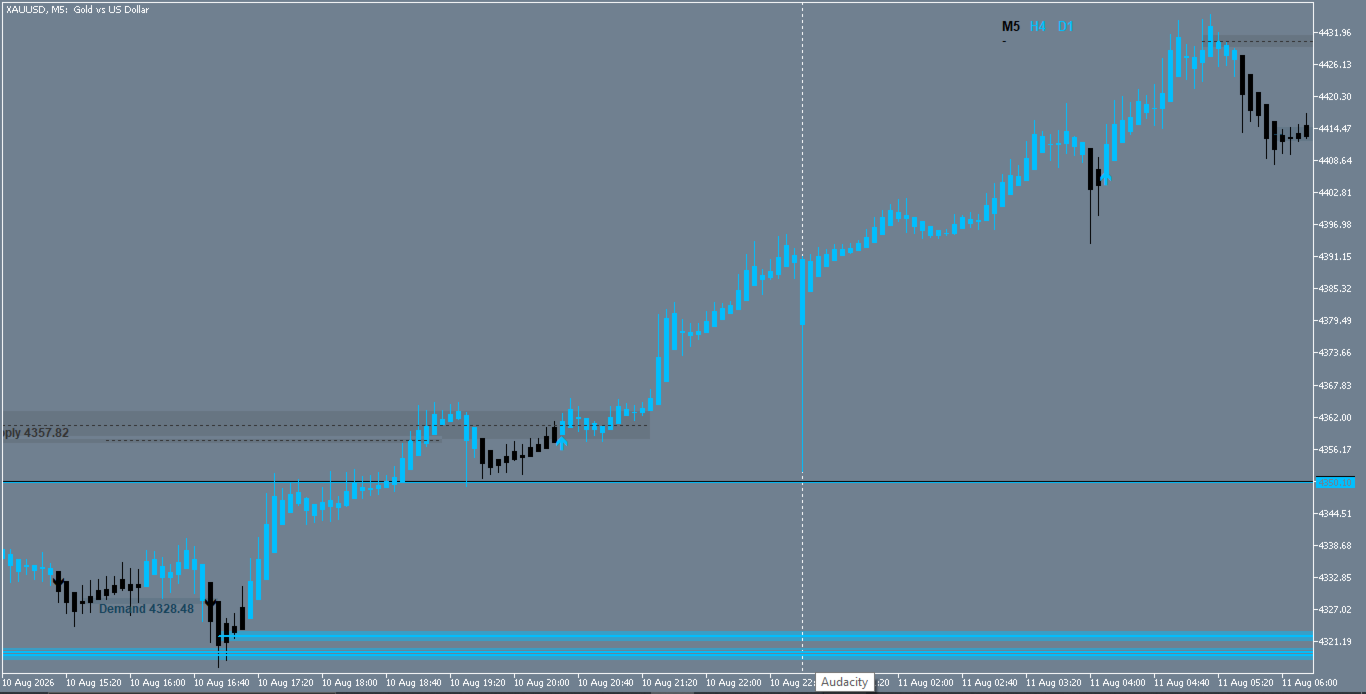
1. Buy and sell markers. Arrow objects on closed bars where the direction state changes. A marker is confirmed at the bar close and remains unchanged on later bars.
2. Trend alignment filter. An option that shows only markers aligned with a separate longer period ATR direction, so counter trend markers can be hidden.
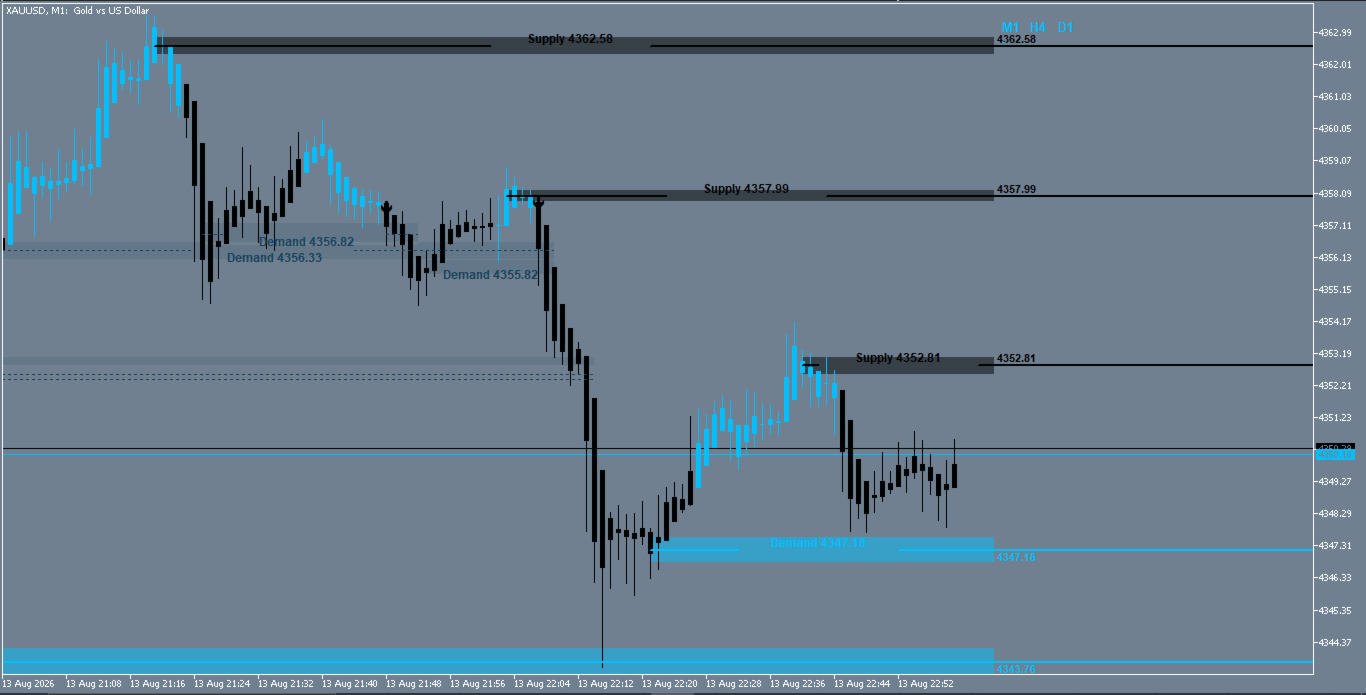
3. Multi-timeframe panel. Labels for the chart timeframe and up to two higher timeframes, each colored by the direction state of that timeframe, so alignment across timeframes can be read at a glance.
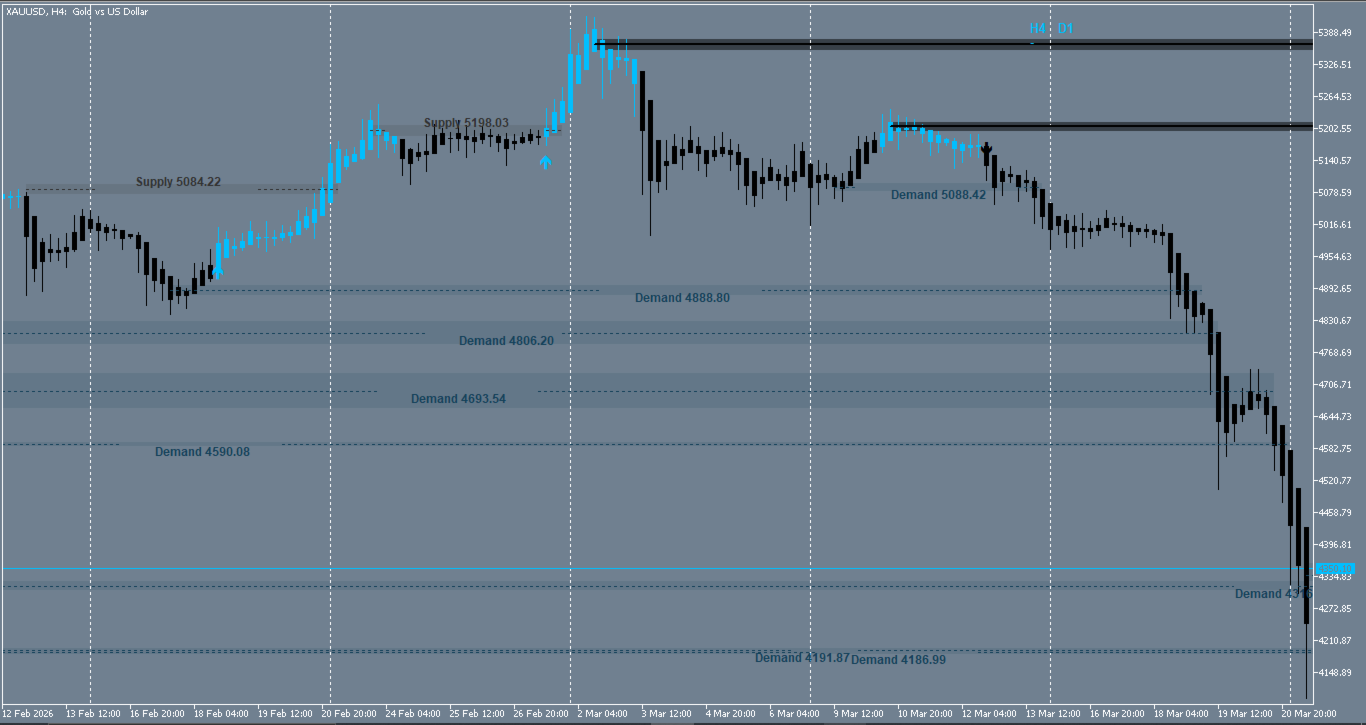
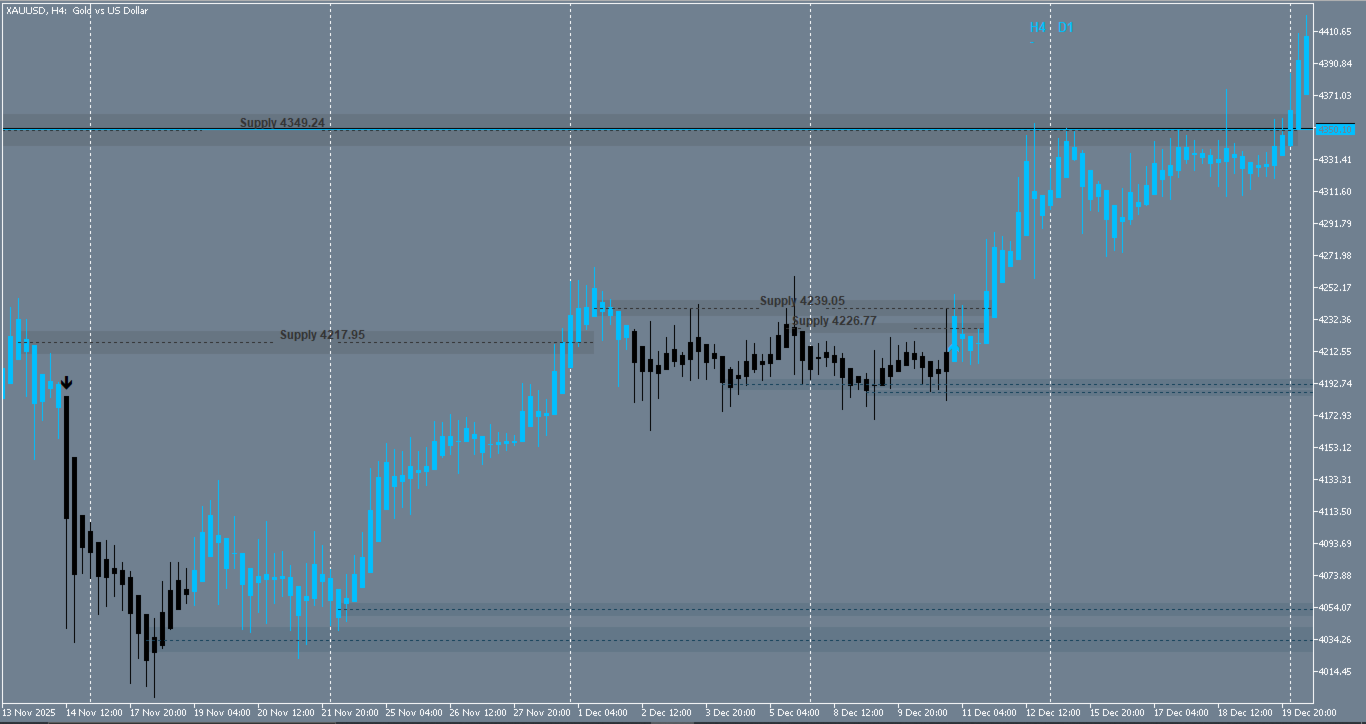
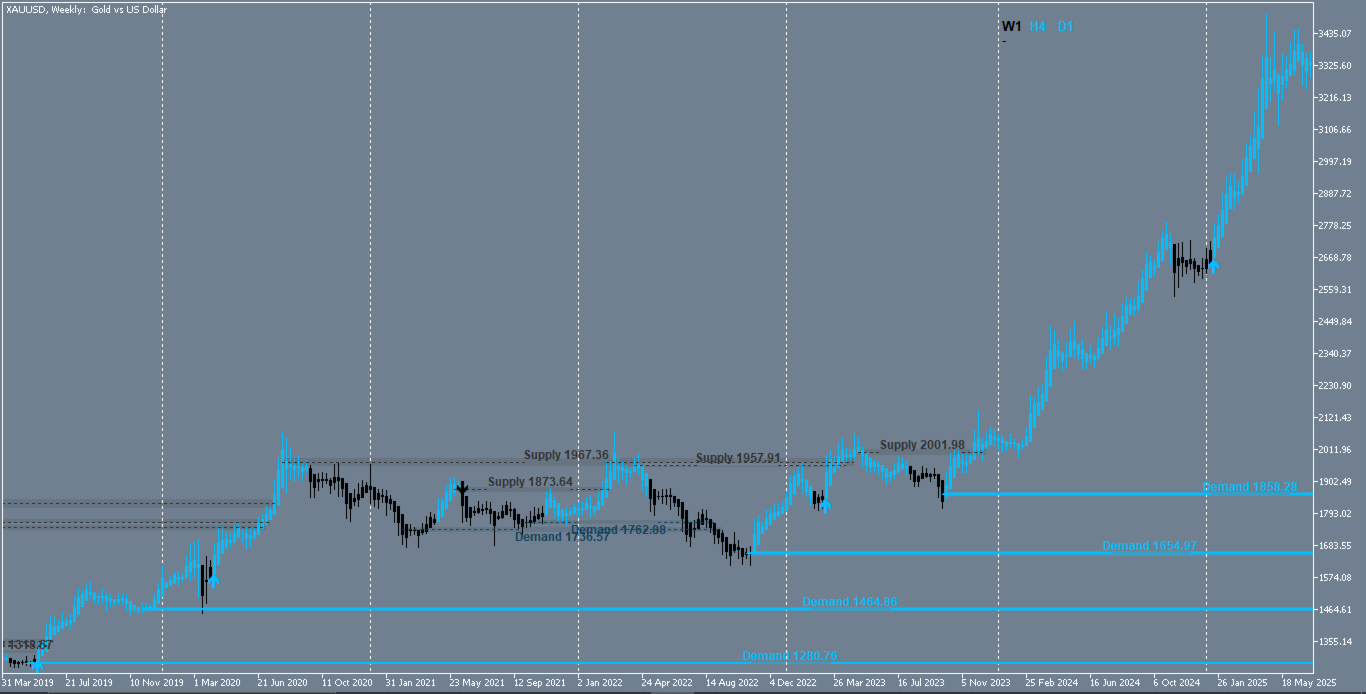
4. Supply and demand zones. Rectangles at former pivot areas with name and price labels. A violated zone stays visible with reduced opacity for later reference.
5. Colored candles. Standard or smoothed candles colored by the direction state, for a fast visual trend read.
6. Alerts. An optional alert when a new marker is confirmed at a bar close, so the chart does not need to be watched continuously.
Interpretation
A buy marker means the direction state turned bullish on the closed bar, and a sell marker means it turned bearish. The filter and the panel let the trader compare that change with the longer period and higher timeframe direction before acting. The zones mark areas where price formerly turned, and a trader may use them within his or her own planning of entries, stops and targets. How these outputs are combined and applied is the trader's own decision.
Input parameters
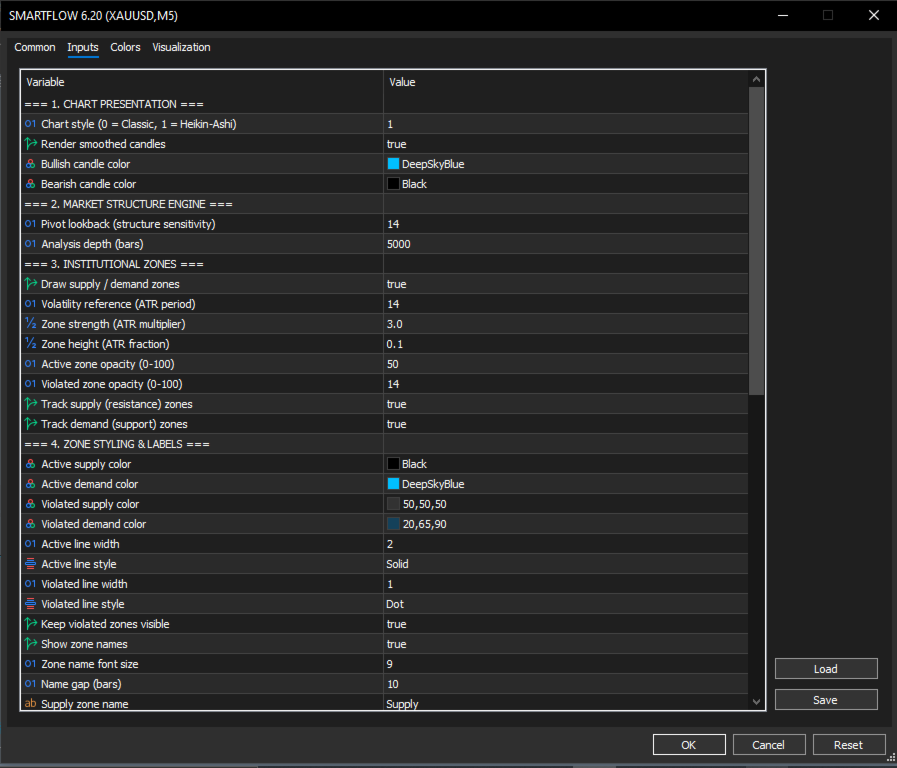
The parameters are grouped as follows:
1. Chart presentation: candle style, smoothed candle rendering, bullish and bearish colors.
2. Market structure and zones: pivot lookback, analysis depth, zone drawing, zone size and opacity, active and violated zone appearance, supply and demand tracking.
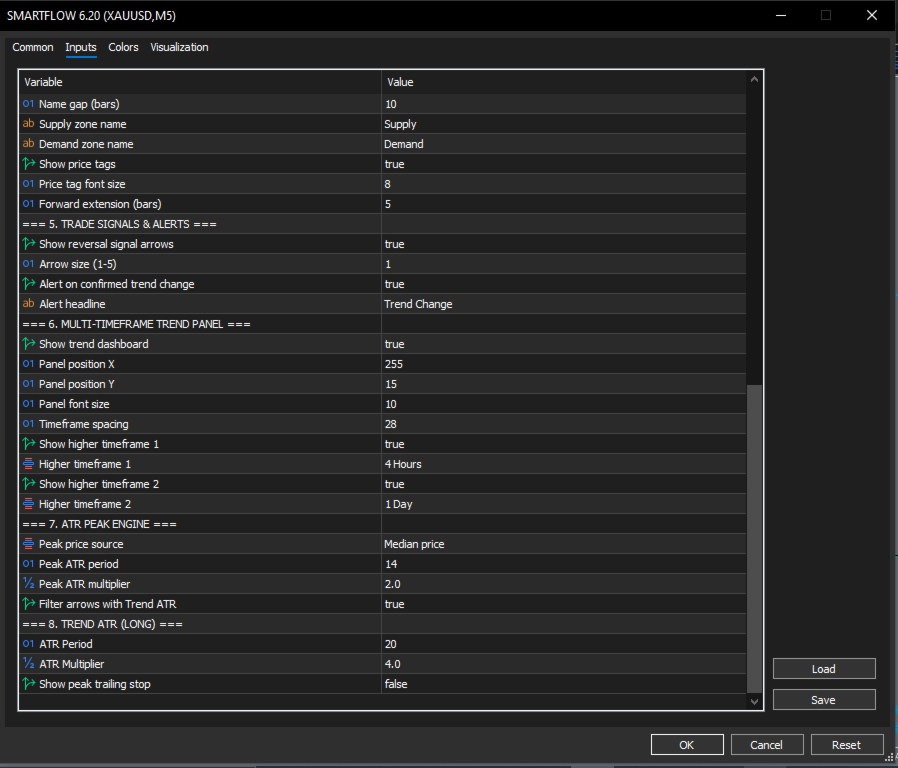
3. Zone styling and labels: colors, line widths and styles, violated zone visibility, zone names, font sizes, price tags, forward extension in bars.
4. Signals and alerts: marker display, marker size, trend alignment filter, alert enable, alert text.
5. Multi-timeframe panel: visibility, position, font size, spacing, and the two higher timeframes.
6. ATR engines: price source, signal engine period and multiplier, trend filter period and multiplier, trailing level line visibility.
Technical notes
The indicator works on any symbol and timeframe and uses the data of the current chart. Signals are evaluated on closed bars only, so the visible history stays stable and the Strategy Tester shows the same markers as the live chart. The indicator uses the built-in ATR indicator of MetaTrader 5. All drawn objects use chart specific name prefixes and are removed when the indicator is removed from the chart. It does not use DLLs, external resources or network requests.
Risk notice
Please test the product on a demo account and in the Strategy Tester before using it on a live account. Trading in financial markets involves risk, and no tool can guarantee a specific result.