• Genel bakış
  • İncelemeler (19)
  • Yorumlar (38)
  • Yenilikler

FX Volume MT5

4.94

Sabah Brifingimiz aracılığıyla ayrıntılar ve ekran görüntüleri ile günlük piyasa güncellemenizi alın burada mql5 ve on Telegram!

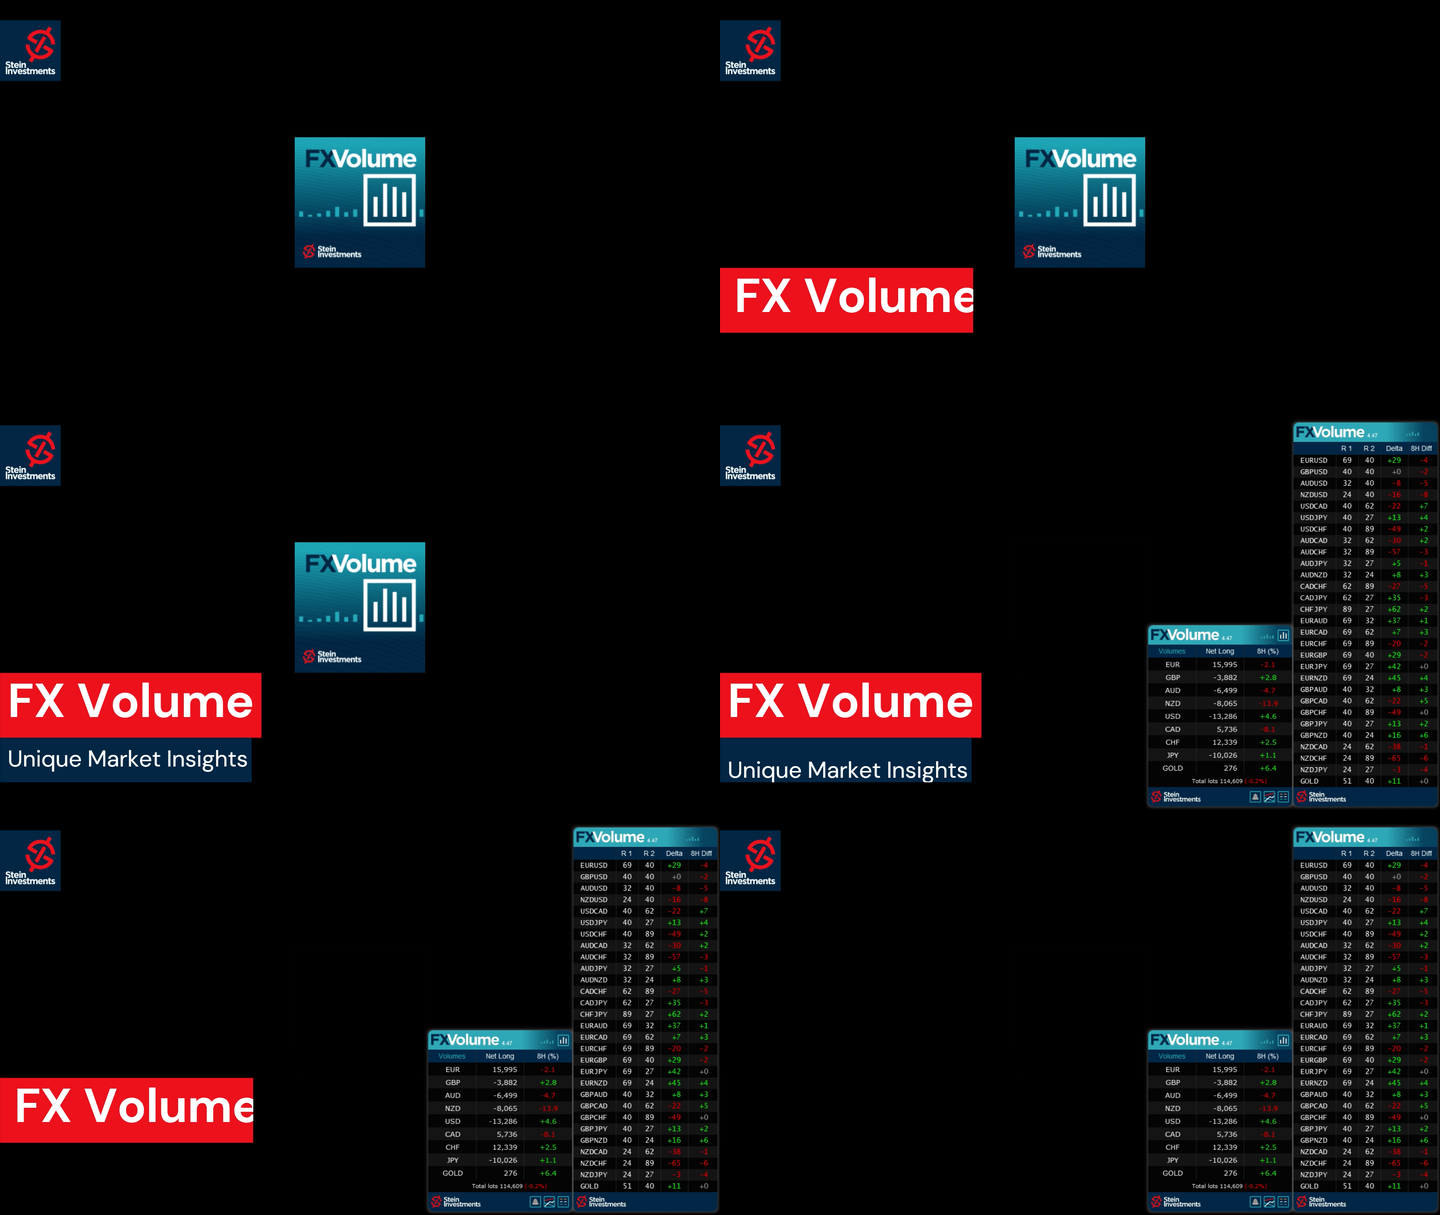
FX Volume, bir brokerin bakış açısından piyasa duyarlılığı hakkında GERÇEK bir fikir veren İLK ve TEK hacim göstergesidir.

COT raporlarından çok daha hızlı bir şekilde, brokerlar gibi kurumsal piyasa katılımcılarının Forex piyasasında nasıl konumlandıklarına dair harika bilgiler sağlar.
Bu bilgileri doğrudan grafiğinizde görmek, ticaretiniz için gerçek oyun değiştirici ve çığır açan bir çözümdür.

Benzersiz piyasa verileri bilgilerinden yararlanın

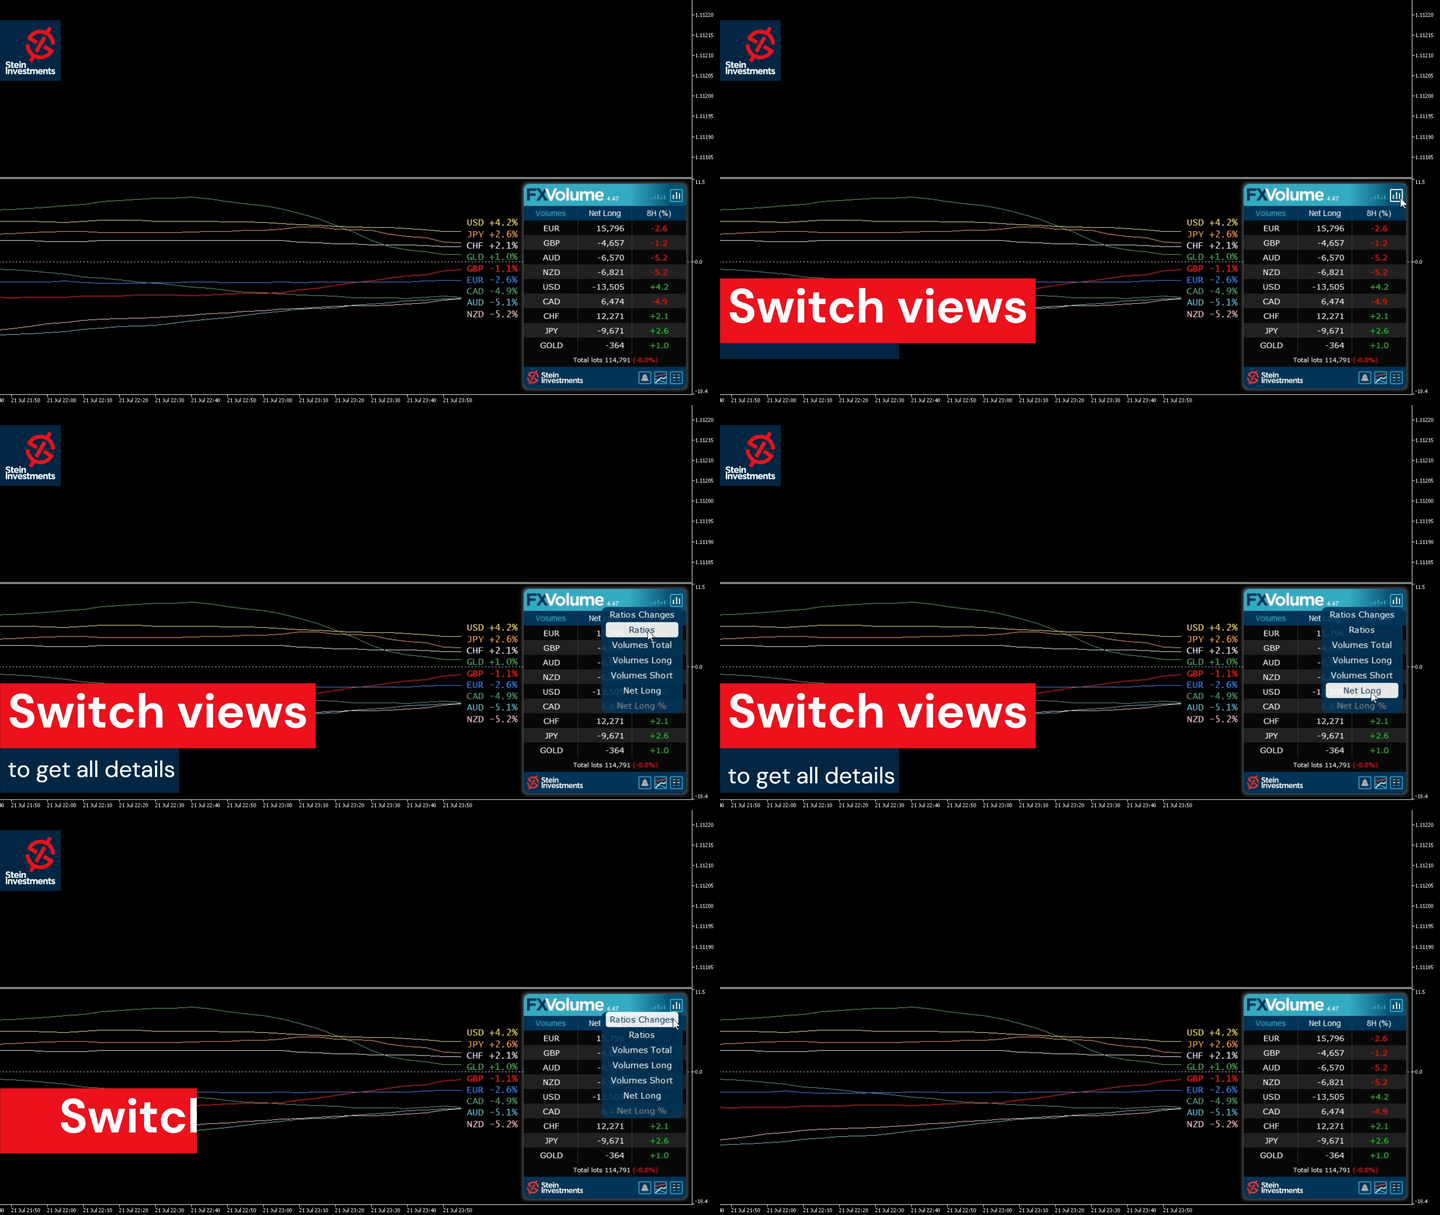
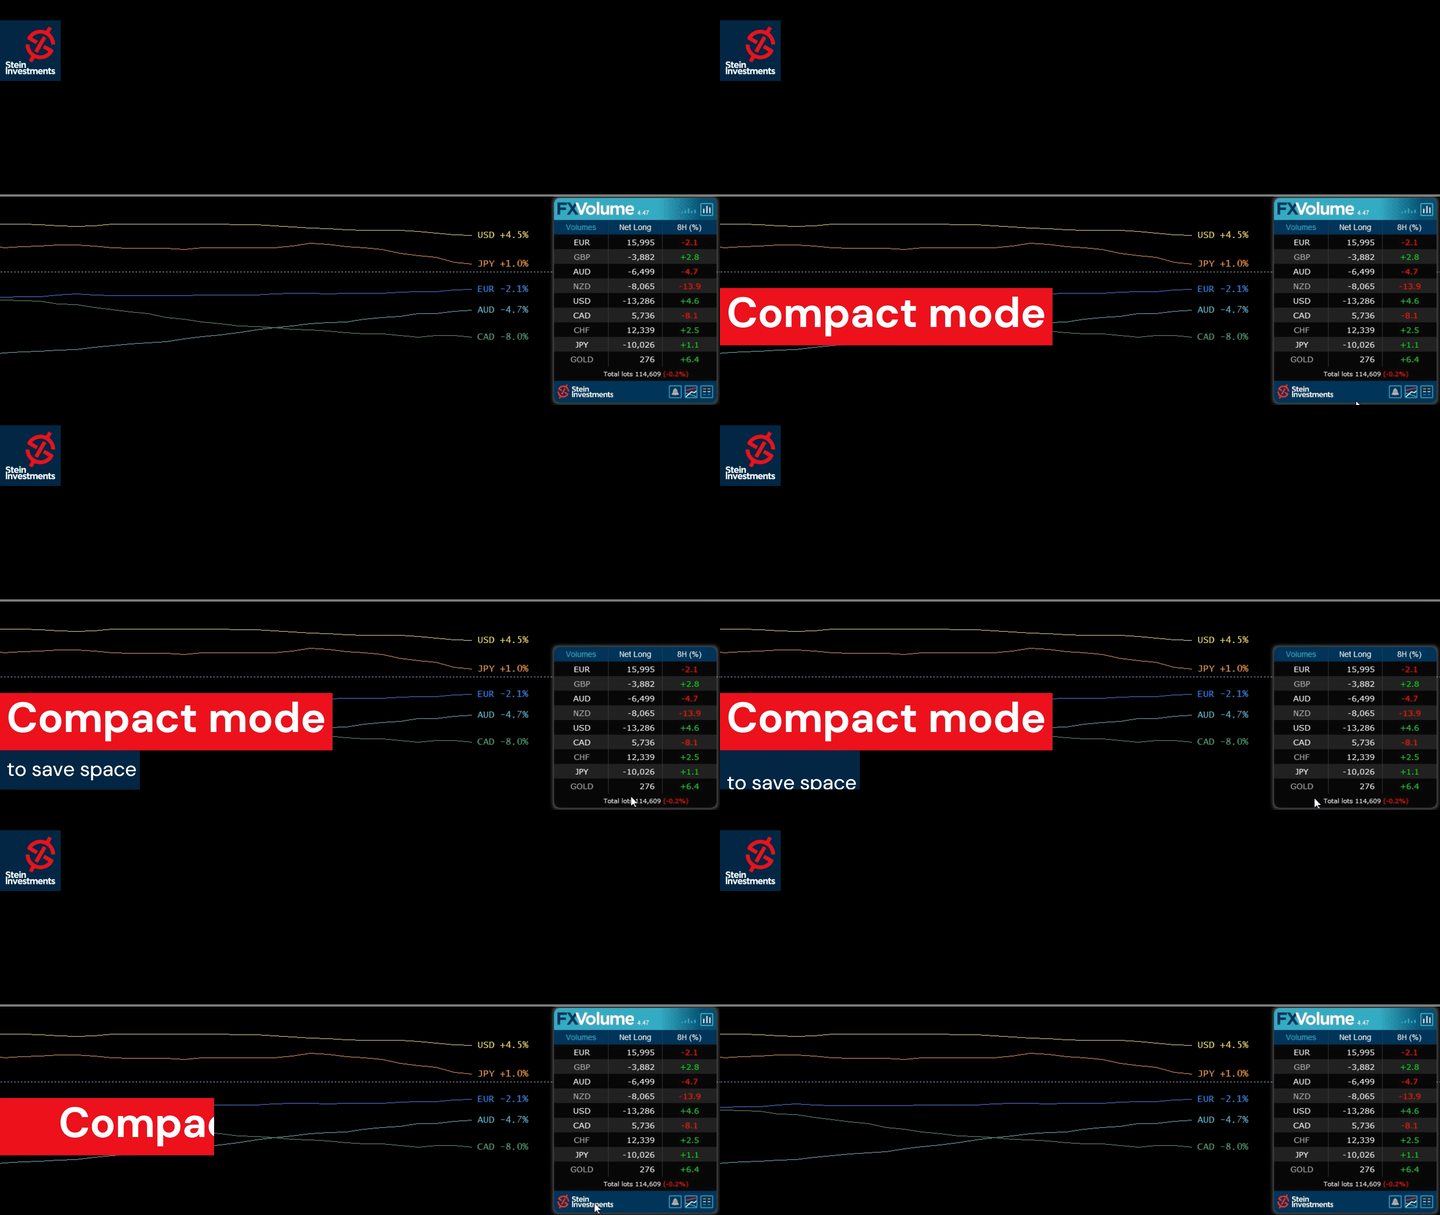
  • Oranlar para birimlerinin uzun ve kısa pozisyon oranlarını yüzde olarak gösterir
  • Oran Değişimleri uzun oranları ve seçilen zaman aralığındaki yüzde değişimlerini gösterir
  • Toplam Hacimler para birimlerinin lot cinsinden toplam işlem hacmini (uzun ve kısa) gösterir
  • Volumes Long para birimlerinin tüm uzun pozisyonlarının işlem hacmini gösterir
  • Volumes Short para birimlerinin tüm kısa pozisyonlarının işlem hacmini gösterir
  • Net Long net uzun hacmi gösterir, i.e. lot cinsinden tüm uzun pozisyonlar eksi tüm kısa pozisyonlar
  • Net Uzun Yüzde para birimlerinin net uzun hacmindeki değişimi gösterir

Lütfen temel eğitimimizi okuyun -> "FX Volume ile nasıl işlem yapılır"

Sıkça Sorulan Sorular, yatırım ipuçları ve eğitim videoları gibi daha fazla bilgiyi public FX Volume info channel


Arka plan bilgisi

Hepimiz Forex'in merkezi olmayan bir piyasa olduğunu biliyoruz. Bu nedenle, bu paha biçilmez bilgiyi grafiklerimizde elde etmek için kutunun dışında düşünmek, benzersiz bir çözüm geliştirmek ve şimdiye kadar üzerinde çalıştığımız en karmaşık projeyi kodlamak zorunda kaldık. Ekim 2018'den bu yana sunucularımız dünyanın dört bir yanındaki birçok farklı kaynaktan gelen gerçek işlem hacmi veri akışlarını analiz ediyor ve kaydediyor. Verileri topluyor, işlem hacminin nasıl değiştiğini analiz ediyor ve en önemli Forex işlem para birimleri için bir endeks hesaplıyoruz ancak bu sadece başlangıç. Daha sonra, Altın ve Petrol gibi diğer ticaret araçları için de bu tür bilgiler sağlayacağız.


Stein Investments tarafından sağlanan gerçek hacim verilerini kullanmanın faydası nedir? Broker bakış açımız sayesinde akıllı parayla kolayca işlem yapabilirsiniz
2. Bu tür duygu piyasası verilerini gerçek zamanlı olarak doğrudan grafiğinizde elde edersiniz
3. Gerçek zamanlı kaydedilmiş geçmiş veritabanımız sayesinde, bu bilgilerin ne kadar değerli olduğunu kolayca kontrol edebilirsiniz

FX Volume kesinlikle benzersizdir çünkü bu verileri doğrudan grafiğinize yazdırabilen tek araçtır!


Neden sadece kiralık?

Yukarıda açıklandığı gibi FX Volume, arka plandaki veritabanı ve grafiklerinize yüklediğiniz grafiksel ön uç gibi tüm yapıyı izleyen ve geliştiren yöneticiler ve kodlayıcıların yanı sıra maliyetli çalışan bir arka uç altyapısına sahip devam eden bir hizmettir.

Bu nedenle makul bir yinelenen ücret talep etmek zorundayız, ancak FX Volume kendini kolayca ödeyecektir.
Buna ek olarak, orta ve uzun vadeli abonelikler için büyük indirimler sağlıyoruz.


FX Volume gösterge ayarları

  • Broker DST bölgesi ve GMT kayması - Doğru değerleri almak için lütfen google'a bakın veya broker desteğinize danışın
  • X saat geri ile karşılaştır - Oran ve Delta karşılaştırması için saatlik bir değer ayarlayın. Varsayılan değer 24 saat öncesidir.
  • Tüm geçmiş satırlarını görüntüle - Yalnızca sembolle ilgili para birimlerinin geçmiş satırlarını görmek için "false" olarak ayarlayın
  • Varsayılan görünüm - Oran ve Değişiklikler görünümü arasında seçim yapın
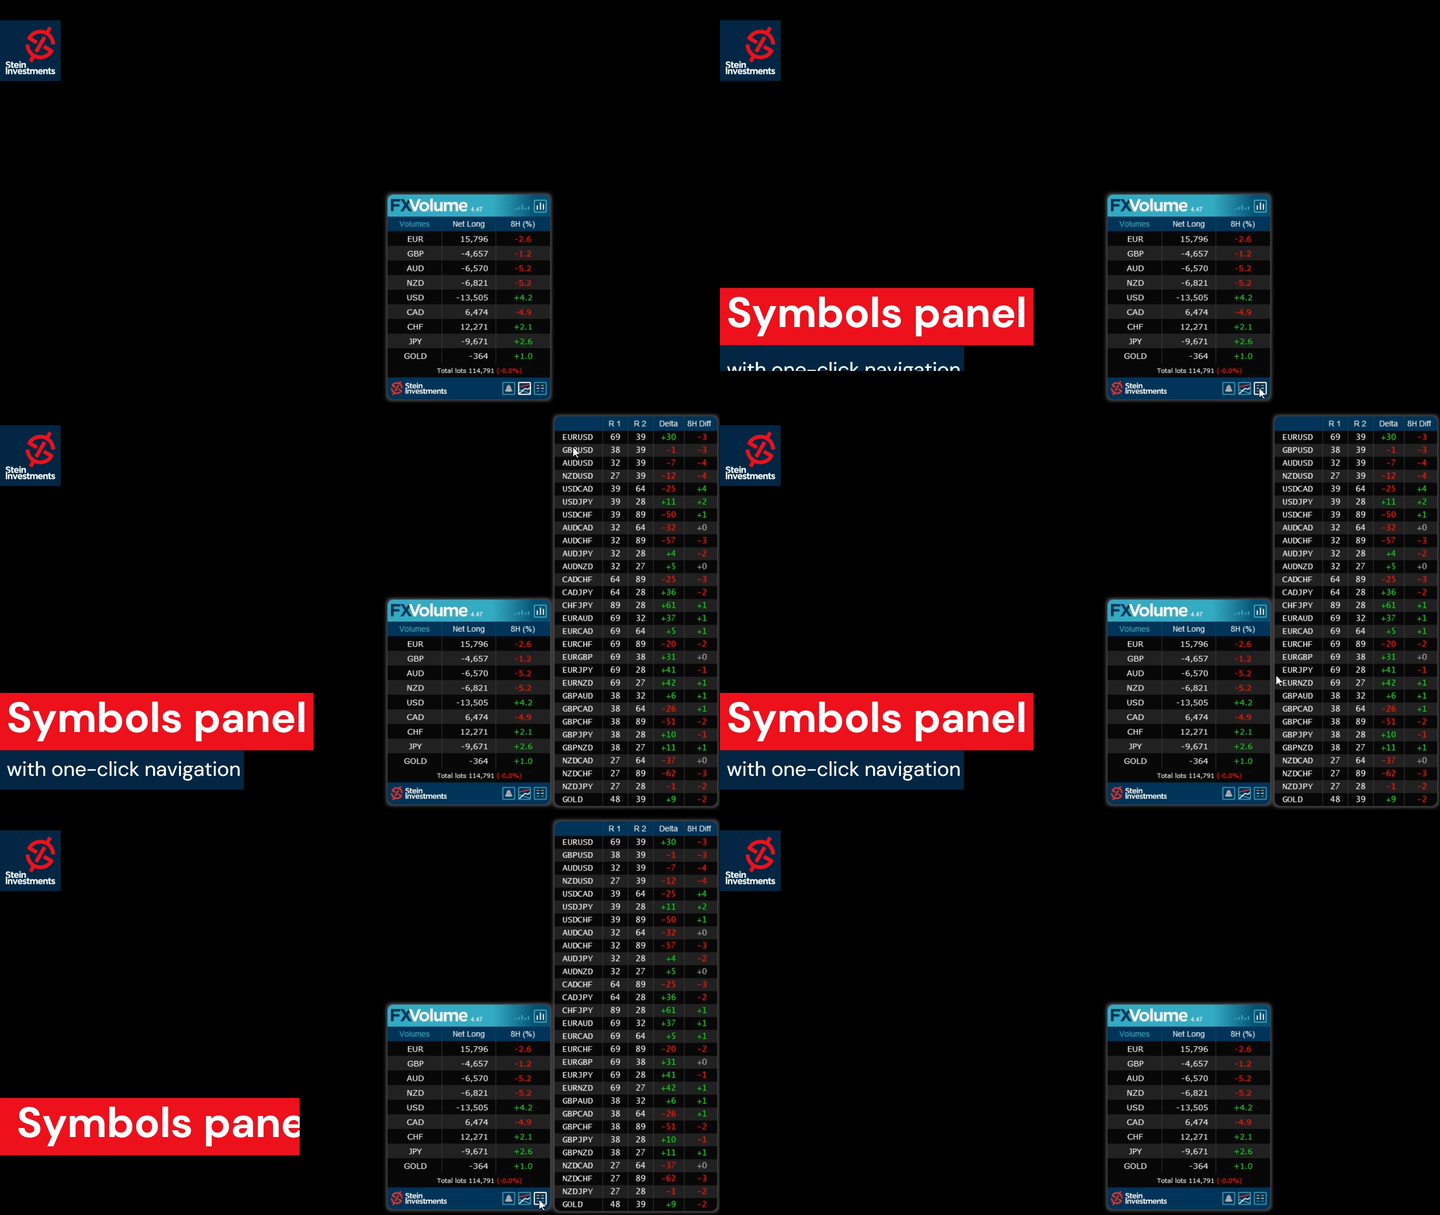
  • Sembol listesini görüntüle - Ana grafikteki 28 sembolün listesini gizlemek için "false" olarak ayarlayın
  • Zoom faktörü - Tüm grafik öğelerinin boyutunu artırın veya azaltın


Sürekli karlı 5 yıldızlı bir forex yatırımcısı olmak ister misiniz?

O zaman Stein Investments yatırım araçlarımızı edinin ve 500 üyeli özel yatırım sohbetimize kişisel davetiyenizi almak için bize bir ekran görüntüsü gönderin.


İncelemeler 19
indaplace2be
39
indaplace2be 2024.04.02 16:04 
 

fast and awesome support from Mr. Daniel! Great indicator! Thank you sir!

raulovalle
90
raulovalle 2023.12.23 22:34 
 

Hello ... I bought the FX Volume and I must have a fact to add me to the telegram or it is the same telegram they use in general.

Oliver Henry
593
Oliver Henry 2023.07.24 22:20 
 

Very good indicator and totally unique on the retail forex market. The insight a trader can get from this is a real edge for trading. The support is also very good as are the daily updates that are published on the chat group.

Önerilen ürünler
BoxChart MT5
Evgeny Shevtsov
5 (7)
The market is unfair if only because 10% of participants manage 90% of funds. An ordinary trader has slim changes to stand against these "vultures". This problem can be solved. You just need to be among these 10%, learn to predict their intentions and move with them. Volume is the only preemptive factor that faultlessly works on any timeframe and symbol. First, the volume appears and is accumulated, and only then the price moves. The price moves from one volume to another. Areas of volume accumu
Was: $249  Now: $99   Market Profile defines a number of day types that can help the trader to determine market behaviour. A key feature is the Value Area, representing the range of price action where 70% of trading took place. Understanding the Value Area can give traders valuable insight into market direction and establish the higher odds trade. It is an excellent addition to any system you may be using. Inspired by Jim Dalton’s book “Mind Over Markets”, this indicator is designed to suit the
Gösterge, tarihsel olanlarla karşılaştırılabilecek güncel teklifler oluşturur ve bu temelde bir fiyat hareketi tahmini yapar. Gösterge, istenen tarihe hızlı navigasyon için bir metin alanına sahiptir. Seçenekler: Sembol - göstergenin göstereceği sembolün seçimi; SymbolPeriod - göstergenin veri alacağı dönemin seçimi; GöstergeRenk - gösterge rengi; Ters - doğru tırnakları tersine çevirir, yanlış - orijinal görünüm; Sonraki, tarihi girebileceğiniz ve 'enter' tuşuna basa
This indicator allows you to enjoy the two most popular products for analyzing request volumes and market deals at a favorable price: Actual Depth of Market Chart Actual Tick Footprint Volume Chart This product combines the power of both indicators and is provided as a single file. The functionality of Actual COMBO Depth of Market AND Tick Volume Chart is fully identical to the original indicators. You will enjoy the power of these two products combined into the single super-indicator! Below is
The Volume by Price Indicator for MetaTrader 5 features Volume Profile and Market Profile TPO (Time Price Opportunity). Get valuable insights out of currencies, equities and commodities data. Gain an edge trading financial markets. Volume and TPO histogram bar and line charts. Volume Footprint charts. TPO letter and block marker charts including split structures. Versatile segmentation and compositing methods. Static, dynamic and flexible ranges with relative and/or absolute visualizations. Lay
Blahtech Supply Demand MT5
Blahtech Limited
4.57 (14)
Was: $299  Now: $99   Supply Demand uses previous price action to identify potential imbalances between buyers and sellers. The key is to identify the better odds zones, not just the untouched ones. Blahtech Supply Demand indicator delivers functionality previously unavailable on any trading platform. This 4-in-1 indicator not only highlights the higher probability zones using a multi-criteria strength engine, but also combines it with multi-timeframe trend analysis, previously confirmed swings
Strong Support mt5
Vasiliy Strukov
5 (9)
Destek ve direnç seviyeleri eski zamanlardan beri piyasayı analiz etmek için en güçlü araç olmuştur. Güçlü Destek göstergesi, destek seviyelerini yerel fiyat düşüklerine ve direnç seviyelerini yerel fiyat yükseklerine göre oluşturur.  Diğer gelişimlerim burada görülebilir Örneğin, Gold Stuff gibi bir eğilim göstergesiyle birlikte kullanılması önerilir; bu, trend üzerinde işlem yapmanıza ve aynı zamanda konsolidasyon veya eğilim tersine çevrilme bölgelerini belirlemenize ve destek ve direnç
Do you use volume in your reading of the market? Certainly many traders use it, and do not imagine operating without it. The Color Histogram Volume Set indicator allows the user to choose the value that he considers interesting to monitor. When you pass this you will have visual confirmation and if you want you will also have the audible alert that is given by the indicator. Of course, there are other ways to try to find a high volume, such as assessing whether the volume
UPD1 Profile Levels MT5
Vitaliy Kuznetsov
5 (3)
Gösterge, belirtilen sayıda çubuk için çalışma histogramında maksimum ve minimum fiyat hacminin (piyasa profili) seviyelerini bulur.   Kompozit profil. Histogramın yüksekliği tamamen otomatiktir ve herhangi bir enstrümana ve zaman dilimine uyarlanabilir. Yazarın algoritması kullanılır ve bilinen analogları tekrarlamaz. İki histogramın yüksekliği yaklaşık olarak mumun ortalama yüksekliğine eşittir. Akıllı uyarı (akıllı uyarı), hacim seviyesine ilişkin fiyatı bildirmenize yardımcı olur. Konsept
Premium seviye, %80'den fazla doğru tahmin doğruluğuna sahip benzersiz bir göstergedir! Bu gösterge en iyi Ticaret Uzmanları tarafından iki aydan uzun süredir test edilmiştir! Yazarın göstergesini başka hiçbir yerde bulamazsınız! Ekran görüntülerinden bu aracın doğruluğunu kendiniz görebilirsiniz! 1, sona erme süresi 1 mum olan ikili opsiyon ticareti için harikadır. 2 tüm döviz çiftleri, hisse senetleri, emtialar, kripto para birimleri üzerinde çalışır Talimatlar: Kırmızı ok görün
This indicator is a conventional analytical tool for tick volumes changes. It calculates tick volumes for buys and sells separately, and their delta on every bar, and displays volumes by price clusters (cells) within a specified bar (usually the latest one). The algorithm used internally is the same as in the indicator VolumeDeltaMT5 , but results are shown as cumulative volume delta bars (candlesticks). Analogous indicator for MetaTrader 4 exists - CumulativeDeltaBars . This is a limited substi
No Demand No Supply MT5
Trade The Volume Waves Single Member P.C.
No Demand No Supply   This indicator identifies   No Demand –No Supply candles  to your chart and plots volume bars colored according to the signal. It can be applied to all timeframes or to a specific one only. It can also be used as regular volume indicator  with exceptional future of WEIGHTED VOLUME. Furthermore is has an alert notification, sound and email when a signals occurs. The indicator does not repaint but the alert will come on two candles back due to the definition of No Demand No S
VolumeProfile MT5
Robert Hess
3.75 (8)
Description: The Volume Profile displays detailed informations of historical trading activities at certain price levels (Market Profile). Locate the areas with the best prices in the market and get an advantage over other market participants. Support: The indicator is constantly being developed and improved. Please do not hesitate to contact me via the MQL5 Platform. I am very grateful about any Bug report, so that i can constantly improve the indicator. I appreciate any public review for this
Market Profile MetaTrader System  — is a classic Market Profile implementation that can show the price density over time, outlining the most important price levels, value area, and control value of a given trading session. This indicator can be attached to timeframes between M1 and D1 and will show the Market Profile for daily, weekly, monthly, or even intraday sessions. Lower timeframes offer higher precision. Higher timeframes are recommended for better visibility. It is also possible to use a
Gioteen Volatility Index (GVI) - your ultimate solution to overcoming market unpredictability and maximizing trading opportunities. This revolutionary indicator helps you in lowering your losing trades due to choppy market movements. The GVI is designed to measure market volatility, providing you with valuable insights to identify the most favorable trading prospects. Its intuitive interface consists of a dynamic red line representing the volatility index, accompanied by blue line that indicate
RAD CRITICAL LEVES RAD indicator tracks “Relevant Volume” in real time, identifying accumulation and distribution processes, projecting them in the chart as SUPPORT or RESISTANCE zones. Natural   support   and resistance levels are generated by Volume Accumulation and Distribution processes. As these processes evolve, levels at which the relevant volume in the market place is positioned, become difficult areas to cross upwards or downwards. By using this information, traders can identify very s
Each bar graph is a brick, take buy a bill now as an example, the brick that is in lowest position at the moment, go to the left, when the brick with the 3rd highest is in existence, take the height of this brick as a benchmark, when the price exceeds the height of this brick, can establish buy a bill, when appear opposite circumstance closes a position, establish empty order at the same time. This is a simple rule, need each friend grope by oneself.
Owl Smart Levels MT5
Sergey Ermolov
4.47 (36)
MT4 versiyonu  |  FAQ Owl Smart Levels Indicator , Bill Williams'ın gelişmiş fraktalları , piyasanın doğru dalga yapısını oluşturan Valable ZigZag ve kesin giriş seviyelerini gösteren Fibonacci seviyeleri gibi popüler piyasa analiz araçlarını içeren tek gösterge içinde eksiksiz bir ticaret sistemidir. pazara ve kar elde edilecek yerlere. Stratejinin ayrıntılı açıklaması Gösterge ile çalışma talimatı Baykuş Yardımcısı ticaretinde Danışman Yardımcısı Kullanıcıların özel sohbeti -> Satın aldıktan
Simple ATR modern
Pavel Bereznichenko
Indicator  Simple ATR  Modern It is used in technical analysis to measure market volatility and show it as a level that is more understandable to the eye and not as an oscillator. ATR Daily - Blue The possibilities of using the ATR in trade can be found in the internet. It can also be used in conjunction with another author's indicator  Volatility Vision The Average True Range indicator measures market volatility. Volatility can be low while the market is growing (and vice versa). It is
AW Candle Patterns
AW Trading Software Limited
AW Mum Kalıpları göstergesi, güçlü bir mum kalıbı tarayıcı ile birleştirilmiş gelişmiş bir trend göstergesinin birleşimidir. En güvenilir otuz mum kalıbını tanımak ve vurgulamak için kullanışlı bir araçtır. Ek olarak, renkli çubuklara dayalı güncel bir trend analizörüdür.       yeniden boyutlandırılabilen ve konumlandırılabilen eklenti çoklu zaman çerçevesi trend paneli. Trend filtrelemeye bağlı olarak kalıpların görünümünü ayarlamak için benzersiz bir yetenek. Avantajlar: Mum desenlerini kolayc
PipFinite Exit EDGE MT5
Karlo Wilson Vendiola
4.89 (35)
Did You Have A Profitable Trade But Suddenly Reversed? In a solid strategy, exiting a trade is equally important as entering. Exit EDGE helps maximize your current trade profit and avoid turning winning trades to losers. Never Miss An Exit Signal Again Monitor all pairs and timeframes in just 1 chart www.mql5.com/en/blogs/post/726558 How To Trade You can close your open trades as soon as you receive a signal Close your Buy orders if you receive an Exit Buy Signal. Close your Sell orde
Volumes Direction MT5
William Oswaldo Mayorga Urduy
HACİM YÖNÜ MT5 Normalde, mevcut ses seviyesi öncekinden daha yüksek olduğunda ses seviyesi göstergesi varsayılan bir renk değişikliğine sahiptir, bu önemlidir ancak çok kullanışlı değildir. Bu nedenle, bu gösterge, normal hacme ek olarak, mum yükseliş veya düşüş olduğunda, onları farklı bir renge boyar, varsayılan olarak yükseliş için mavi ve düşüş için kırmızıdır, ancak bu renkler özelleştirilebilir. Tüccar tadı. Ticaretinizi geliştirmenize yardımcı olacak diğer göstergelerime göz at
Order Book, known also as Market Book, market depth, Level 2, - is a dynamically updated table with current volumes of orders to buy and to sell specific financial instument at price levels near Bid and Ask. MetaTrader 5 provides the means for receiving market book from your broker, but in real time only, without access to its history. The indicator OrderBook Cumulative Indicator accumulates market book data online and visualizes them on the chart. In addition, the indicator can show the market
Wapv Price and volume
Eduardo Da Costa Custodio Santos
MT5 için WAPV Fiyat ve Hacim Göstergesi, (Wyckoff Academy Wave Market) ve (Wyckoff Academy Fiyat ve Hacim) araç setinin bir parçasıdır. MT5 için WAPV Fiyat ve Hacim Göstergesi, grafikteki hacim hareketini sezgisel bir şekilde görselleştirmeyi kolaylaştırmak için oluşturuldu. Bununla, piyasanın profesyonel bir ilgisinin olmadığı en yüksek hacim anlarını ve anları gözlemleyebilirsiniz. Piyasanın "akıllı para" hareketiyle değil, ataletle hareket ettiği anları belirleyin. Kullanıcı tarafından değişt
Your Trend Friend
Luigi Nunes Labigalini
The trend is your friend! Look at the color of the indicator and trade on that direction. It does not  repaint. After each candle is closed, that's the color of the trend. You can focus on shorter faster trends or major trends, just test what's most suitable for the symbol and timeframe you trade. Simply change the "Length" parameter and the indicator will automatically adapt. You can also change the color, thickness and style of the lines. Download and give it a try! There are big movements
Before installing the HeatMap indicator make sure you are using a broker that gives you access to the Depth of market (DOM) !! This indicator creates a heatmap on your chart allowing you to see the buy or sell limit orders easily and in real time. You have the possibility to change the setting and the colors of the HeatMap in order to adapt to all markets and all charts. Here is an example of a setting you can use with the NASDAQ100 on the AMPGlobal broker :  https://www.youtube.com/watch?v=x0
Market Profile Heat indicator  — is a classic Market Profile implementation that can show the price density over time, outlining the most important price levels, value area, and control value of a given trading session. This indicator can be attached to timeframes between M1 and D1 and will show the Market Profile for daily, weekly, monthly, or even intraday sessions. Lower timeframes offer higher precision. Higher timeframes are recommended for better visibility. It is also possible to use a f
Market profile was developed by Peter Steidlmayer in the second half of last century. This is a very effective tool if you understand the nature and usage. It's not like common tools like EMA, RSI, MACD or Bollinger Bands. It operates independently of price, not based on price but its core is volume. The volume is normal, as the instrument is sung everywhere. But the special thing here is that the Market Profile represents the volume at each price level. 1. Price Histogram The Price Histogram
A "Volume Profile" is an advanced charting indicator that displays total volume traded at every price level over a user specified time period. The main components of the volume profile are POC ( Point Of Control - the price level, at which the maximum number of contracts were executed during a selected period), VAH ( Value Area High - the highest price in the Value Area) and VAL ( Value Area Low - the lowest price in the Value Area). When we settled on the original indicator, we spent a lot o
Bu göstergenin benzersizliği, hacim hesaplama algoritmasında yatmaktadır: birikim, günün başlangıcına bakılmaksızın doğrudan seçilen dönem için gerçekleşir. Son çubuklar hesaplamanın dışında tutulabilir, bu durumda mevcut veriler daha önce oluşturulan önemli seviyeler (hacimler) üzerinde daha az etkiye sahip olacaktır. Daha doğru bir hesaplama için varsayılan olarak M1 grafiğindeki veriler kullanılır. Fiyat hacimlerinin dağıtım adımı düzenlenir. Varsayılan olarak, ekranın sağ sınırı, analiz için
Bu ürünün alıcıları ayrıca şunları da satın alıyor
Gann Kare Göstergesi, W.D. Gann tarafından yazılan "Piyasa Tahminleri için Matematiksel Formül" makalesine dayalı güçlü bir piyasa analizi aracıdır. Bu araç, piyasa analizi için matematiksel ve Gann teorilerini kullanarak hassas analizler gerçekleştirir. 144, 90, 52 karelerini ve ayrıca 9 karesini kullanır. Ayrıca, ın 9 karesi ve bu kareyle ilişkili kanallar ve yıldız modelleri için yöntemini içerir. Kullanıcı Kılavuzu ve Uygulama: Bu göstergeleri kullanmadan önce, kullanıcı kılavuzunu okumanız
Bill Williams Advanced
Siarhei Vashchylka
5 (3)
Bill Williams Advanced is designed for automatic chart analysis using Bill Williams' "Profitunity" system. The indicator analyzes four timeframes at once. Manual (Be sure to read before purchasing) Advantages 1. Automatically analyzes the chart using the "Profitunity" system of Bill Williams. The found signals are placed in a table in the corner of the screen. 2. Equipped with a trend filter based on the Alligator indicator. Most of the system signals are recommended to be used only accordi
TrendMaestro5
Stefano Frisetti
note: this indicator is for METATRADER4, if you want the version for METATRADER5 this is the link:  https://www.mql5.com/it/market/product/108106 TRENDMAESTRO recognizes a new TREND in the bud, he never makes mistakes. The certainty of identifying a new TREND is priceless. DESCRIPTION TRENDMAESTRO identifies a new TREND in the bud, this indicator examines the volatility, volumes and momentum to identify the moment in which there is an explosion of one or more of these data and therefore the mome
Professional Scalping Tool on Deriv Attention! The indicator will be sold in limited quantities!!! Description: This trading indicator is designed for professional traders focused on scalping. Designed with the market in mind, it provides highly accurate spike trading signals. It works on the M1 timeframe and supports the following symbols: Boom 300 Index, Boom 500 Index, Boom 1000 Index, Crash 300 Index, Crash 500 Index, Crash 1000 Index. Functional Features: - Direction: - Trading is ca
IVISTscalp5
Vadym Zhukovskyi
5 (3)
We present you the iVISTscalp5 indicator, which is not only unique, but also effective in the analysis of trading operations. This indicator is based on time data and is the result of many years of experience and deep analysis of financial markets. The iVISTscalp5 indicator is an excellent assistant for manual trading. Convenience, simplicity and visualization. All the most difficult is hidden inside. We have simplified the settings and use of the iVISTscalp5 indicator as much as possible. The i
VTrende Pro
Andrii Diachenko
5 (1)
VTrende Pro - MTF indicator for trend trading with a display panel for MT5 *** Videos can be translated into any language using subtitles (video language - Russian) Although the signals of the VTrende Pro indicator can be used as signals of a full-fledged trading system, it is recommended to use them in conjunction with the Bill Williams TS. VTrende Pro is an extended version of the VTrende indicator. Difference between Pro version and VTrende: - Time zones - Signal V - signal 1-2 waves
Swing Trading is the first indicator designed to detect swings in the direction of the trend and possible reversal swings. It uses the baseline swing trading approach, widely described in trading literature. The indicator studies several price and time vectors to track the aggregate trend direction and detects situations in which the market is oversold or overbought and ready to correct. [ Installation Guide | Update Guide | Troubleshooting | FAQ | All Products ] Profit for market swings with
SMCpro MT5  Original Price  $440   ---  Currently Price  40% OFF  ( for unlimited use ) Hello World! Introducing.. SMCpro tool and Indicator for  MetaTrader 5 , a cutting-edge feature designed to revolutionize your trading experience. With innovative ICT Smart Money Concept, you gain unparalleled insight into market dynamics, empowering you to make informed trading decisions like never before. Built on the foundation of advanced algorithms and real-time data analysis, SMCpro tool and Indicat
Weis Wave with Alert MT5
Trade The Volume Waves Single Member P.C.
4.93 (15)
Rental/Lifetime Package Options and Privileges  * For optimum results the yearly or lifetime package is suggested due to live training ! Rent Monthly Six Months   Yearly/Lifetime Weis Wave with Speed with Alert+Speed Index x x x Manual  x x x Quick Set up Video x x x Blog x x x Lifetime Updates x x x Setup and Training Material x x Free Rectangle Break Alert Tool      x Discord Access Channel "The SI traders" x 2-hour live methodology training x How to trade with it:    http://
This is arguably the most complete harmonic price formation auto-recognition indicator you can find for the MetaTrader Platform. It detects 19 different patterns, takes fibonacci projections as seriously as you do, displays the Potential Reversal Zone (PRZ) and finds suitable stop-loss and take-profit levels. [ Installation Guide | Update Guide | Troubleshooting | FAQ | All Products ] It detects 19 different harmonic price formations It plots primary, derived and complementary Fibonacci p
Tricky to find and scarce in frequency, divergences are one of the most reliable trading scenarios. This indicator finds and scans for regular and hidden divergences automatically using your favourite oscillator. [ Installation Guide | Update Guide | Troubleshooting | FAQ | All Products ] Easy to trade Finds regular and hidden divergences Supports many well known oscillators Implements trading signals based on breakouts Displays suitable stop-loss and take-profit levels Configurable oscilla
"Piranha" - an autonomous trading system that determines overbought and oversold levels on the chart. Red and blue zones represent overbought and oversold levels respectively. Entry points are marked with arrows: a downward arrow in the red zone for "sell" and an upward arrow in the blue zone for "buy". The Take profit level is indicated by the green moving average. Key features: Adjusting the Take profit level as the green moving average changes position. Averaging ability when a new market e
Big Player Range
Thalles Nascimento De Carvalho
5 (2)
"BigPlayerRange" göstergeye hoş geldiniz, finansal kurumların piyasalardaki önemli ilgi alanlarını belirlemek için geliştirilmiş bir teknik analiz aracı. Bu gösterge, ana pazar katılımcılarının önemli bir aktivite ve ilgi gösterdiği fiyat aralıklarının kesin analizini sunar. Temel Özellikler: 1. Kurumsal İlgi Alanlarının Haritalanması: "BigPlayerRange", finansal kurumların güçlü aktivite gösterdiği grafik alanlarını kesin olarak vurgular. Bu noktalar stratejik olarak önemlidir ve olası piy
Introduction to X3 Chart Pattern Scanner X3 Cherart Pattern Scanner is the non-repainting and non-lagging indicator detecting X3 chart patterns including Harmonic pattern, Elliott Wave pattern, X3 patterns, and Japanese Candlestick patterns. Historical patterns match with signal patterns. Hence, you can readily develop the solid trading strategy in your chart. More importantly, this superb pattern scanner can detect the optimal pattern of its kind. In addition, you can switch on and off individu
Gösterge, İKİLİ SEÇENEKLER için giriş sinyalleri üretir, grafikte bir ok çizer ve sesli bir uyarı verir. ÇALIŞMA SAATLERİ: 6.OO GMT/ 17.00 GMT (17.00 GMT'den sonra ve gece çok düşük volatilite ve hacim eksikliği nedeniyle önerilmez) ÇİFTLER: EUR/USD (@EU6), GBP/USD (BP6). Zaman dilimleri: 1,2,3,5,10,15 dakika En iyi zaman aralığı: 3 dakika SON KULLANMA TARİHİ: 1 mum Göstergenin çalışması için gerçek hacimlere (onay hacmi yok) ihtiyacı vardır: EUR/USD, GBP/USD ECC spot çiftlerinde çalı
Multi-currency, multi-timeframe, harmonic pattern indicator AB = CD. Supports sending push notifications about signals to a mobile device, messages on e-mail, as well as messages using alerts on all available currency pairs and timeframes. This indicator was based on the indicator Harmonic ABCD Universal. Version for MetaTrader 5:  https://www.mql5.com/en/market/product/44972 . See also: Harmonic ABCD Universal for MetaTrader 4 . Using modern software development methods has made the indicator a
The indicator is designed to close positions on the market in time. For example: to take profits ahead of schedule if the price has not reached TakeProfit, and the market is turning around. The indicator analyzes the momentum, not the trend. He does not give any information about the trend. The indicator is well suited for finding divergence. The Ershov 38 Parrots indicator dynamically adjusts to the market and detects price movement impulses of medium and high amplitude. It almost does not rea
Bu gösterge, W.D. Gann'ın dokuzun karesi ve 144'ün karesine bağlı olarak yazdığı "Piyasa tahminleri için matematiksel formül" makalesine dayanan bir piyasa analiz yöntemidir. Kullanım kılavuzu: Add Your review And contact us to get it Tam MT4 Sürümünü Şunlardan Satın Alabilirsiniz: https://www.mql5.com/en/market/product/15316 MT4'te ücretsiz olarak test edebilirsiniz: https://www.mql5.com/en/market/product/15320?source=Site +Profile+Seller#!tab=reviews Bu ürün sizin için Düz
PZ Trend Trading MT5
PZ TRADING SLU
3.67 (3)
Trend Trading is an indicator designed to profit as much as possible from trends taking place in the market, by timing pullbacks and breakouts. It finds trading opportunities by analyzing what the price is doing during established trends. [ Installation Guide | Update Guide | Troubleshooting | FAQ | All Products ] Trade financial markets with confidence and efficiency Profit from established trends without getting whipsawed Recognize profitable pullbacks, breakouts and early reversals The ind
Elliot Waves Analyzer Pro
Viktor Weidenthal
3.25 (4)
Elliot Waves Analyzer Pro calculates Elliot Waves to Help Identify Trend direction and Entry Levels. Mainly for Swing Trading Strategies. Usually one would open a Position in trend direction for Wave 3 or a Correction for Wave C . This Indicator draws Target Levels for the current and next wave. Most important Rules for Elliot Wave Analysis are verified by the Indicator.  The Pro version analyzes Multiple Timeframes and shows the Subwaves and Target-Levels.   For an Overview  " Elliot Waves Anal
Elliott Wave Trend was designed for the scientific wave counting. This tool focuses to get rid of the vagueness of the classic Elliott Wave Counting using the guideline from the template and pattern approach. In doing so, firstly Elliott Wave Trend offers the template for your wave counting. Secondly, it offers Wave Structural Score to assist to identify accurate wave formation. It offers both impulse wave Structural Score and corrective wave Structure Score. Structural Score is the rating to sh
PZ Day Trading MT5
PZ TRADING SLU
2.83 (6)
This indicator detects price reversals in a zig-zag fashion, using only price action analysis and a donchian channel. It has been specifically designed for short-term trading, without repainting or backpainting at all. It is a fantastic tool for shrewd traders aiming to increase the timing of their operations. [ Installation Guide | Update Guide | Troubleshooting | FAQ | All Products ] Amazingly easy to trade It provides value on every timeframe It displays suitable SL and TP levels It impl
Good day! I present to you a trading technical indicator for Deriv broker synthetic indices. This indicator ONLY works with the following indices: Boom 300 Index Boom 500 Index Boom 1000 Index Crash 300 Index Crash 500 Index Crash 1000 Index The indicator was created to give signals to open medium-term trades in the direction of Spikes. But you can open trades in the opposite direction to Spikes, at your own risk. Trade only on M1. Other TFs do not guarantee the correct operation of the indic
Tatino Super Signals is Non Repaint Indicator for Binary Option trading and Forex trading. Recommendations: Timeframe: All timeframes. For best results we recommend using it on M1, M5 and M15 timeframes. Currency pairs: All Pairs Account type: All Type Broker time: Any Brokers : Alls Binary Trading : Expired 1 Candle Buffer Buy=1, Sell=0, Entry Next Candle Recommended Forex trading stop loss : 15 pips Recommended  Forex tradingTake profit levels : 15 pips Specifications: Does not repaint  
Smooth price for Monarch
Konstantin Gruzdev
5 (1)
The Smooth Price technical indicator is used for plotting a smoothed line as close to the price of the financial instrument as possible, and serves to eliminate its noise components. The indicator is part of the Monarch trading system, but here it is presented as an independent technical analysis tool. The indicator is based on the cluster digital filter , which, unlike the ClusterSMA , is applied directly to the price time series. Smooth Price does not redraw (except the very last, zero bar) an
How to use Pair Trading Station Pair Trading Station is recommended for H1 time frame and you can use it for any currency pairs. To generate buy and sell signal, follow few steps below to apply Pair Trading Station to your MetaTrader terminal. When you load Pair Trading Station on your chart, Pair Trading station will assess available historical data in your MetaTrader platforms for each currency pair. On your chart, the amount of historical data available will be displayed for each currency pai
Ortalama geri dönüş ticareti için profesyonel ve nicel bir yaklaşım uygulayan benzersiz gösterge. Fiyatın tahmin edilebilir ve ölçülebilir bir şekilde ortalamaya döndüğü ve yön değiştirdiği gerçeğinden yararlanır, bu da nicel olmayan ticaret stratejilerinden büyük ölçüde daha iyi performans gösteren net giriş ve çıkış kurallarına izin verir. [ Installation Guide | Update Guide | Troubleshooting | FAQ | All Products ] Ticaret sinyallerini temizle Ticaret yapmak inanılmaz derecede kolay Özelleş
This is the famous Sunflower indicator for Metatrader5. This indicator marks possible tops and bottoms on price charts. The indicator identifies tops and bottoms in the asset's price history, keep in mind that the current sunflower of the last candle repaints, as it is not possible to identify a top until the market reverses and it is also not possible to identify a bottom without the market stop falling and start rising. If you are looking for a professional programmer for Metatrader5, please
ZigZag de Suavizador
Cesar Juan Flores Navarro
Teniendo una entrada de precios suavizados, los cuales son procesador por un ZigZag en tiempo real, dando como resultado un suavizador ajustado a un ZigZag. Con valores de entrada (periodo) mayores se vuelve un poco lenta en M1,, Ideal para H1, H4, D1 Trabaja bien con otros suavizadores, ya que su intersección es ideal Al iniciar empiza con mayor precisión desde el momento de activación, siendo el historial (anterior) de referencia ----------------------------------------------------------------
Recommended TimeFrame >= H1. 100% Non Repainted at any moment.  Use it carefully, only with Trend Direction. Trading Usage: 2 Variants: as Range System or as BreakOut System (Both Only With Trend Direction)::: (Always use StopLoss for minimise Risk); [1] as Range System: (Recommended) in UP TREND:  - BUY in Blue Line , then if price goes down by 50 points (on H1) open Second BUY.   Close in any Profit you wish: TrailingStop(45 points) or Close when Price touches upper Gold Line. in DOWN TR
Yazarın diğer ürünleri
FX Power MT5 NG
Daniel Stein
5 (4)
Sabah Brifingimiz burada mql5 ve on Telegram! FX Power MT5 NG , uzun zamandır çok popüler olan döviz gücü ölçerimiz FX Power'ın yeni neslidir. Peki bu yeni nesil güç ölçer ne sunuyor? Orijinal FX Power hakkında sevdiğiniz her şey PLUS GOLD/XAU güç analizi Daha da hassas hesaplama sonuçları Ayrı ayrı yapılandırılabilir analiz dönemleri Daha da iyi performans için özelleştirilebilir hesaplama limiti Özel çokluDaha fazlasını görmek isteyenler için örnek ayarlar Her grafikte en sevdiğiniz renkler i
SIEA PRO NG , SIEA PRO'nun yeni neslidir ve şirketimizin önceki tüm EA'larından tamamen farklıdır. Gösterilen fiyatlar SIEA PRO NG'nin piyasaya sürülmesi için indirimli fiyat lardır! Bir bakışta önemli bilgiler ortalama geri dönüş stratejisi ticareti yapar 5 tam yıllık benzersiz gerçek hacim verilerimize dayanmaktadır her işlem sabit bir zararı durdurma ve kar alma ile birlikte gelir ortalama ticaret süresi 48 saatten azdır bireysel ince ayar için birçok seçenek ızgara yok, martingale yok FIF
FX Power MT4 NG
Daniel Stein
5 (8)
Sabah Brifingimiz burada mql5 ve on Telegram! FX Power MT4 NG , uzun zamandır çok popüler olan döviz gücü ölçerimiz FX Power'ın yeni neslidir. Peki bu yeni nesil güç ölçer ne sunuyor? Orijinal FX Power hakkında sevdiğiniz her şey PLUS GOLD/XAU güç analizi Daha da hassas hesaplama sonuçları Ayrı ayrı yapılandırılabilir analiz dönemleri Daha da iyi performans için özelleştirilebilir hesaplama limiti Özel çokluDaha fazlasını görmek isteyenler için örnek ayarlar Her grafikte en sevdiğiniz renkler i
FX Volume
Daniel Stein
4.6 (35)
Sabah Brifingimiz aracılığıyla ayrıntılar ve ekran görüntüleri ile günlük piyasa güncellemenizi alın burada mql5 ve on Telegram ! FX Volume, bir brokerin bakış açısından piyasa duyarlılığı hakkında GERÇEK bir fikir veren İLK ve TEK hacim göstergesidir. COT raporlarından çok daha hızlı bir şekilde, brokerlar gibi kurumsal piyasa katılımcılarının Forex piyasasında nasıl konumlandıklarına dair harika bilgiler sağlar. Bu bilgileri doğrudan grafiğinizde görmek, ticaretiniz için gerçek oyun değiştir
IX Power MT4
Daniel Stein
5 (5)
IX Power nihayet FX Power'ın rakipsiz hassasiyetini Forex dışı sembollere getiriyor. En sevdiğiniz endeksler, hisse senetleri, emtialar, ETF'ler ve hatta kripto para birimlerindeki kısa, orta ve uzun vadeli eğilimlerin yoğunluğunu doğru bir şekilde belirler. Terminalinizin sunduğu her şeyi analiz edebilirsiniz. Deneyin ve işlem yaparken zamanlamanızın nasıl önemli ölçüde iyileştiğini deneyimleyin. IX Power Temel Özellikler 100 hassas, yeniden boyanmayan hesaplama sonuçları - terminalini
IX Power MT5
Daniel Stein
5 (2)
IX Power   nihayet FX Power'ın rakipsiz hassasiyetini Forex dışı sembollere getiriyor. En sevdiğiniz endeksler, hisse senetleri, emtialar, ETF'ler ve hatta kripto para birimlerindeki kısa, orta ve uzun vadeli eğilimlerin yoğunluğunu doğru bir şekilde belirler. Terminalinizin sunduğu   her şeyi analiz   edebilirsiniz. Deneyin ve işlem yaparken   zamanlamanızın   nasıl   önemli ölçüde iyileştiğini   deneyimleyin. IX Power Temel Özellikler 100 hassas, yeniden boyanmayan hesaplama sonuçları -
FX Trend MT5
Daniel Stein
4.67 (36)
Visit our all-new   Stein Investments Welcome Page   to get the latest information, updates and trading strategies. Do you want to become a constantly profitable 5-star forex trader? Then  get our Stein Investments trading tools  and send us a screenshot to get your personal invitation to our exclusive trading chat with 500+ members. FX Trend displays the trend direction, duration, intensity and the resulting trend rating for all time frames in real time. You'll see at a glance at which dire
FX Trend
Daniel Stein
4.85 (97)
Visit our all-new   Stein Investments Welcome Page   to get the latest information, updates and trading strategies. Do you want to become a constantly profitable 5-star forex trader? Then  get our Stein Investments trading tools  and send us a screenshot to get your personal invitation to our exclusive trading chat with 500+ members. FX Trend   displays the trend direction, duration, intensity and the resulting trend rating for all time frames in real time. You'll see at a glance at which di
Lighthouse MT5
Daniel Stein
5 (18)
Visit our all-new   Stein Investments Welcome Page   to get the latest information, updates and trading strategies. Do you want to become a constantly profitable 5-star forex trader? Then  get our Stein Investments trading tools  and send us a screenshot to get your personal invitation to our exclusive trading chat with 500+ members. Lighthouse   is an outstanding precise and reliable support and resistance indicator. It displays the most important trading levels and draws them according to
Visit our all-new Stein Investments Welcome Page to get the latest information, updates and trading strategies. Do you want to become a constantly profitable 5-star forex trader? Then get our Stein Investments trading tools  and send us a screenshot to get your personal invitation to our exclusive trading chat with 500+ members. The Trade Manager MT5 is the ideal addition for all  FX Trend  users which like to use a fully automated trade management. It detects your manually opened trades imme
SIEA PRO NG SIEA PRO'nun yeni neslidir ve şirketimizin önceki tüm EA'larından tamamen farklıdır. Gösterilen fiyatlar SIEA PRO NG'nin piyasaya sürülmesi için indirimli fiyat lardır ! Gerçek zamanlı çoklu sembol geri testi yapmak için lütfen SIEA PRO NG MT5 sürümünü kullanın. Bir bakışta önemli bilgiler ortalama geri dönüş stratejisi ticareti yapar 5 tam yıllık benzersiz gerçek hacim verilerimize dayanmaktadır her işlem sabit bir zararı durdurma ve kar alma ile birlikte gelir ortalama ticaret sü
SIEA Zen
Daniel Stein
4 (4)
SIEA ZEN - major update   Default risk live signal     Dynamic risk live signal TRADING STYLE SIEA ZEN trades all 28 trading pairs based on the 8 major currencies, USD, CAD, EUR, CHF, GBP, AUD, NZD, and JPY. Our unique volume analysis determines market imbalance and how intense they are to spot reverse entry opportunities. SIEA ZEN  closes all its positions at the end of every month and starts a new cycle at the beginning of the next month. In this way, we'll achieve an awesome
SIEA ZEN - major update   Live signals We recommend using the SIEA MT5 versions to run realistic real-tick multi-symbol backtest. TRADING STYLE SIEA ZEN   trades all 28 trading pairs based on the 8 major currencies, USD, CAD, EUR, CHF, GBP, AUD, NZD, and JPY. Our unique volume analysis determines market imbalance and how intense they are to spot reverse entry opportunities. SIEA ZEN  closes all its positions at the end of every month and starts a new cycle at the beginning of the ne
Visit our all-new   Stein Investments Welcome Page   to get the latest information, updates and trading strategies. Do you want to become a constantly profitable 5-star forex trader? Then  get our Stein Investments trading tools  and send us a screenshot to get your personal invitation to our exclusive trading chat with 500+ members. Crosshair is a fantastic tool that simplifies our chart analysis by bringing the price candles perfectly in line with the indicator values in the subwindows.
Visit our all-new   Stein Investments Welcome Page   to get the latest information, updates and trading strategies. Do you want to become a constantly profitable 5-star forex trader? Then  get our Stein Investments trading tools  and send us a screenshot to get your personal invitation to our exclusive trading chat with 500+ members. This Trade Manager is the ideal addition for all  FX Trend  users which like to use a fully automated trade management. It detects your manually opened trades im
SI Connect is a utility that establishes the connection to our servers to use FX Volume or the SIEA trading systems. Technical instructions to prepare your terminal for the usage of SI Connect Allow web requests and insert https://stein.investments to the list of allowed URLs in your Terminal Options -> Subcategory Expert Advisors . You need only one running EA instance per terminal, but it has to run constantly in the background to grab the latest data from our data centre. In case of quest
FREE
Lighthouse
Daniel Stein
4.85 (96)
Visit our all-new   Stein Investments Welcome Page   to get the latest information, updates and trading strategies. Do you want to become a constantly profitable 5-star forex trader? Then  get our Stein Investments trading tools  and send us a screenshot to get your personal invitation to our exclusive trading chat with 500+ members. Lighthouse   is an outstanding precise and reliable support and resistance indicator. It displays the most important trading levels and draws them according to
SI Connect is a utility that establishes the connection to our servers to use FX Volume or the SIEA trading systems. Technical instructions to prepare your terminal for the usage of SI Connect Allow web requests and insert https://stein.investments to the list of allowed URLs in your Terminal Options -> Subcategory Expert Advisors . You need only one running EA instance per terminal, but it has to run constantly in the background to grab the latest data from our data centre. In case of quest
FREE
Visit our all-new   Stein Investments Welcome Page   to get the latest information, updates and trading strategies. Do you want to become a constantly profitable 5-star forex trader? Then  get our Stein Investments trading tools  and send us a screenshot to get your personal invitation to our exclusive trading chat with 500+ members. Crosshair is a fantastic tool that simplifies our chart analysis by bringing the price candles perfectly in line with the indicator values in the subwindows. You
Filtrele:
indaplace2be
39
indaplace2be 2024.04.02 16:04 
 

fast and awesome support from Mr. Daniel! Great indicator! Thank you sir!

sclaudio
24
sclaudio 2024.01.18 20:36 
 

FX VOLUME : EXCELENTE INDICADOR, ESTOU MUITO FELIZ COM ELE ! OBRIGADO DANIEL.

raulovalle
90
raulovalle 2023.12.23 22:34 
 

Hello ... I bought the FX Volume and I must have a fact to add me to the telegram or it is the same telegram they use in general.

Daniel Stein
91114
Geliştiriciden yanıt Daniel Stein 2023.12.23 22:38
Hello raulovalle, I sent you an invitation via private message. Please check your inbox on mql5. Best regards and happy holidays, Daniel
Oliver Henry
593
Oliver Henry 2023.07.24 22:20 
 

Very good indicator and totally unique on the retail forex market. The insight a trader can get from this is a real edge for trading. The support is also very good as are the daily updates that are published on the chat group.

Daniel Stein
91114
Geliştiriciden yanıt Daniel Stein 2023.07.24 22:28
Thank you so much for your positive feedback. It's highly appreciated. 🙏
bandelero
429
bandelero 2023.06.16 16:15 
 

I have now closed the second week of trading with FX Power and FX Volume with net gain of 2.7%. I am really pleased how the indicators gives me a quick overview of the market and help me to choose the relevant currency to trade for the day.

Daniel Stein
91114
Geliştiriciden yanıt Daniel Stein 2023.06.17 12:54
Thank you so much for your wonderful feedback. 🙏
Khuman Bakhramirad
9082
Khuman Bakhramirad 2023.05.18 13:15 
 

its an amazing indicator, once you combine it with other tools its very good.

Daniel Stein
91114
Geliştiriciden yanıt Daniel Stein 2023.05.18 13:23
Thank you so much for your positive feedback. It's highly appreciated. 🙏
Oliver Hesse
1108
Oliver Hesse 2022.09.22 21:26 
 

Kullanıcı incelemeye herhangi bir yorum bırakmadı

Daniel Stein
91114
Geliştiriciden yanıt Daniel Stein 2022.09.23 09:15
Oh, Oliver, I'm so tired of your childish attitude, but you force me to clarify some things for the public. You bought some tools and NOT us or our company. This means we do NOT have to code anything you think is an improvement. Of course, we take care of bugs if we can reproduce them. Try it yourself by opening a blank new chart and try to reproduce the issue you think of it's a bug. If everything works on this new chart, it's a problem with the setup you created. That's what we explained so often.
And then there are technical limitations of our current product series, which hundreds of other users can easily live with but not you. We know them and designed a new panel technique already available at FX Volume and will be available with the next generation of our other tools. You ignore that there are hundreds of other users besides you. A fundamental redesign of a productive tool is too risky, and that's why every creator, author and software company provides an entirely new version every now and then. So the "old" users are happy, and the new generation users are pleased with the new features. And everyone can switch or use both as they want. I doubt you'll ever understand that, but we honestly don't care. We had endless chats with you, and it's simply hopeless, so please accept that we, as a company, have our own plans for our customers and products. Our chat rules are fair and transparent, and doing marketing for other publishers is simply unacceptable. Besides that, everyone gets the help he needs, but it's clear that we don't have the time to offer individual coaching; hence we have the central Link Library with useful basic information for all users. If there are questions, users can drop them in the group, and other more experienced users or we answer. We're happy to have constantly profitable traders taking their trades solely based on our tools and sharing their knowledge with the crowd. If this isn't enough for you to get rich, we can't help you. Getting rich is a question of attitude and posting your "review" on all 4 product pages makes it even more evident that this is something personal because you don't get your will. Enjoy the audience. We're done with you.
Robert Torres Jr
1589
Robert Torres Jr 2022.06.15 07:07 
 

I am beyond impressed with the pre-purchase support that I have received thus far from Daniel. I've reviewed the telegram groups and I bought the Lighthouse, Powerplay Trade Manager, SIEA Pro, FX Power, FX Trend, and FX Volume (Did I miss any necessary tool?) I am excited to start learning to trade according to this strategy. I'll give more feedback as I start my trading journey with the Stein Investment Group of Traders.

Lester David Saldana Reyes
338
Lester David Saldana Reyes 2021.12.20 16:55 
 

Muy bueno, hace pocas horas lo instalé y está dando buenos resultados, espero siga así. Estaré actualizando la información y datos. La respuesta del creador de este indicador es rápida.

Nick167
49
Nick167 2021.05.22 00:27 
 

I purchased Stein Investments tools for MT5, also FX Volume. And they make a good impression. I learn to use them effectively. I already have a few questions that I will gladly ask after adding me to the forum :) I know for sure that one more application would be useful, which would give signals on the basis of all the others, connecting them together. I mean calculating the most precise inputs and outputs based on FX Power, FX Volume and FX Trend. Perhaps it will be an improved version of Trade Manager? That's a question for Daniel :)

Daniel Stein
91114
Geliştiriciden yanıt Daniel Stein 2021.05.24 10:43
Hi Nick, I sent you the invitation to our group chat. In the Link Library of this chat, you'll find a link to the STS dashboard, a tool that summarizes the information of the individual indicators and alerts you based on your individual settings. Best regards, Daniel
Alex East
100
Alex East 2021.02.19 17:58 
 

I have been using FX Volume for around 4-5 months and I can not rate it highly enough. Along, with the rest of Stein's tools they were a real gamechanger for me after years of struggling to find an edge in the market and personally I feel that FX Volume is the most powerful of the lot. Customer service is superb - any issues at all and Daniel is always willing to help. Regular updates - the indicator just keeps on getting better. NB: Like with any indicator, Steins suite of tools are best used in conjuction with technical analysis. If used in this way they are extremely powerful.

Luke Perrett
3346
Luke Perrett 2021.02.09 23:05 
 

Amazing tool. Great insight into the market. Continually updating to get a closer edge. No crap telegram group. Great team behind all of Steins products. Find me a better product than this. Good luck. Keep up the amazing work Stein team, we need you!!

Andre Gomes
2771
Andre Gomes 2021.02.06 20:05 
 

Excellent tool. I cannot thank Daniel and Alain enough for building this amazing tool, which truly gives you and edge to trade forex markets.

CaesarX
319
CaesarX 2021.01.10 09:28 
 

FxVolume has become the most important tool at my disposal, I simply couldn't go without it

Boriwan
647
Boriwan 2020.10.26 20:10 
 

Отличная работа! Спасибо!

Joshua Jeffries
123
Joshua Jeffries 2020.10.22 15:31 
 

I have had this indicator now for the best part of 6 months. I find the insights extremely useful and has saved my skin a few times. Trades i would've normally taken nullified by this indicator. I find it great for swing trading as I can see the volume changing in real time and start to move in the direction i am anticipating. Used in conjunction with the other tools in the box you will find great results. The community is top notch and also run community projects for EA's and Dashboards, the subscription alone is worth that. There are several strategies to use the tools and suits every trader. We have low TF traders in the group M1-M5 and also people like me H1 - D1, and we all seem to be getting great results! For what you get, the price alone is absolutely a steal, it will add so much value to your trading i can't even describe. Since starting my account is up over 500% so yeah, speaks for itself. If you are interested in the closed thing you'll get to an institutional tool on MQL, well, this is it.

The most useful info are

LOTS

Percentage of long trades

Once you see these increasing for one pair, it is almost a sure thing the price is going to follow. The subscription is so cheap you can't not try it. I can't thank Daniel and the guys in the group enough!

Stephan Grobler
152
Stephan Grobler 2020.08.29 12:58 
 

Excellent tool!

Aravind Kolanupaka
8830
Aravind Kolanupaka 2020.06.27 18:59 
 

So many ways to use the data and confirm trades.

RDI
1482
RDI 2020.04.01 22:04 
 

Great Indicator . Thanks Daniel!!

İncelemeye yanıt
Sürüm 4.55 2023.08.30
Fixed bug when symbols alert enabled
Sürüm 4.53 2023.08.01
Added INSTANCE_ID input parameter

Fixed GOLD bug, shifting all currencies data
Sürüm 4.52 2023.07.31
Fixed iCustom call, sometimes displaying the panel

Added Gold input parameters, and updated to use last framework changes
Sürüm 4.50 2023.07.26
Fixed invalid pointer, framework bug when no history lines are displayed

Fixed bug in loading FXV parameters
Sürüm 4.48 2023.07.24
Fixed minor bugs

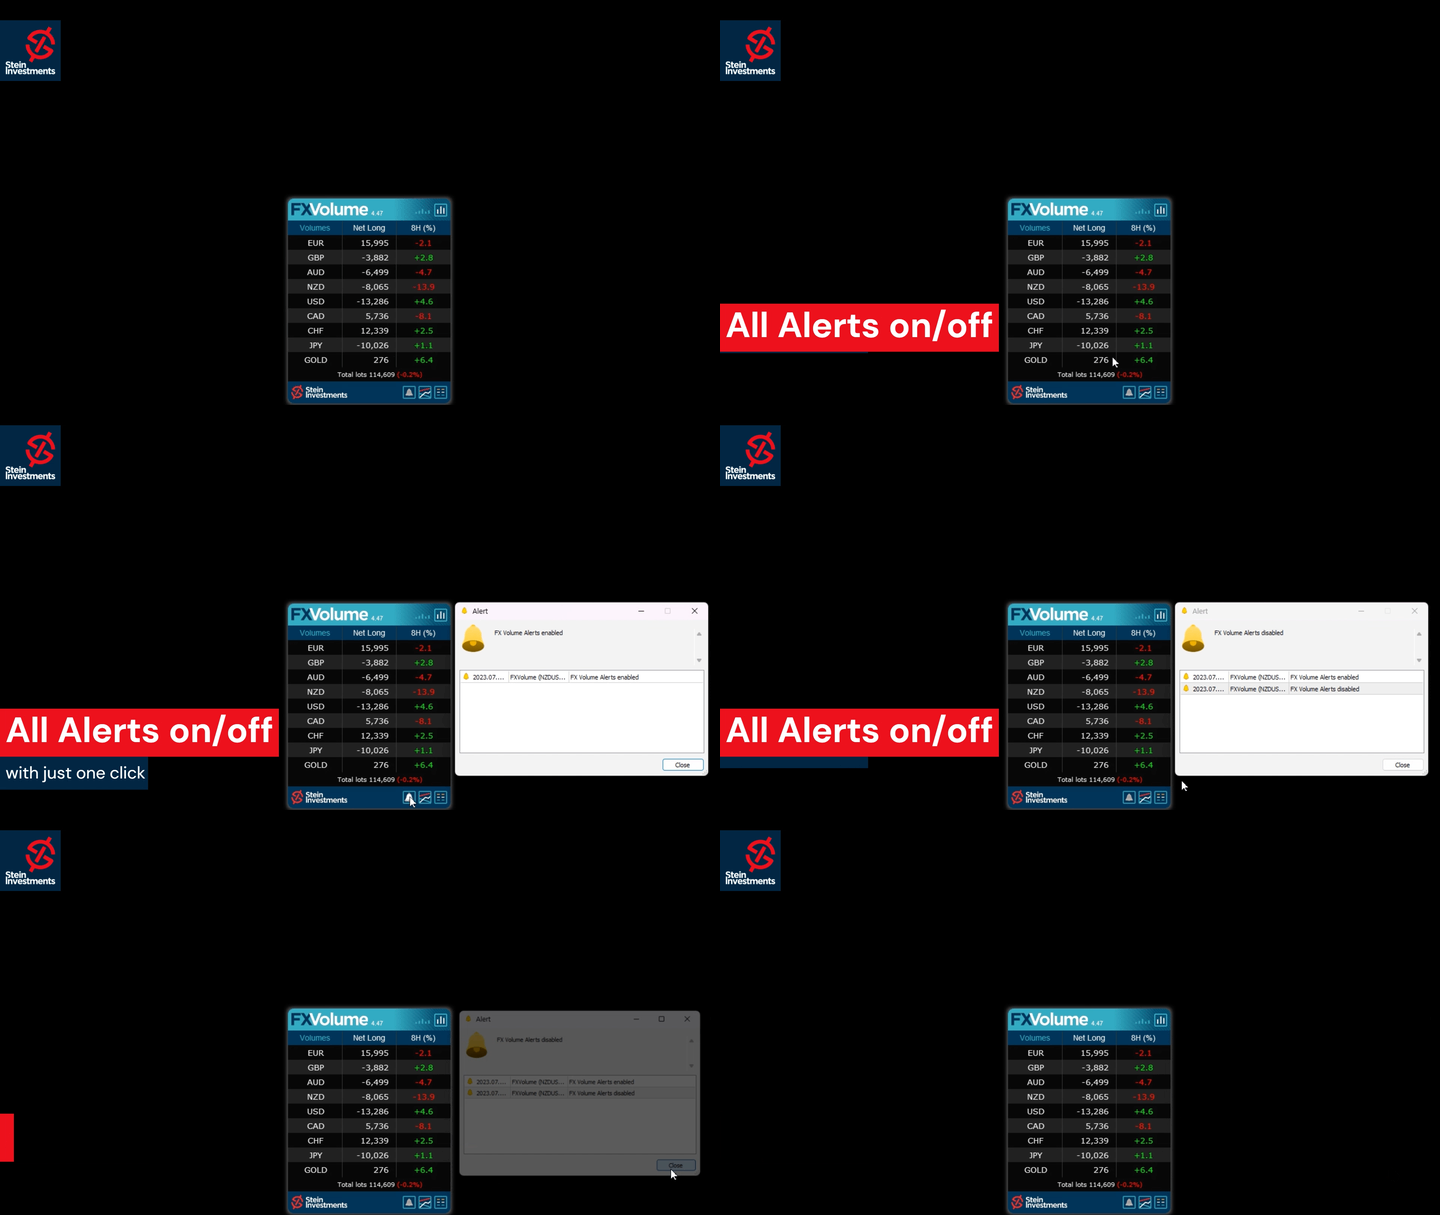
Added an alert button in the panel

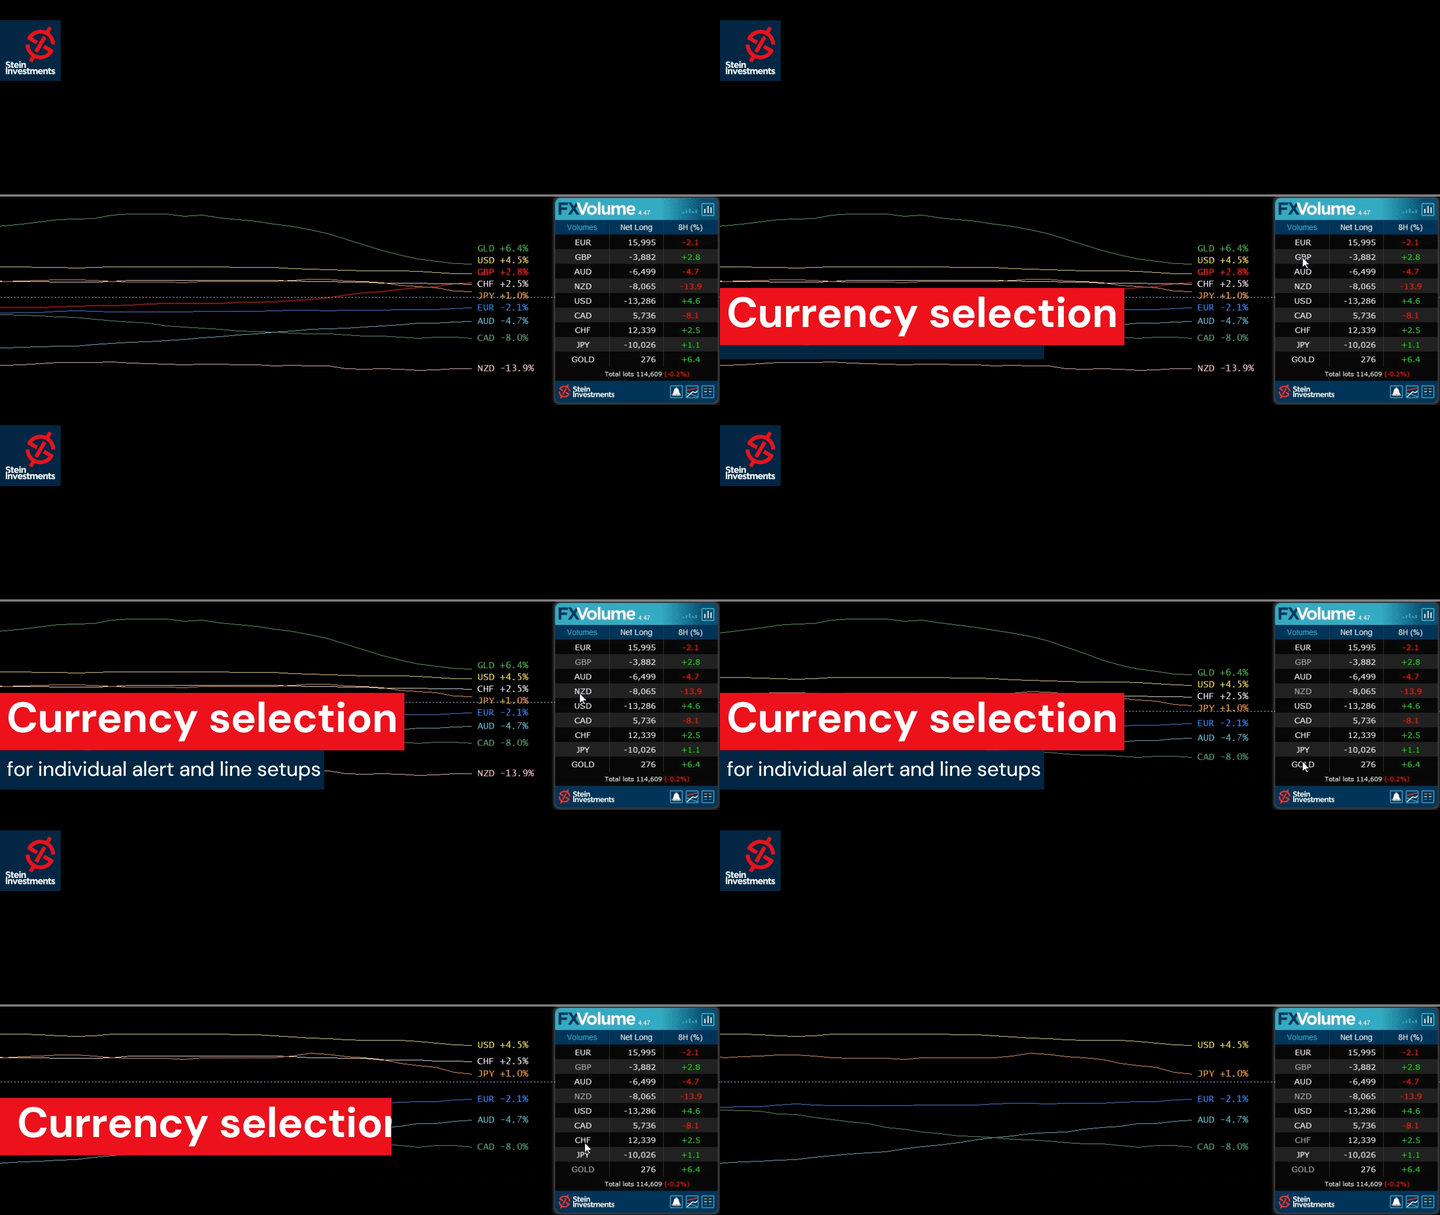
Alerts are now individually configurable according to currencies selected

Update with last framework and generic changes

Changed input parameters (without effect on iCustom requests)

Changed currency sorting in the panel following a logical convention for symbol names
Sürüm 4.42 2023.06.01
Fixed GUI DPI adjustment bug
Sürüm 4.41 2023.06.01
⚠️Due to necessary changes in our panel management, you have to reconfigure your charts once after the update⚠️

New Features
Added history mode "Net Long % change"
Added new main panel view "Net long % change"
Added alerts for "Net long % change" drop & rise

Changed indicator label on chart to display one decimal at % values
Changed indicator digits according to history mode
Changed the zoom factor to use % values
Symbols list refactoring as a new panel


Graphics
New rounded corner panel design.
Added a different color for the "Past" data column.
Added input for panel back color if the auto-scheme is disabled
Improved plot labels display to avoid overlapping. (MT5 only)


Under the hood
Apply complete internal refactoring
Apply the last framework update
Sürüm 4.10 2022.03.08
Fixed resource loading issue on some Mac/Linux systems

Fixed graphical panel bug when missing past data
Sürüm 4.0 2022.03.02
FX Volume 4.0 comes with two additional features.

1. The option to use the internal comparison calculation on a minute basis which allows comparison below our previous minimum of 1 hour.

2. Inspired by our fellow trader Luke, we created a Net Long Volume view including history lines to understand better how the Net Long volume correlates with the market moves we see on the chart.

Check our Stein Investments YouTube channel to see a video of the new features.

We're sure you'll like the new features.
Sürüm 3.58 2021.09.01
Optimized FX Volume to be fully compatible with MT4/MT5 templates
Sürüm 3.53 2021.05.08
Transition version to use data in common data folder

Fixed bug with GMT when running FX Volume on a weekend for the first time

Optimizations when used as free demo version in the strategy tester


Sürüm 3.50 2021.04.08
Fixed minor bug when alerts are enabled
Sürüm 3.49 2021.04.01
This update contains the following changes:

- New Alert options based on Long and Short Volume
- New Alert filters based on the dominance of one side available,
i.e. if Volume Long is bigger than Volume Short, you'll get only alerts for the Volume Long side
- Improved communication with the new SI Connect 2.x
- Optimized settings managements

and these changes are related to the strategy tester usage

- Fixed current candle update bug
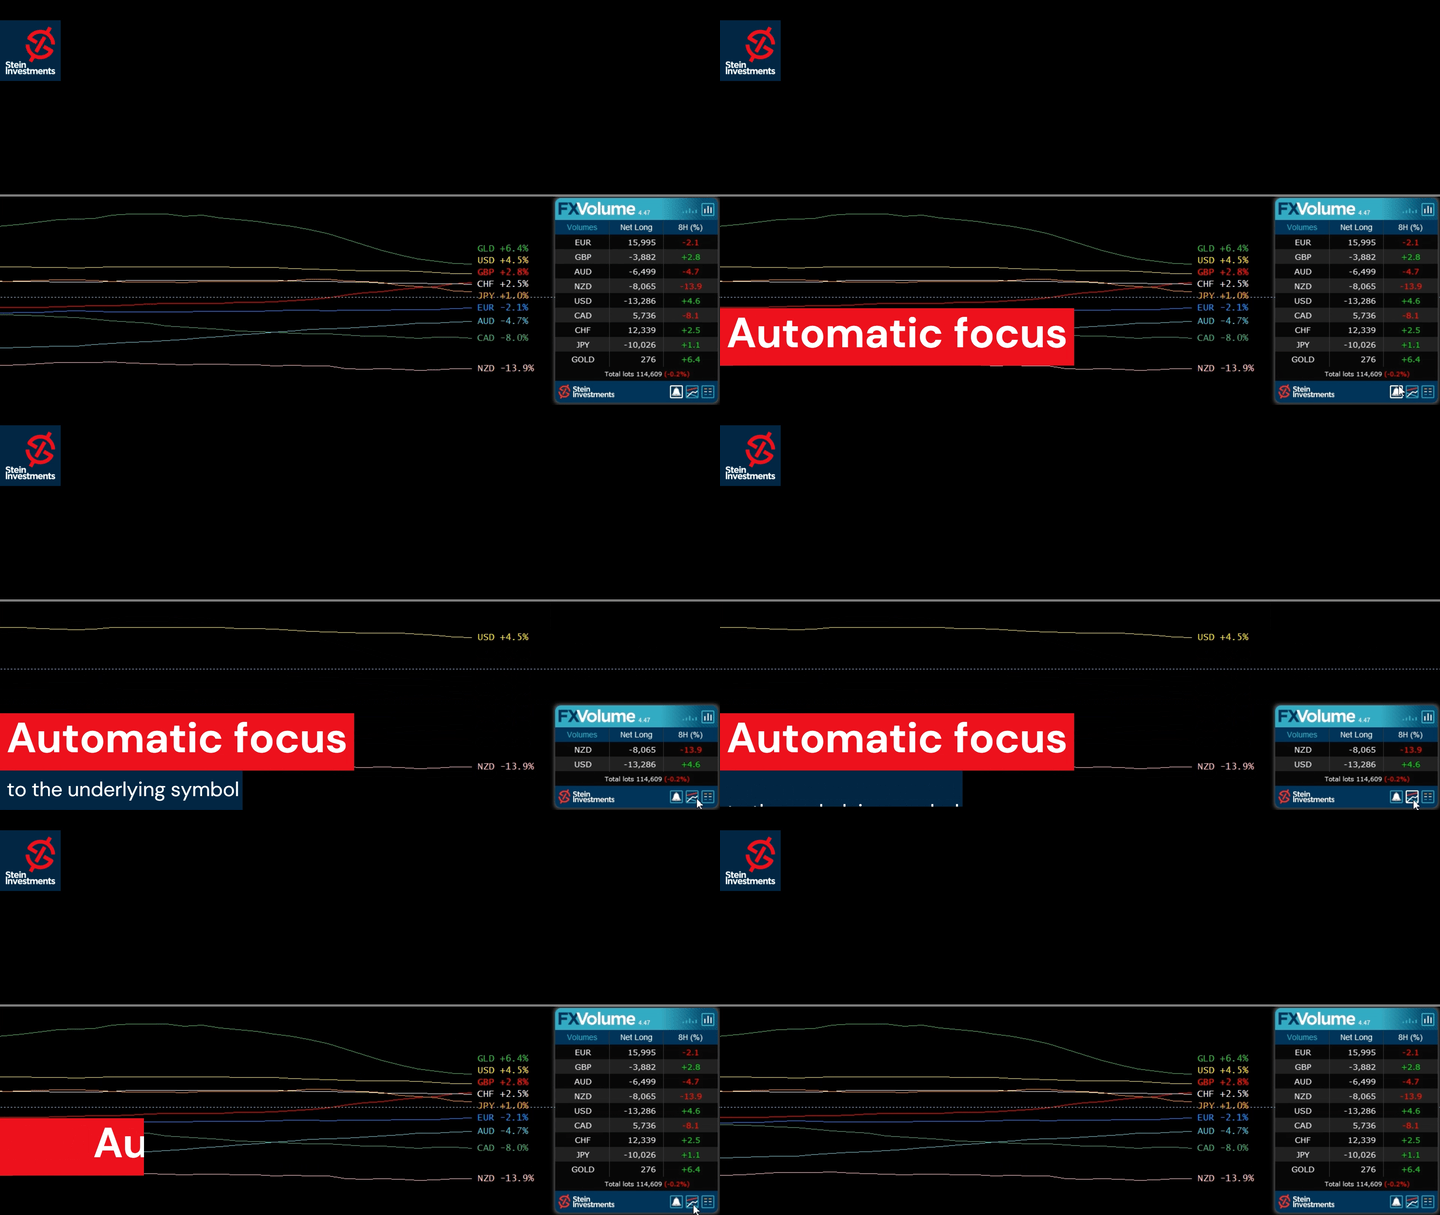
- Added parameter to start with a focus on chart currencies
- Improved backtesting performance
Sürüm 3.35 2021.03.11
Fixed M1 issue when used in the strategy tester
Sürüm 3.34 2021.03.10
Fixed row labels in Changes view
Sürüm 3.33 2021.03.10
Internal refactoring
Changed SI Connect detection method
Improved performance when used in the strategy tester
Sürüm 3.28 2021.02.26
FX Volume GUI enabled in Strategy Tester visual mode when called via iCustom
Sürüm 3.27 2021.02.26
Besides various minor fixes and improvements, we made a few specific improvements when using FX Volume inside an EA and in the strategy tester like:

- Improve behaviour when called from iCustom
- Improved data processing (all modes)
- Fix minor display bugs while using the visual mode
- Disabled alerts in tester mode
Sürüm 3.25 2021.02.22
Optimized SI Connect EA detection in case of heavy usage (more than 20 instances)
Sürüm 3.24 2021.02.17
Fix symbols list display (top of the list possibly hidden)
Sürüm 3.23 2021.02.17
With this update, it's finally possible to combine different views AND comparison periods in just one chart.

In this way, you'll easily see if the short term volume is still dynamic and supporting the volume change of a higher period.
This offers an entirely new grade of precision because you now see exactly when to enter when to exit and if it's still worth to hold the position.

We hope you'll enjoy the new flexibility provided by FX Volume.
Sürüm 3.18 2021.02.10
Fixed bug resulting in orphan objects on the chart

Fixed bug of line style changes when using several instances
Sürüm 3.17 2021.02.04
This release is another huge step forward and provides the following new features.

- Additional colouration for the positive and negative percentage values

- History lines for Volume Total, Volume Long and Volume short are now available

- All history lines can be hidden completely via parameters in the indicator properties

- Use multiple instances of FX Volume in one chart to create individual comparison views.
Note: Every instance has to use a different "History lines and buffers" mode to manage all instances correctly.

- Volume Total, Volume Long and Volume Short are now available in the indicator buffers

IMPORTANT: Please note that the history lines and the panel information is managed independently!
If you switch to a different panel view, this does NOT change the volume history lines. You have to change them in the indicator properties.

Please note also that the value labels of the history lines differ from the information seen in the panel because the panel displays always the latest available information while the history line buffer provides an OHLC volume data average for the entire candle. Please visit our FX Volume info channel at https://t.me/SI_FX_Volume to get more detailed information
Sürüm 3.1 2021.02.01
Renamed view labels for a better usability
Sürüm 3.0 2021.02.01
This major update provides a deeper insight into the real trading market sentiment

Now you can see the total volume of the long and short side separately as well as how it changed during the selected comparison period. With this information, you can easily spot on which side of the market there is an upcoming dynamic in the real trading volume.

And because we are often asked for it we added all this information for GOLD as well.

Enjoy the new amazing features of FX Volume and leave a review if you like it.
Sürüm 2.26 2020.12.21
Fixed minor bug occurring rarely at a terminal restart
Sürüm 2.25 2020.12.18
Minor bug fixed causing an empty panel due to unchanged data

Added special section for the alert option in the indicator properties
Sürüm 2.24 2020.12.16
The following new features have been added:

-Alert on long ratio rise/drop
-Alert on total volume rise/drop
-Alert on delta increase/decrease

We hope you'll enjoy the new alert options.
Sürüm 2.22 2020.12.02
Disabled DEBUG mode
Sürüm 2.21 2020.11.23
Fixed empty panel bug
Sürüm 2.20 2020.09.18
Changed Delta calculation display to provide more accurate results

Added total volume buffer -> ask for the updated code snippets

FX Volume is now ready to be used in the MT4 strategy tester!
Sürüm 2.16 2020.06.24
The panel uses current and raw data only. OHLC is used only for history lines.

Fixed bug in panel update when data are not directly available.

Added an alert for insufficient Terminal "Max bars" settings.
Sürüm 2.0 2020.06.20
Dear customers, please welcome our fantastic FX Volume 2.0. We spent weeks of work designing this beautiful panel, adding excellent features, and providing more detailed information to offer you outstanding user experience and a real edge in trading.

To benefit from all improvements it is necessary that you update FX Volume and SI Connect to the latest available version!
Sürüm 1.26 2020.06.07
Metaquotes provided important fixes in MQL5 and asked us to recompile all our market tools.
So please update your local copy to the latest available to benefit from bug fixes and improvements.
Sürüm 1.25 2020.05.14
Use updated libraries
Sürüm 1.24 2020.03.09
Added security to avoid alert flooding

Fixed bug which checks and sends alert continuously if the data file can't be opened