Gartley Guard Harmonics mt5
- Göstergeler
- Ely Alsedy
- Sürüm: 1.0
- Etkinleştirmeler: 5
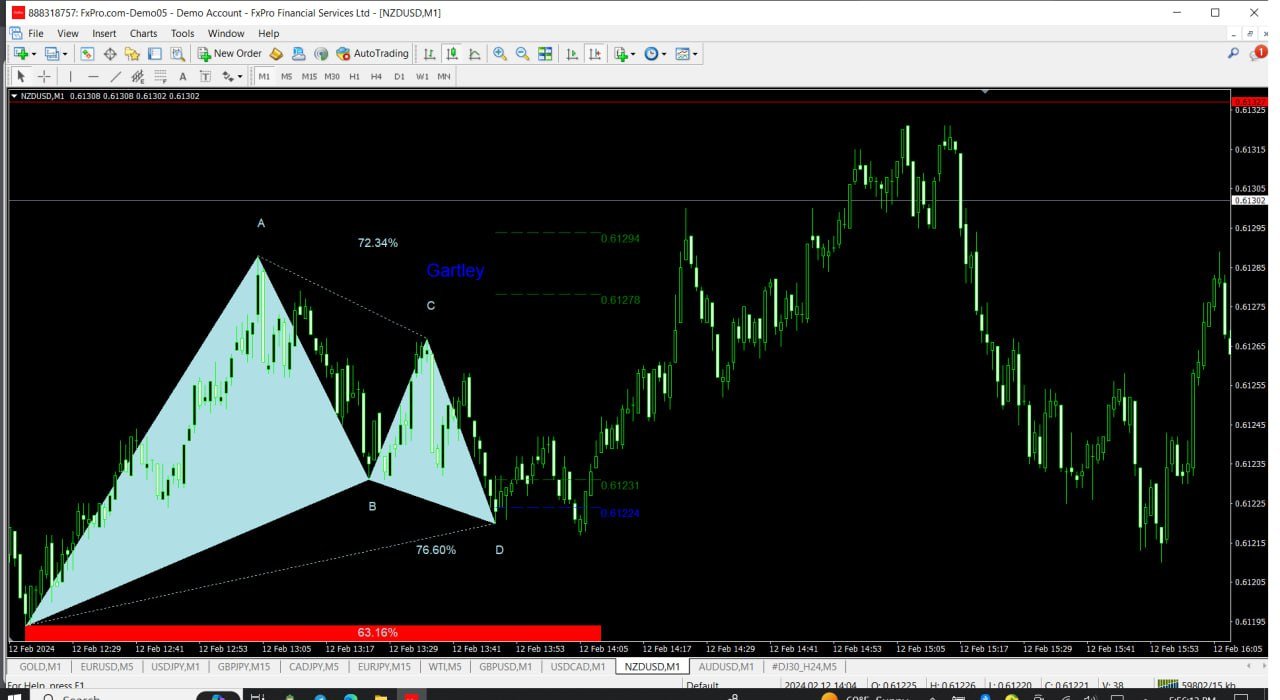
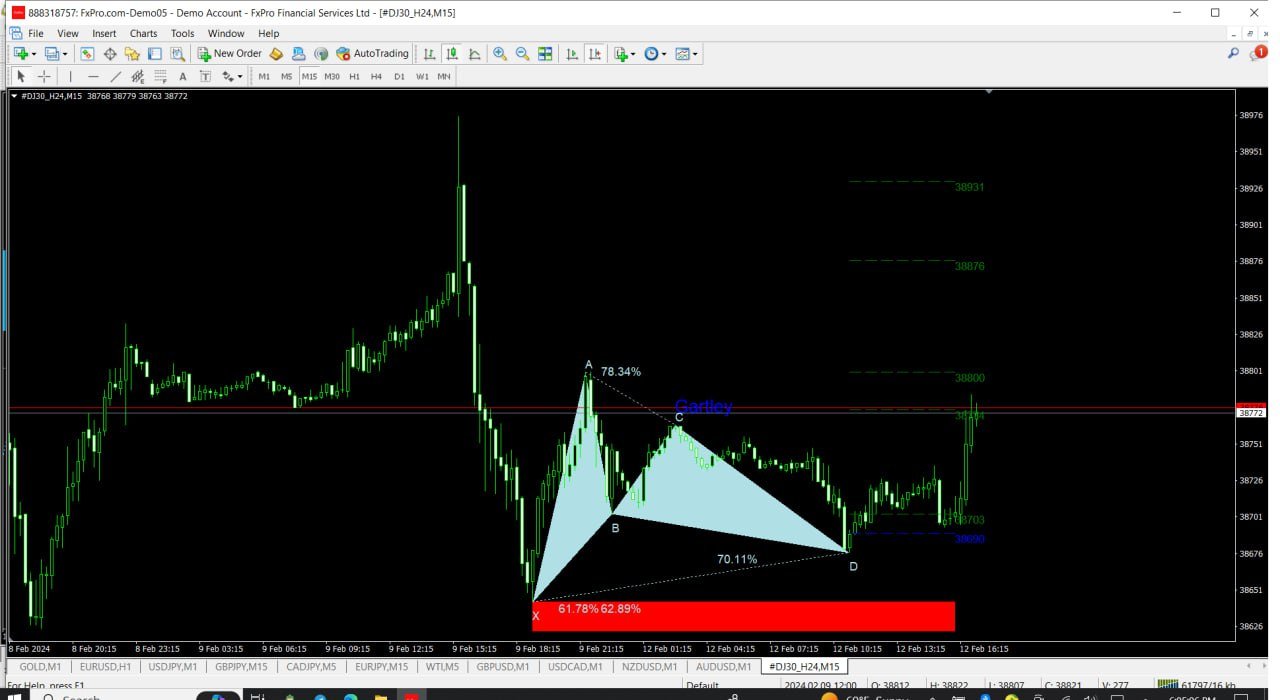
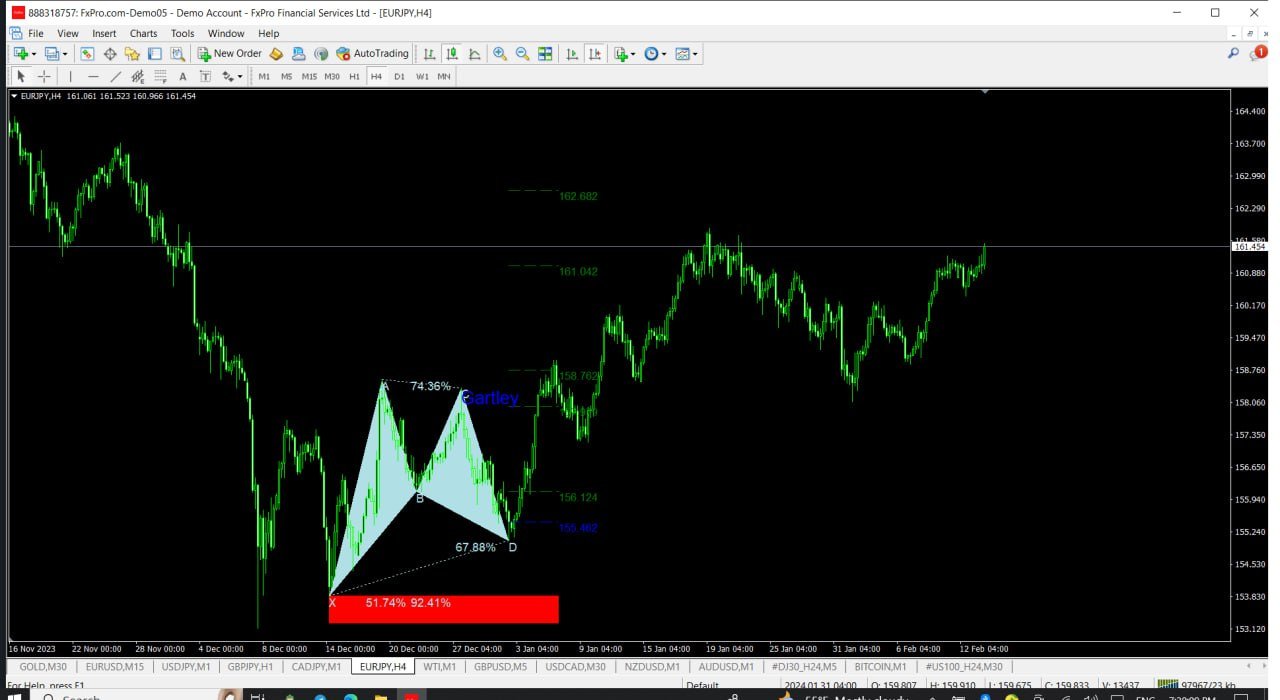
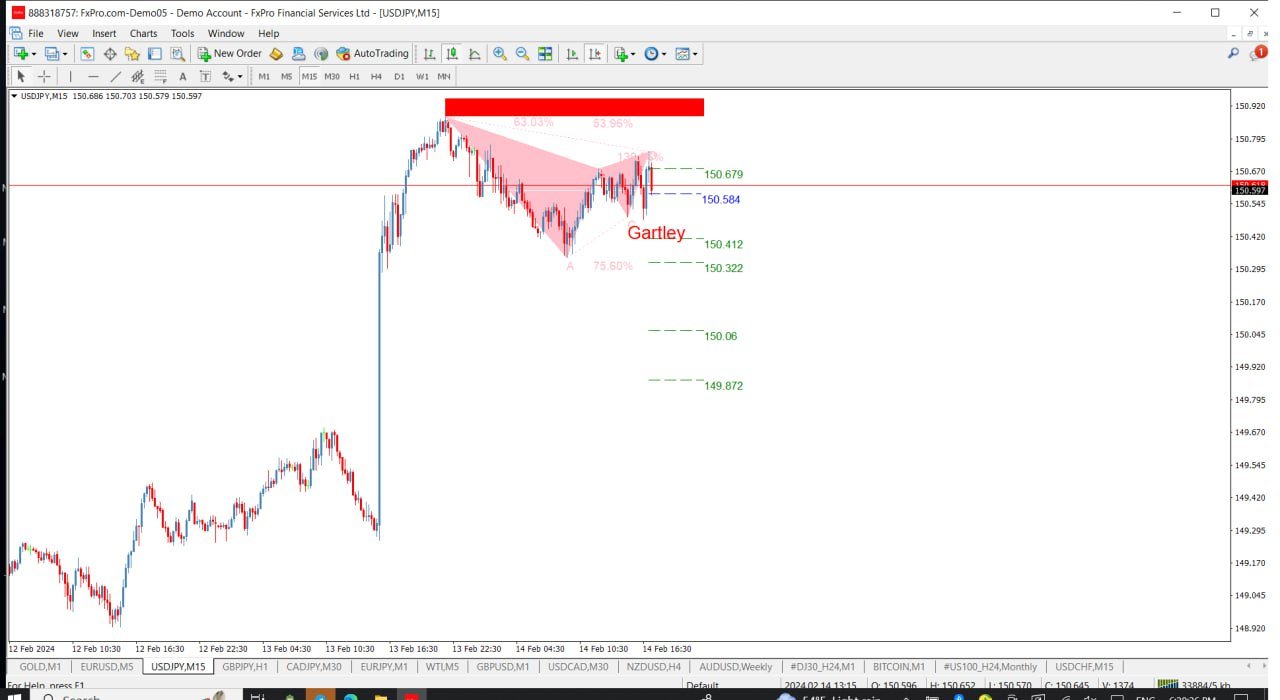
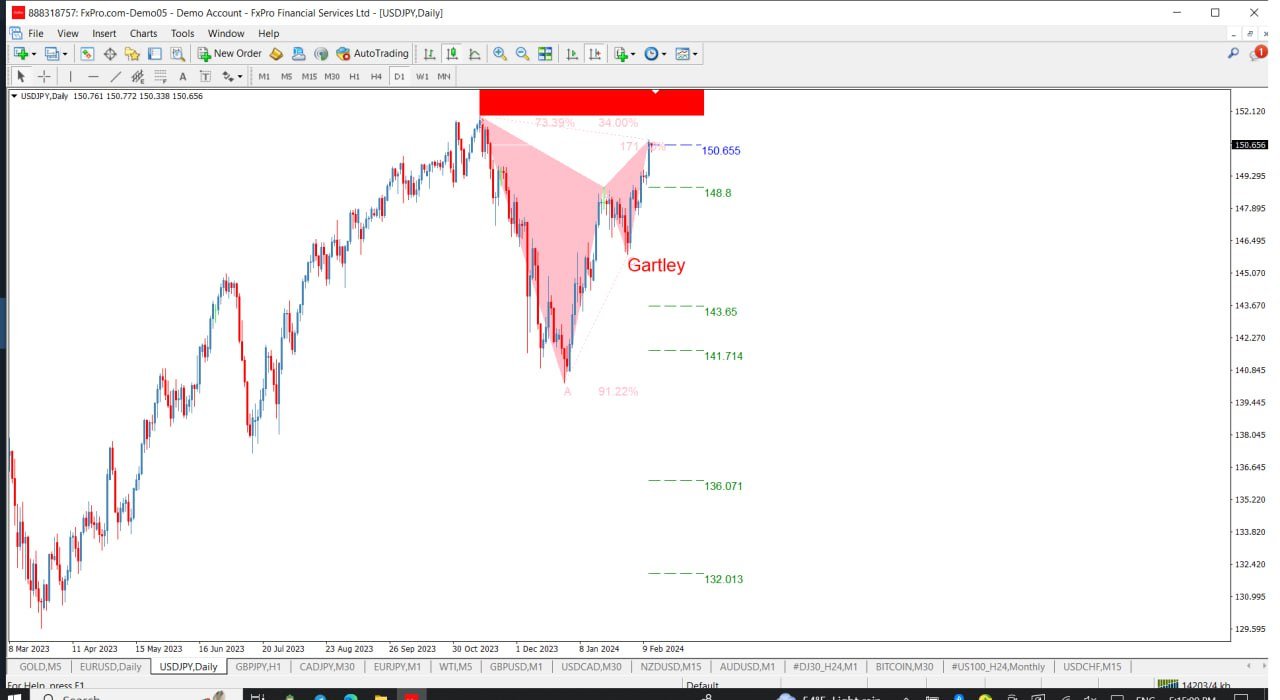
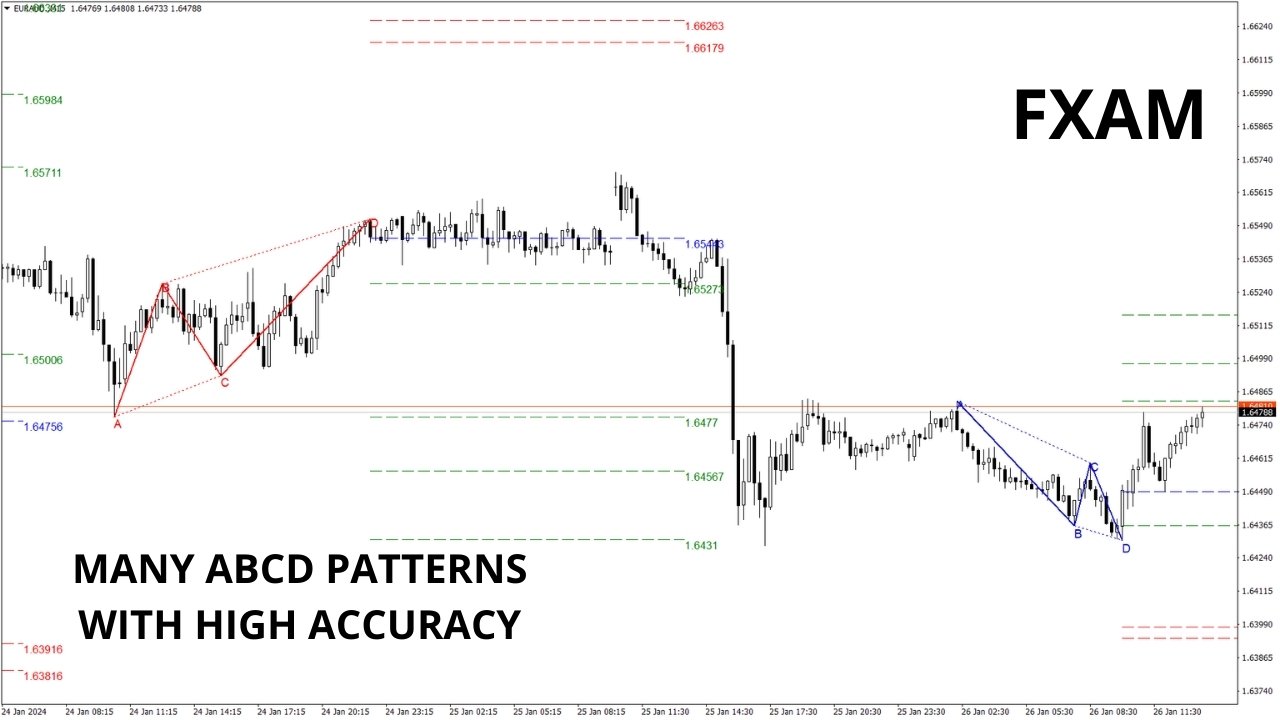
Harmonik desenler, piyasa dönüm noktalarını tahmin etmek için en uygun olanlardır. Yüksek başarı oranı ve bir günde birçok işlem fırsatı sunarlar. Göstergemiz, harmonik ticaret literatürüne dayanarak en popüler harmonik desenleri tanımlar.
ÖNEMLİ NOTLAR:
- Gösterge yeniden çizmez, gecikmez (D noktasında bir desen algılar) ve yeniden çizilmez (desen ya geçerli ya da iptal edilir).
NASIL KULLANILIR:
- Göstergenizi MT5 grafiğinize sürükleyip bırakın.
- Desen algılama ayarını TRUE (ABCD; Gartley) olarak ayarlayın.
- Sapmayı isteğinize göre ayarlayın (yüksek sapma daha fazla desen, düşük sapma daha az desen demektir).
- Renkleri tercihinize göre özelleştirin.
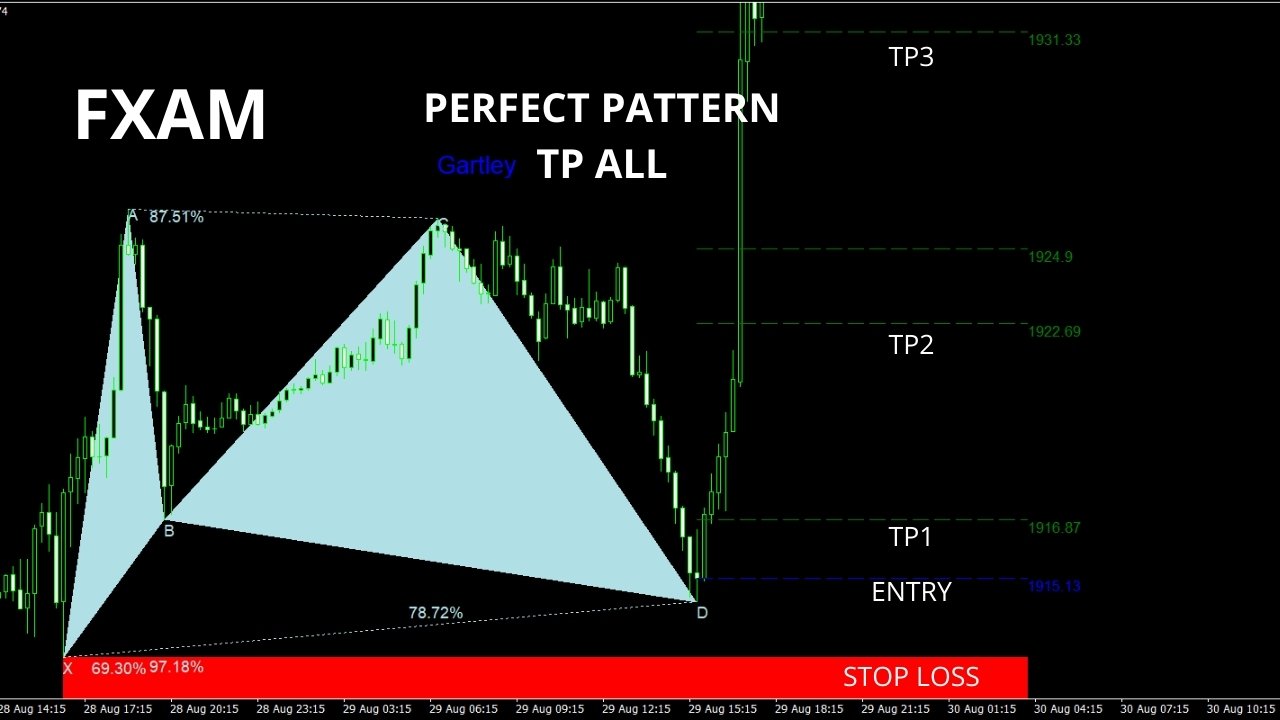
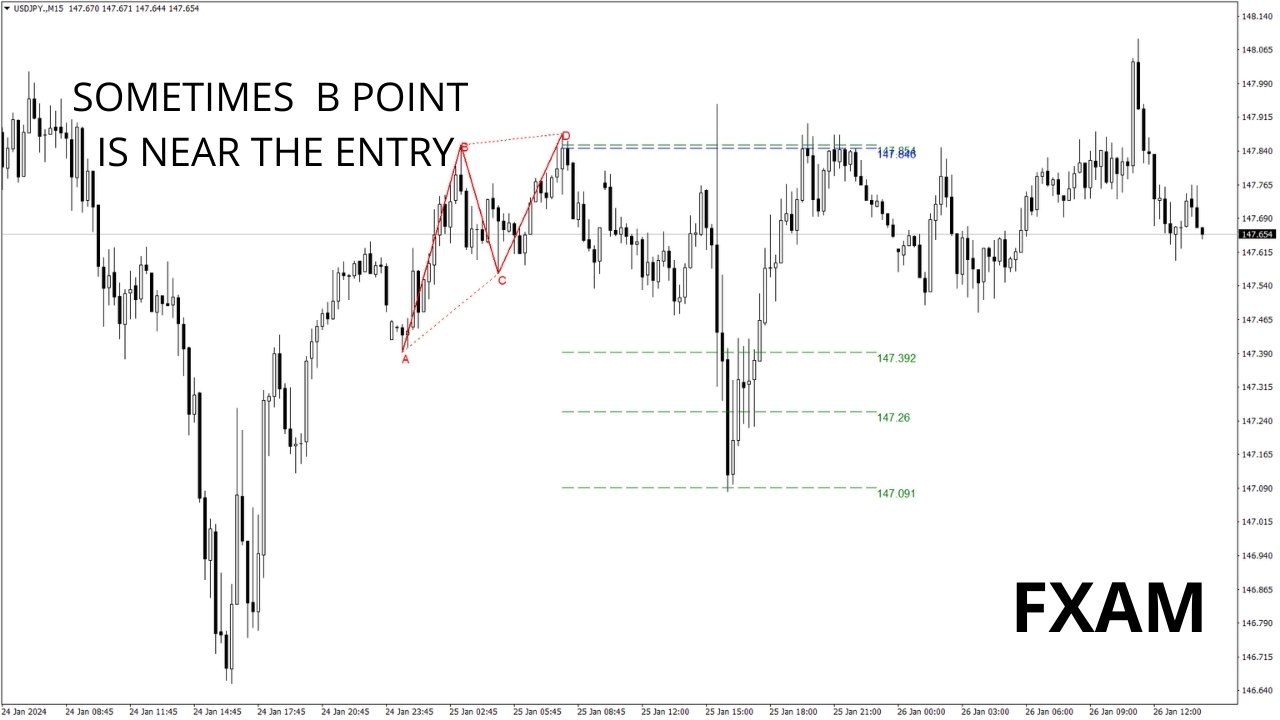
- İhtiyacınıza göre ENTRY POINT, TP ve SL için uyarıları etkinleştirin veya devre dışı bırakın.
BİR DESEN ALGILANDIĞINDA:
- Algoritma bir deseni D noktasında algılar.
- Uyarılar etkinse, desen algılandığına dair bir bildirim alırsınız.
- Bir desen geçersiz hale gelirse, "DESEN İPTAL EDİLDİ" mesajıyla bir uyarı tetiklenir.
- Başarılı desenler, mum kapanışında BİR GİRİŞ UYARISI tetikler.
- TP1, TP2, TP3, TP4 veya SL'ye ulaşıldığında uyarılar gönderilir.
Mevcut fiyat 40 $ ve sadece birkaç kopya mevcut. Son fiyat 70 $ olacaktır.
GELİŞTİRME PLANI:
- Mevcut sürüm (1.1) bu göstergelerin Gartley ve ABCD desenlerini algılayacaktır.
- Sürüm 1.1, Butterfly, Bat ve Crab desenlerini içerecektir.
- Gelecek sürümler ek desenler, potansiyel PRZ algılama ve her desen olayı için uyarılar içerecektir (ortaya çıkma, tamamlanma, giriş, SL/TP).
- Sürüm 1.4, tüm döviz çiftleri ve zaman dilimlerinde desenleri algılamak ve belirli aralıklarla güncellemek için bir tarayıcı içerecektir.
- Sürüm 1.5, desenleri izlemek için grafik penceresinin altında bir KONTROL PANELİ içerecektir.
Bu göstergenin satın alınmasıyla, gelişimine katkıda bulunmuş olacaksınız.
Ana Özellikler:
- Kullanımı kolay ve kullanıcı dostu arayüz.
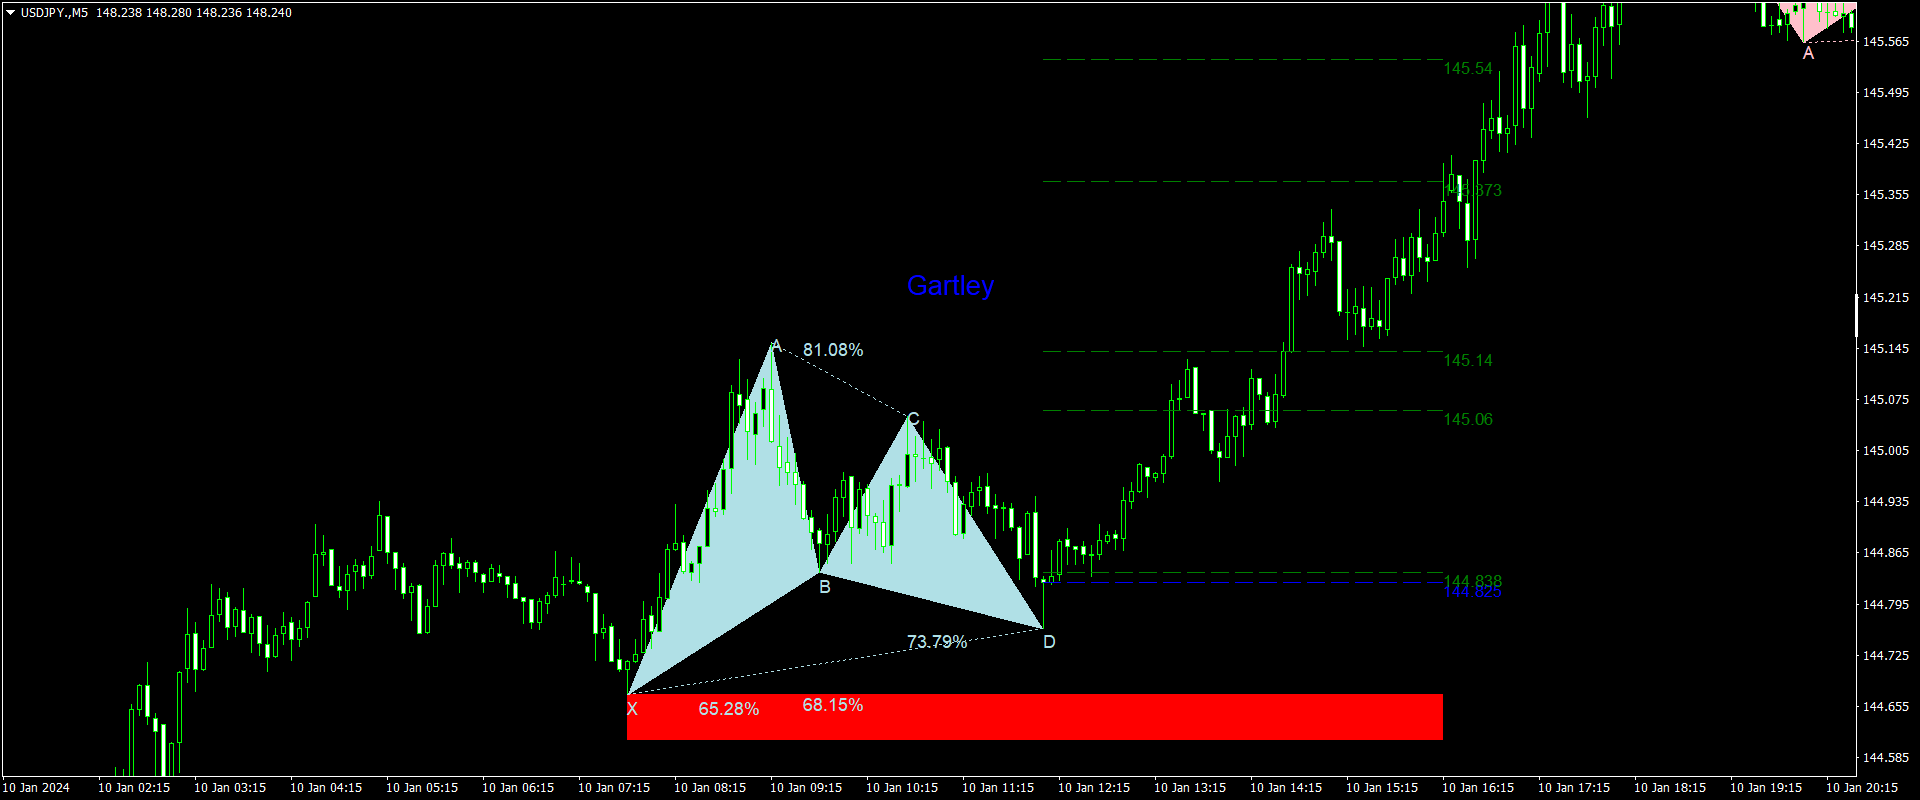
- Fibonacci seviyelerini desen algılama için kullanır.
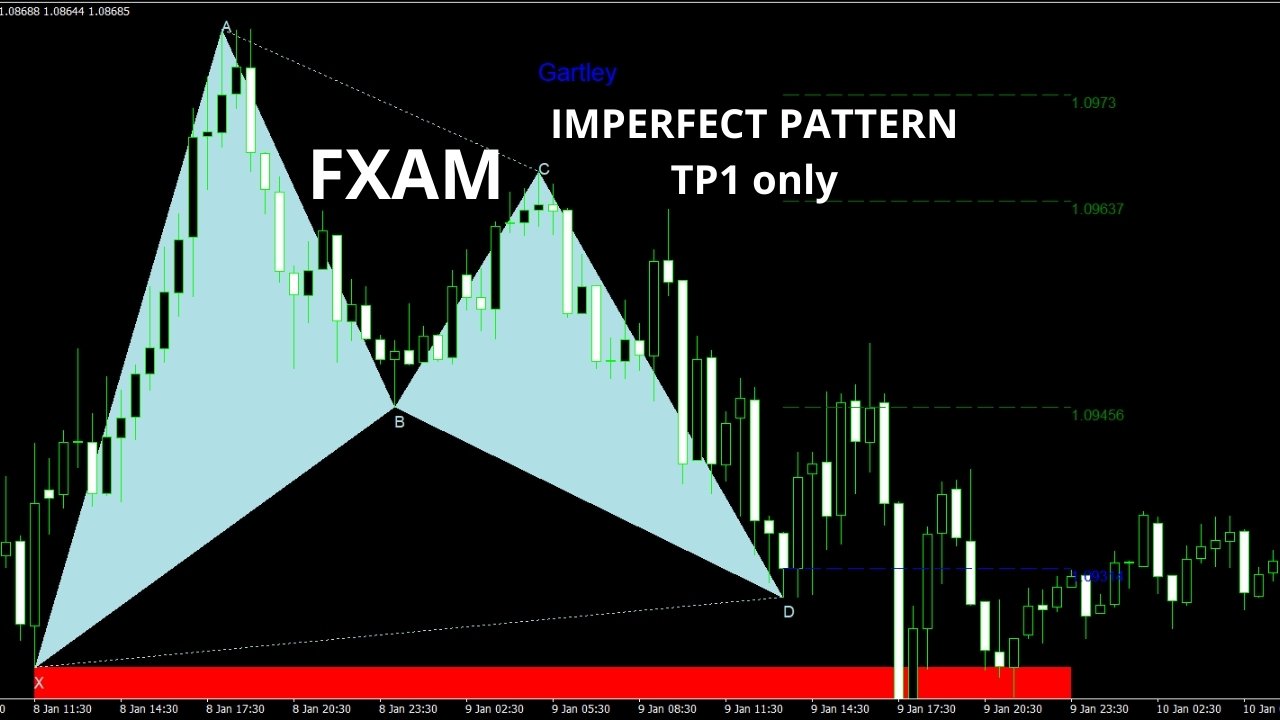
- Son TP'ye kadar gidebilecek mükemmel desenleri ve en azından TP1'e ulaşabilecek eksik desenleri tanımlar.
GİRİŞ PARAMETRELERİ:
- Genel ayarlar, Derinlik, Algılama modu, Geçmiş kullanımı, Oranları gösterme, Nokta etiketlerini gösterme ve Desenden nokta uzaklığı gibi ayarları içerir.
- Gartley ayarları, yükselen ve düşen renkleri, yüzde sapma ve gösterim seçenekleri gibi özelleştirmeleri içerir.
- ABCD ayarları, yüzde sapma ve renk özelleştirme gibi ayarları içerir.
Kullanıcı incelemeye herhangi bir yorum bırakmadı