Gartley Guard Harmonics mt5
- 指标
- Ely Alsedy
- 版本: 1.0
- 激活: 5
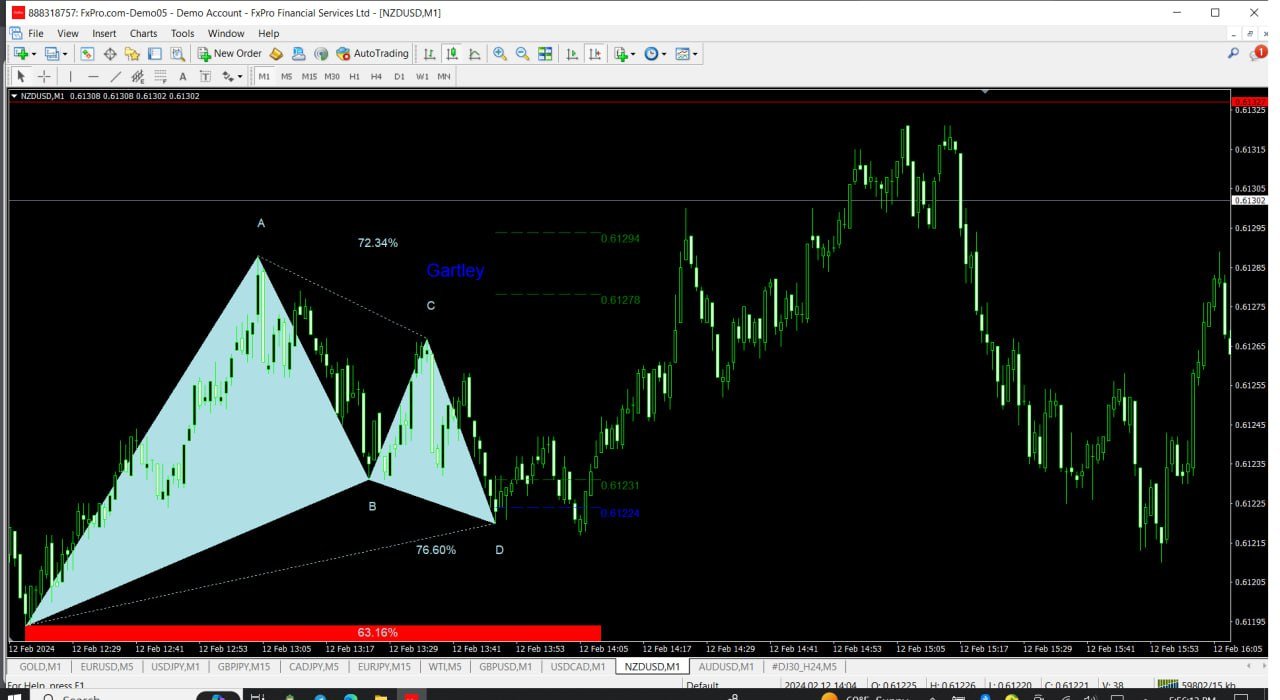
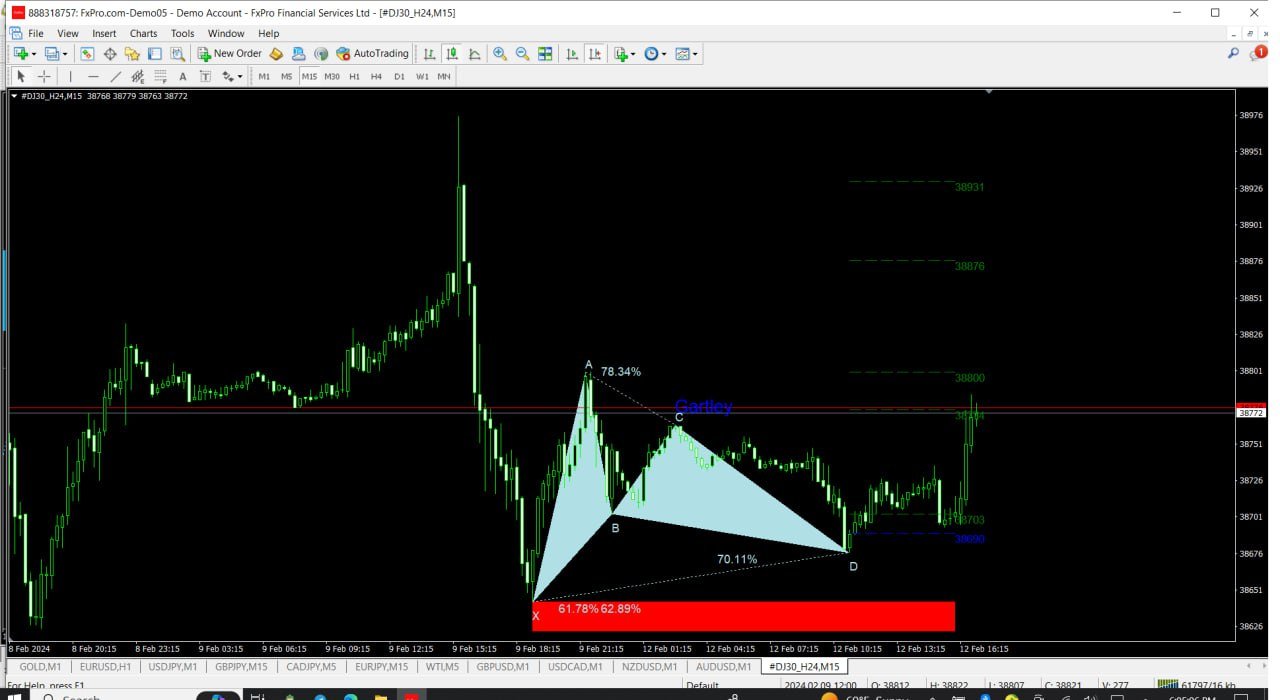
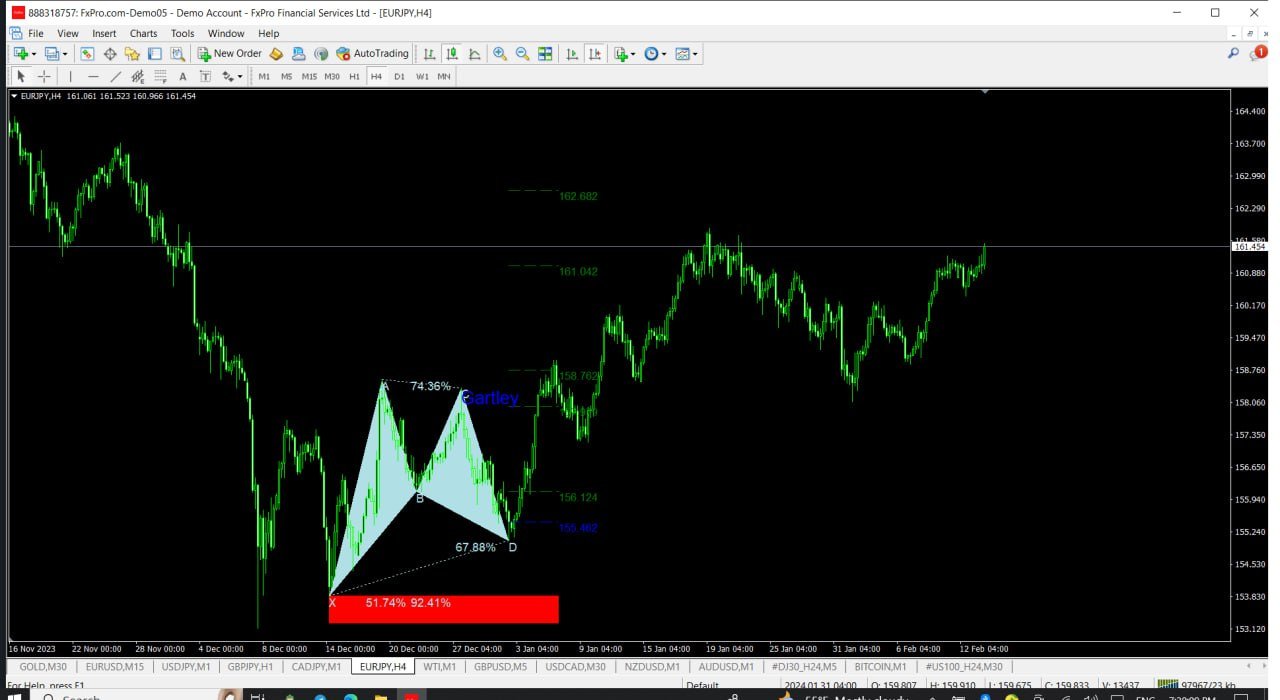
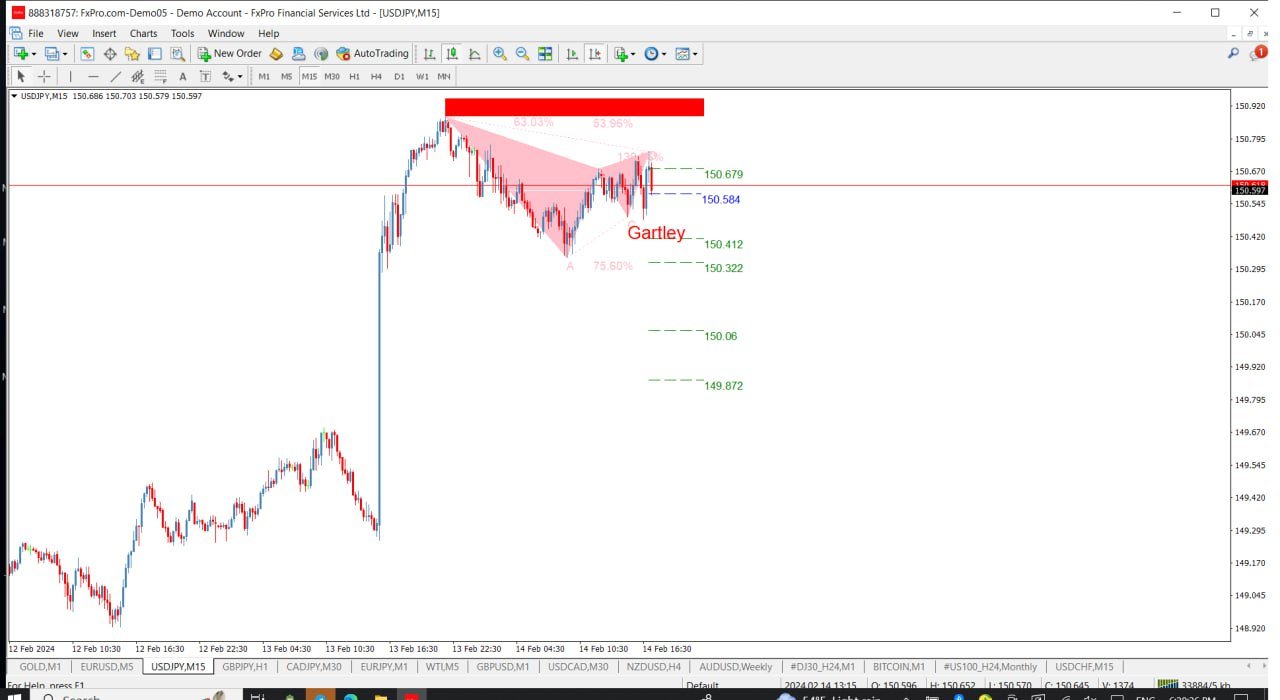
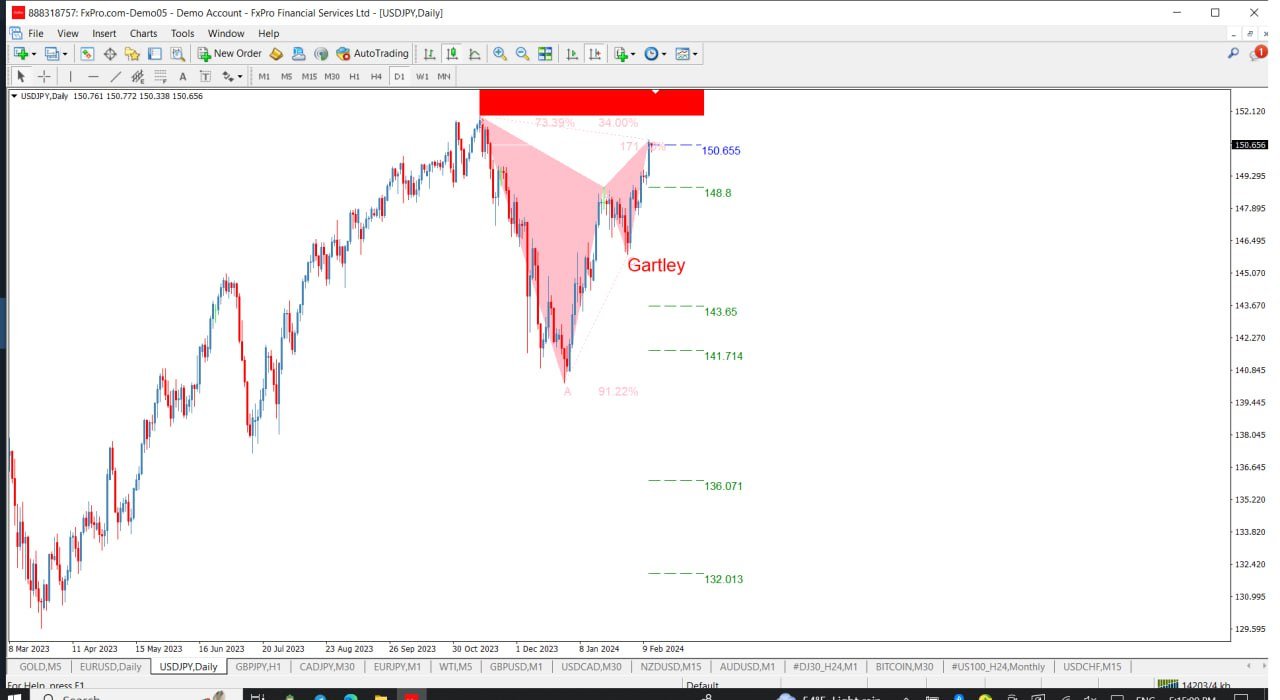
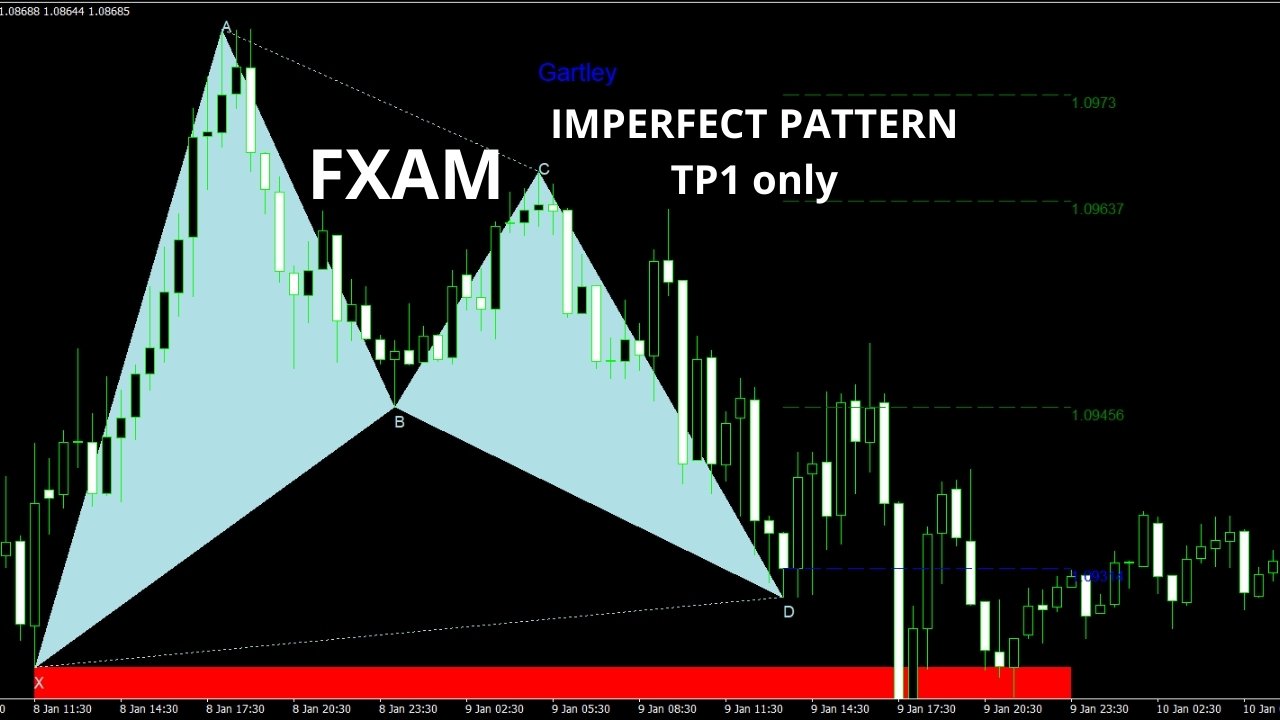
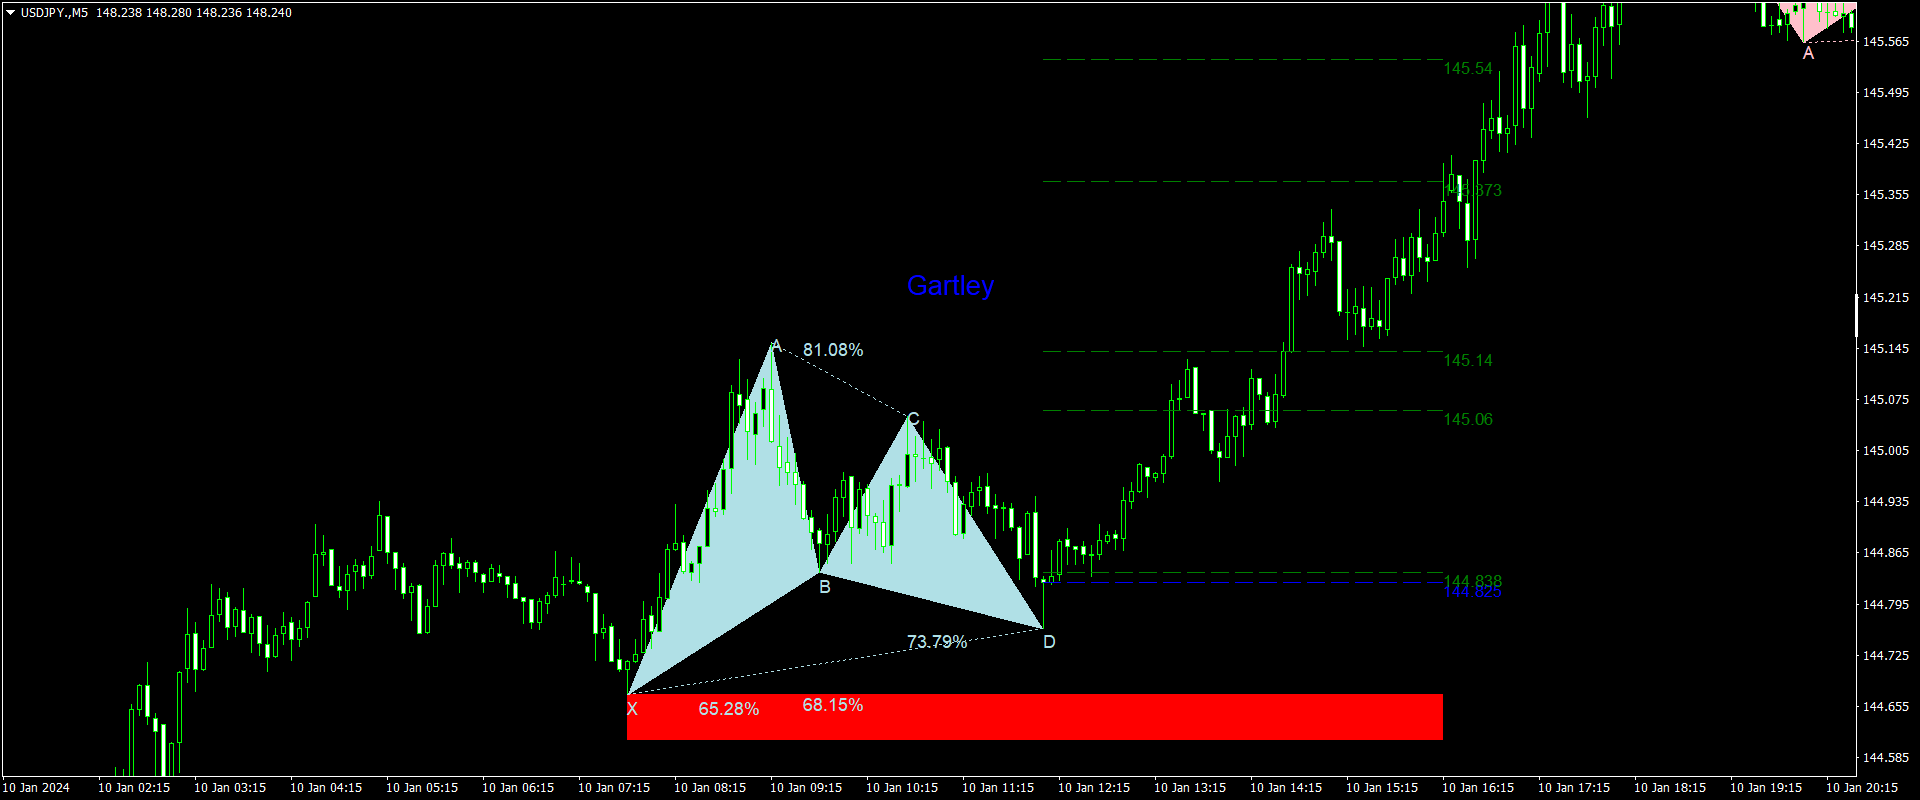
和谐图案最适合预测市场转折点。和谐图案为您提供高胜率和一天内的高交易机会。 该指标识别了最受欢迎的和谐图案,这些图案预测市场反转点。 基于和谐交易书籍。
重要说明:
- 该指标不会重绘或滞后(它在D点检测到模式);它不会重新绘制(模式要么有效,要么取消)。
使用方法:
- 将指标拖放到您的MT5图表上。
- 将模式检测设置为TRUE(ABCD; Gartley)。
- 根据您的喜好调整偏差(较大的偏差=更多的模式;较小的偏差=更少的模式)。
- 根据您的喜好自定义颜色。
- 根据需要启用或禁用关于入场点、TP和SL的警报。
检测到模式时:
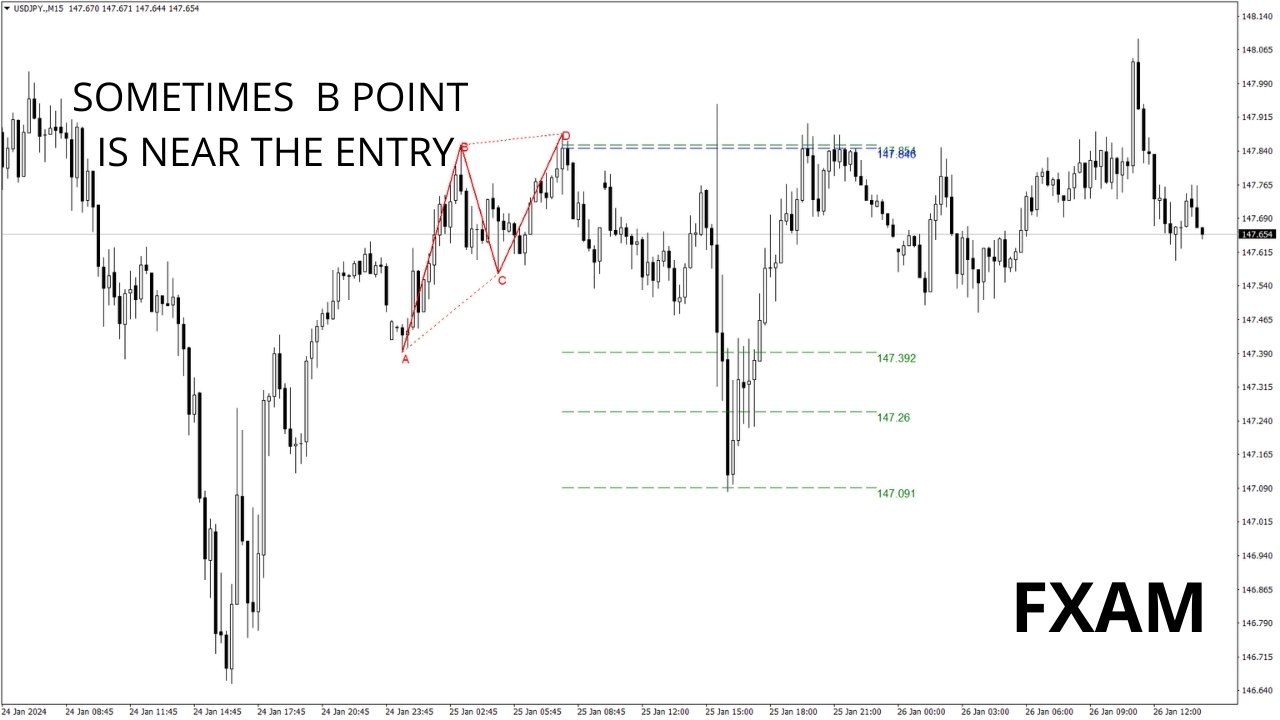
- 该算法在D点检测到模式。
- 如果启用了警报,它将通知您检测到的模式。
- 如果模式无效,则触发一个带有“模式已取消”消息的警报。
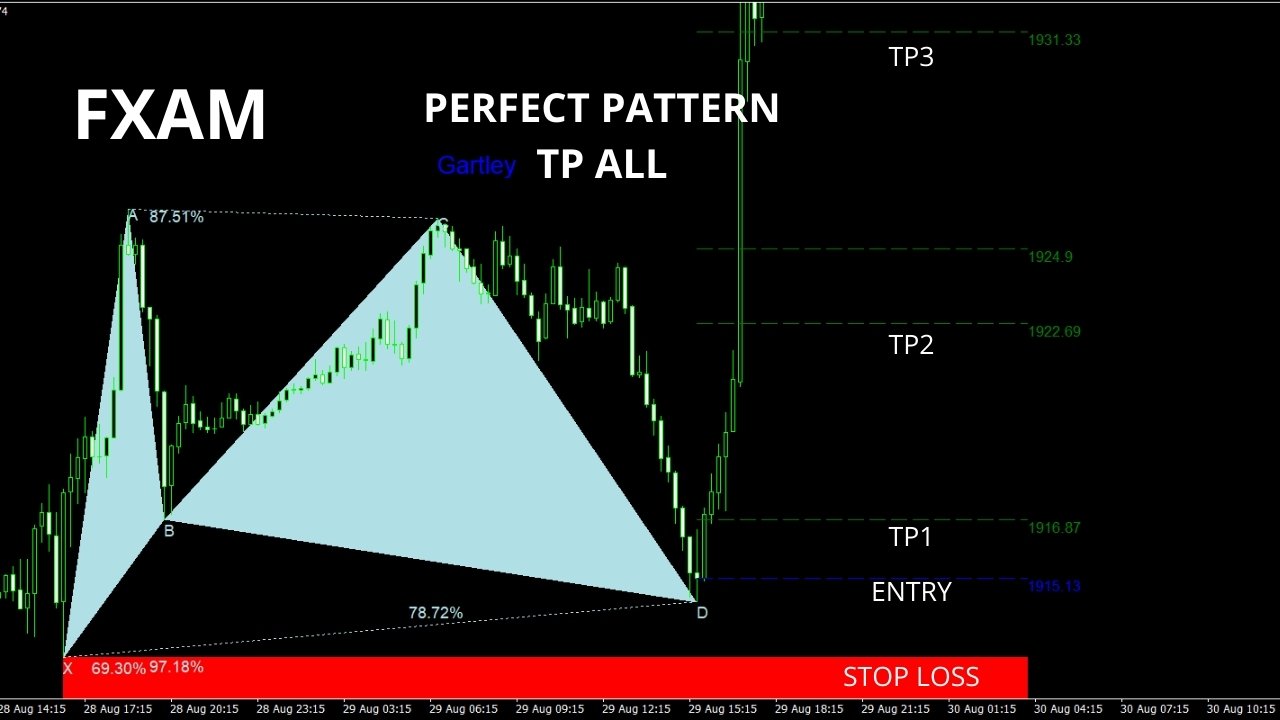
- 成功的模式在蜡烛关闭时触发“入场警报”。
- 如果价格达到TP1、TP2、TP3、TP4或SL,则会发出带有终端消息的警报。
价格现在为40美元,仅剩下几份副本,最终价格将为70美元。
发展计划:
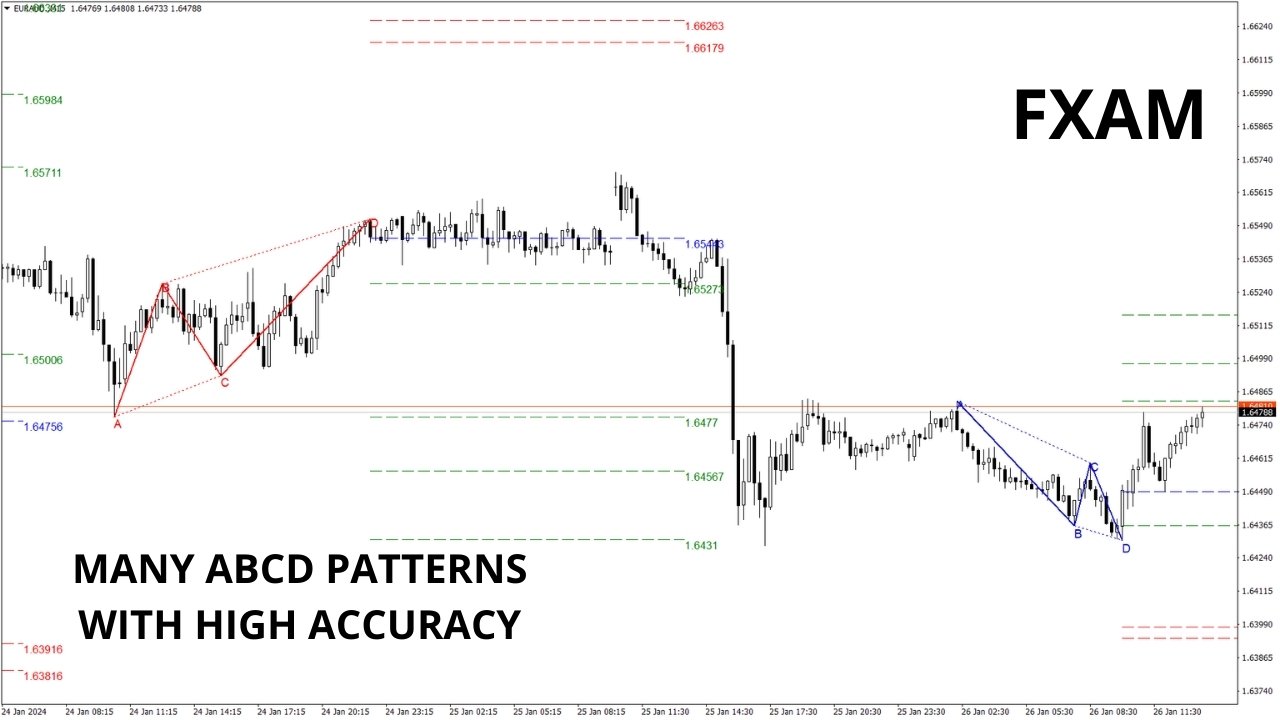
- 该指标的当前版本(1.1)将检测Gartley和ABCD模式。
- 版本1.1将包括Butterfly、Bat和Crab模式。
- 未来版本将包括其他模式、潜在PRZ检测和每个模式事件的警报(出现、完成、入场、SL\TP)。
- 版本1.4将引入一个扫描程序,可在所有货币对和时间框架上检测模式,并定期更新。
- 版本1.5将包括一个仪表板,用于模式监控。
通过购买此指标,您将有助于其持续发展。
主要特点:
- 易于使用和用户友好。
- 使用斐波那契级别进行模式检测。
- 检测可以达到最后TP的完美模式和至少达到TP1的不完美模式。
输入参数:
- 一般设置包括深度、检测模式、使用历史记录、显示比率、显示点标签和点与模式之间的距离。
- Gartley设置允许自定义牛市和熊市颜色、偏差百分比和显示选项。
- ABCD设置包括偏差百分比和颜色自定义。
用户没有留下任何评级信息