Gartley Guard Harmonics mt5
- Indicateurs
- Ely Alsedy
- Version: 1.0
- Activations: 5
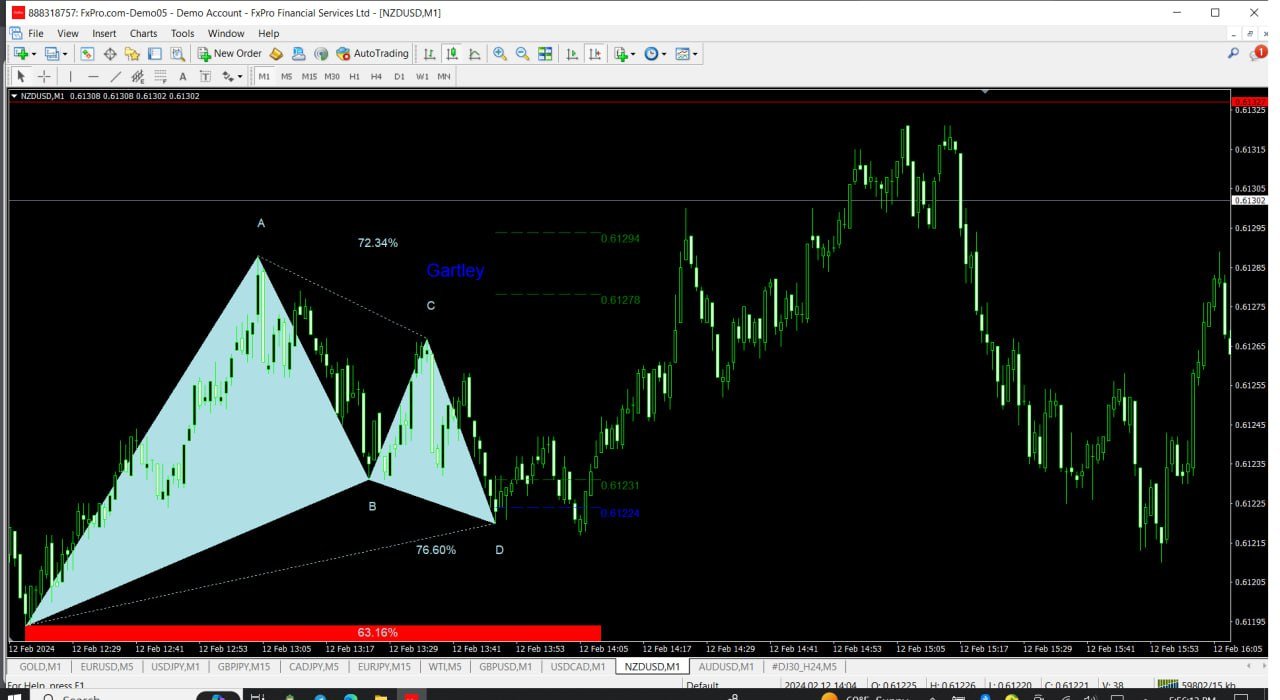
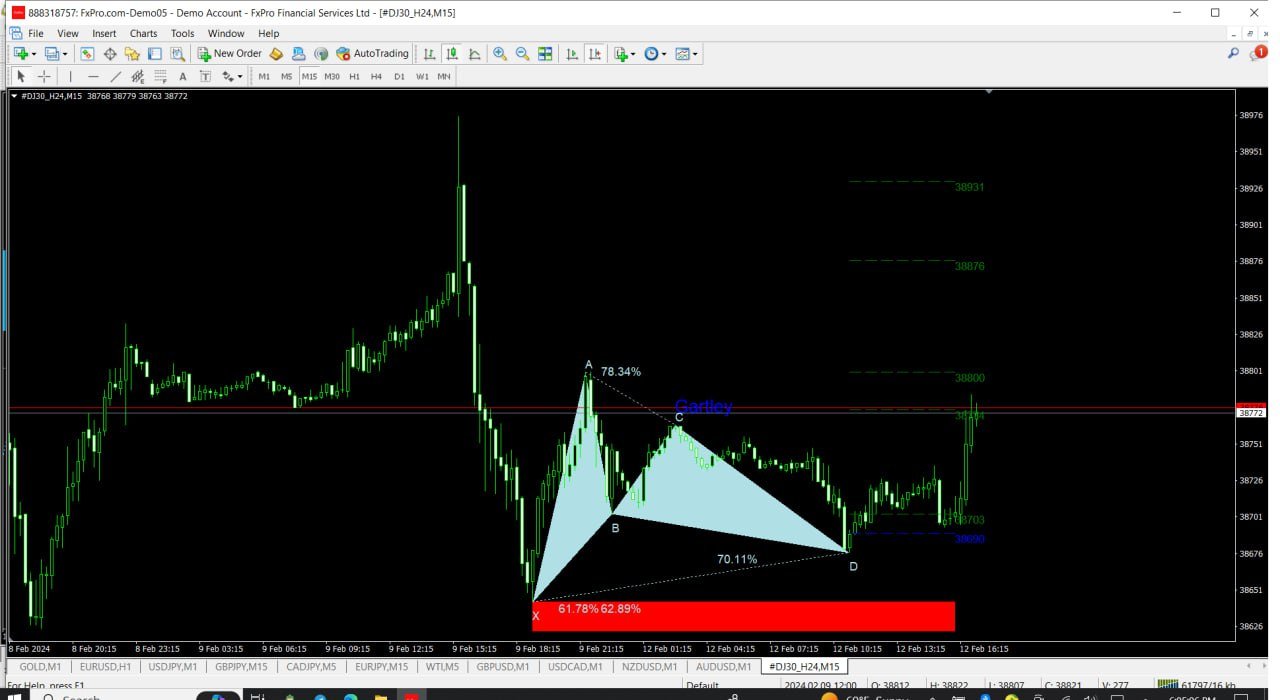
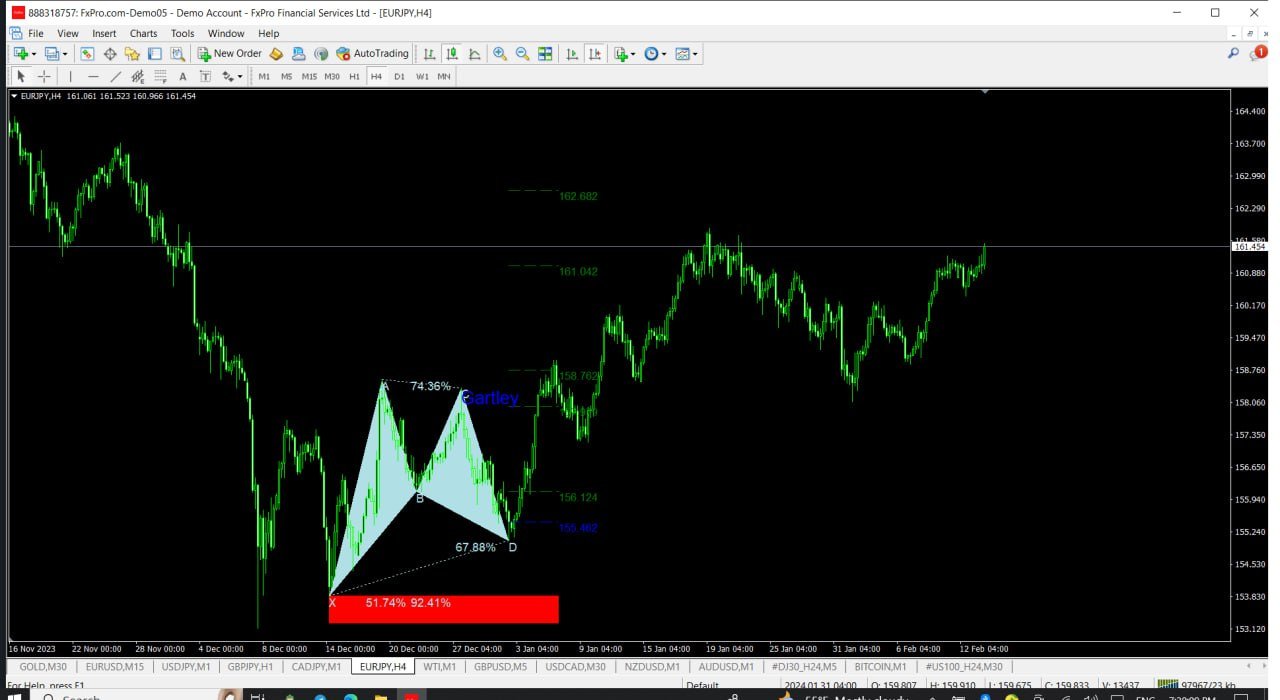
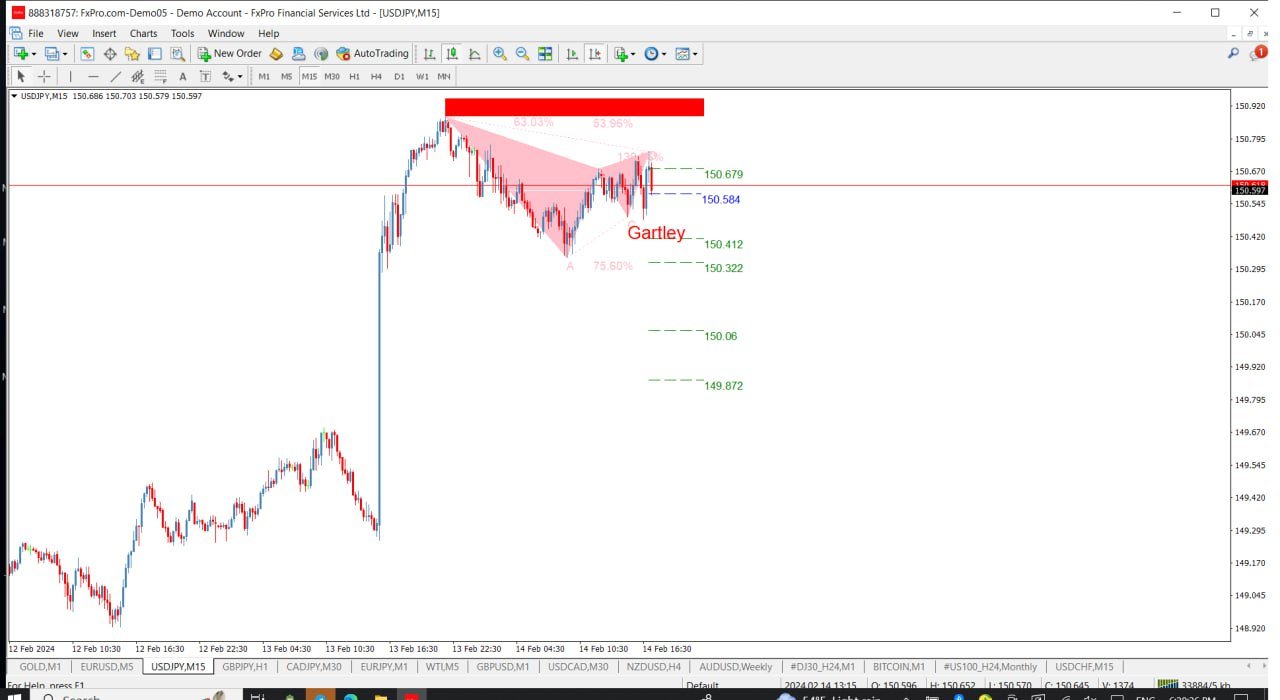
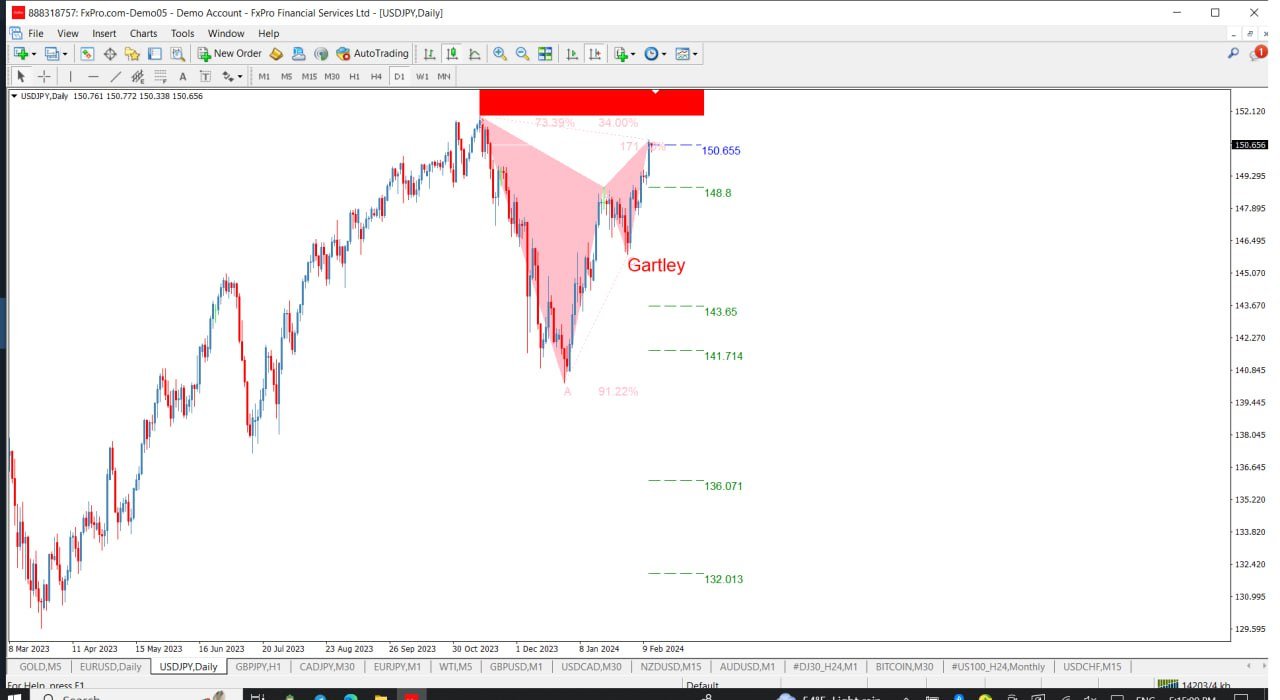
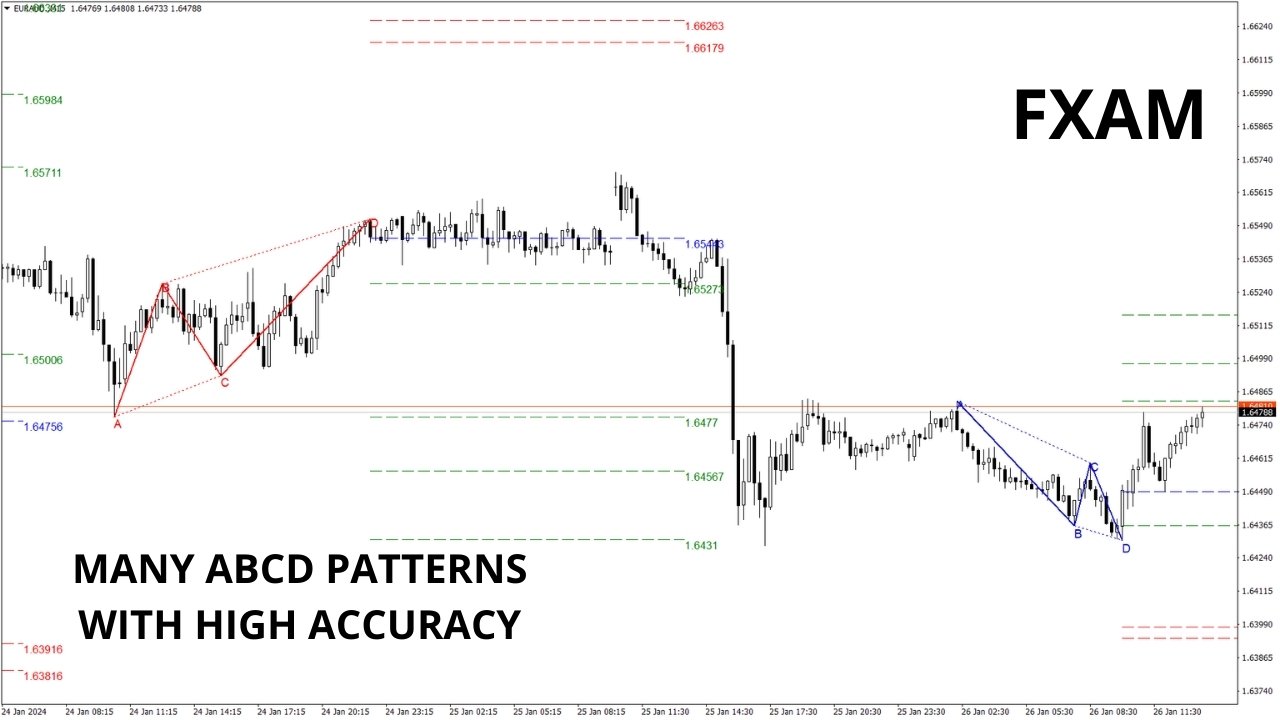
Les motifs harmoniques sont les mieux adaptés pour prédire les points de retournement du marché. Ils offrent un taux de réussite élevé et de nombreuses opportunités de trading en une seule journée de trading. Notre indicateur identifie les motifs harmoniques les plus populaires en se basant sur les principes énoncés dans la littérature sur le trading harmonique.
REMARQUES IMPORTANTES :
- L'indicateur ne repeint pas, ne prend pas de retard (il détecte un motif au point D) et ne redessine pas (le motif est soit valide, soit annulé).
COMMENT UTILISER :
- Faites glisser et déposez l'indicateur sur votre graphique MT5.
- Réglez la détection des motifs sur VRAI (ABCD ; Gartley).
- Ajustez la déviation selon vos préférences (une déviation plus élevée pour plus de motifs, une déviation plus faible pour moins de motifs).
- Personnalisez les couleurs selon vos préférences.
- Activez ou désactivez les alertes pour POINT D'ENTRÉE, TP et SL selon vos besoins.
LORSQU'UN MOTIF EST DÉTECTÉ :
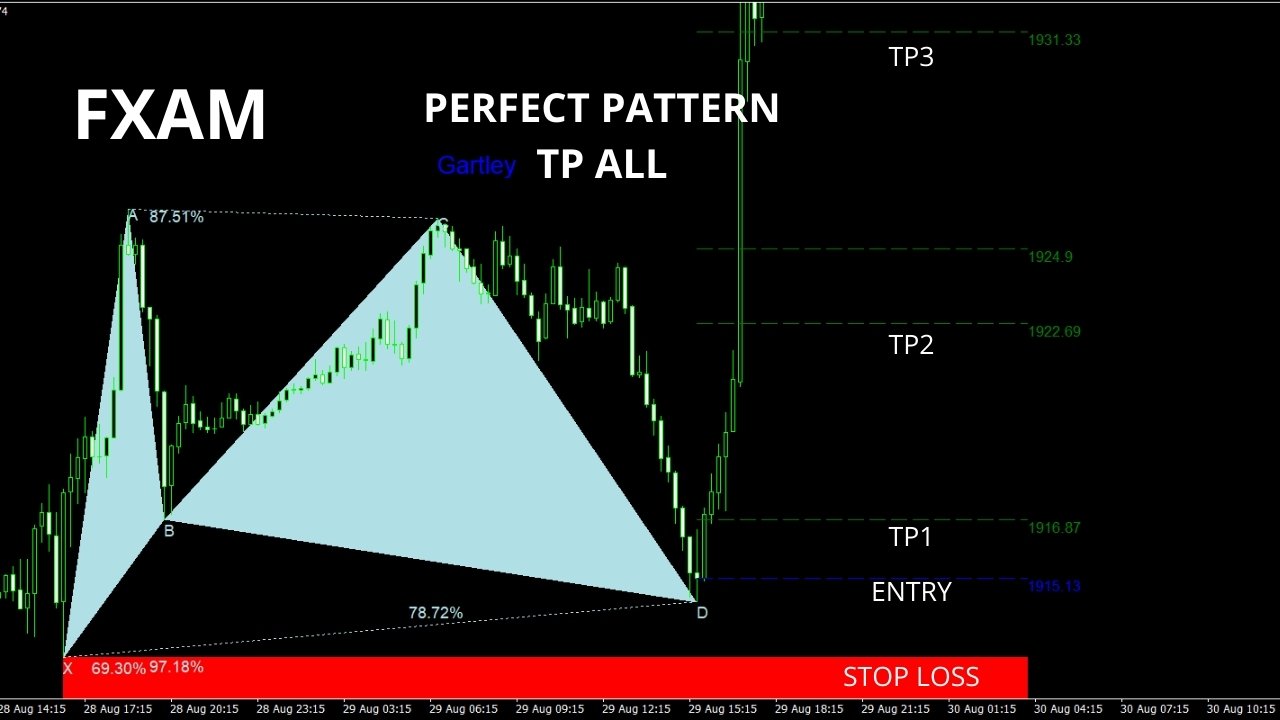
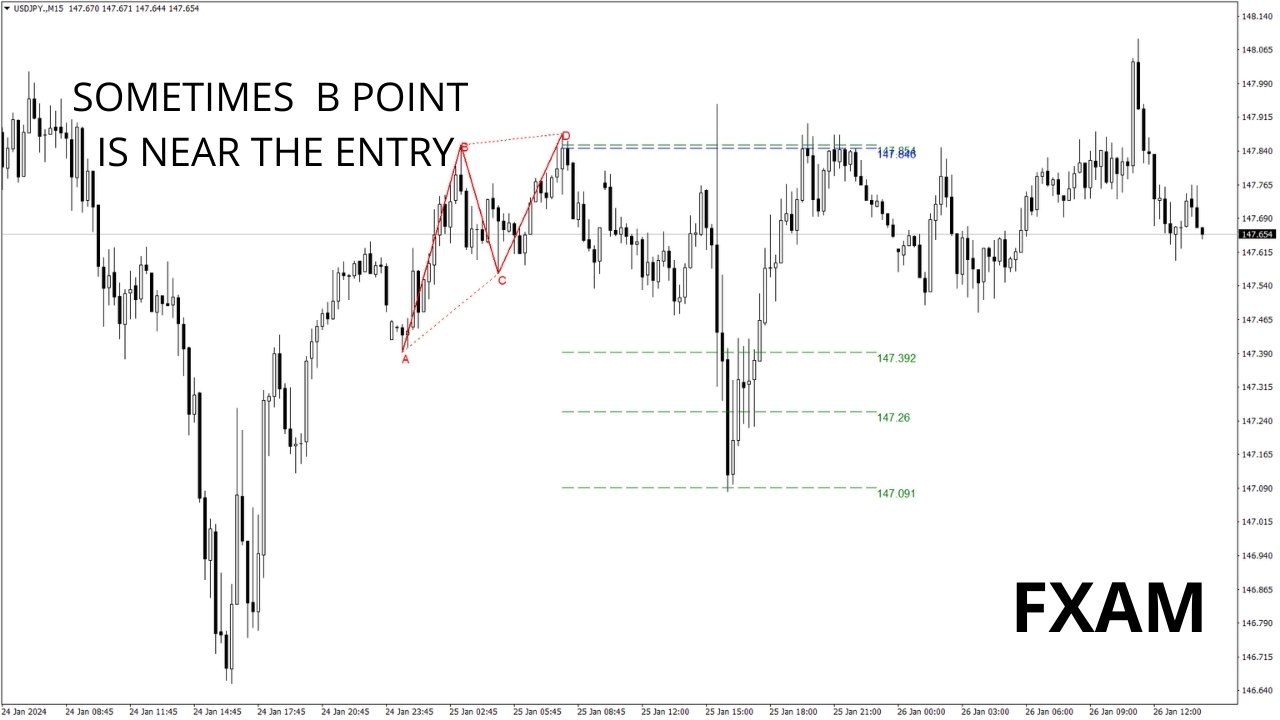
- L'algorithme détecte un motif au point D.
- Si les alertes sont activées, une notification est envoyée pour signaler la détection du motif.
- Si un motif est invalidé, une alerte est déclenchée avec le message "MOTIF ANNULÉ".
- Les motifs réussis déclenchent une ALERTE D'ENTRÉE à la fermeture de la bougie.
- Des alertes sont envoyées lorsque TP1, TP2, TP3, TP4 ou SL sont atteints.
Le prix est actuellement de 40 $ avec seulement quelques exemplaires restants. Le prix final sera de 70 $.
PLAN DE DÉVELOPPEMENT :
- La version actuelle (1.1) de cet indicateur détectera les motifs Gartley et ABCD.
- La version 1.1 inclura les motifs Butterfly, Bat et Crab.
- Les versions futures incluront des motifs supplémentaires, une détection potentielle des PRZ et des alertes pour chaque événement de motif (apparition, achèvement, entrée, SL/TP).
- La version 1.4 introduira un scanner pour détecter les motifs sur toutes les paires de devises et les périodes de temps, avec des mises à jour régulières.
- La version 1.5 inclura un tableau de bord sous la fenêtre du graphique pour surveiller les motifs.
En achetant cet indicateur, vous contribuez à son développement continu.
Principales caractéristiques :
- Interface facile à utiliser et conviviale.
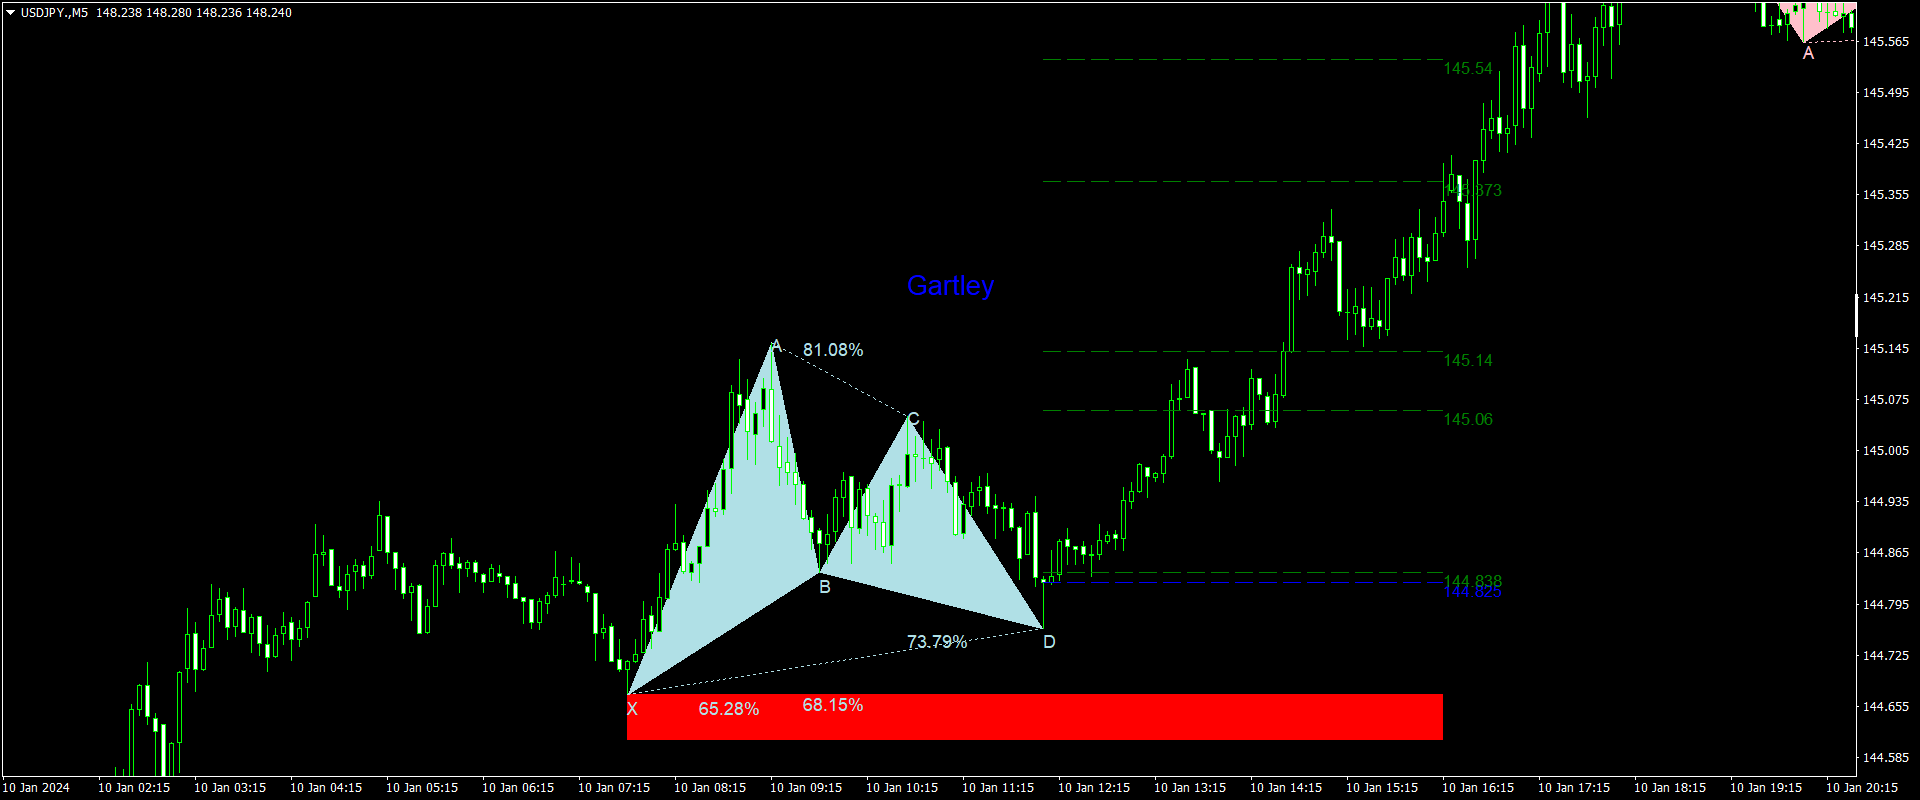
- Utilise les niveaux de Fibonacci pour la détection des motifs.
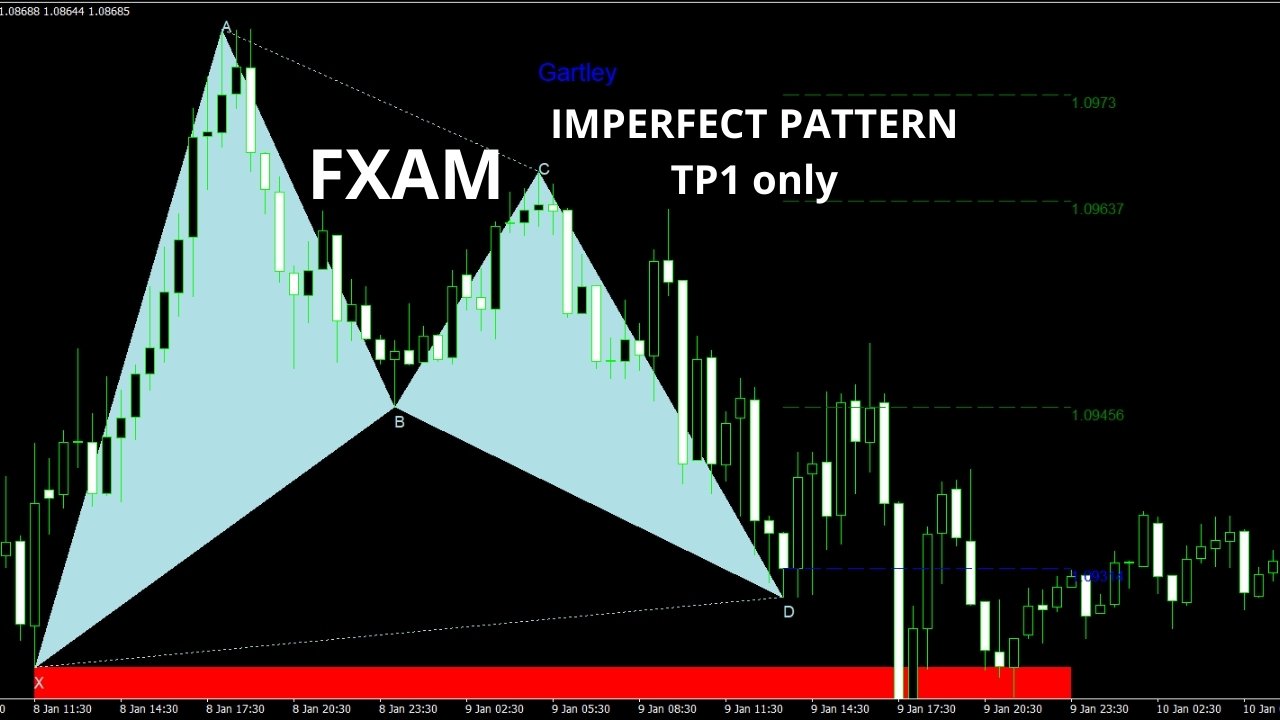
- Identifie les motifs parfaits pouvant aller jusqu'au dernier TP et les motifs imparfaits atteignant au moins TP1.
PARAMÈTRES D'ENTRÉE :
- Les paramètres généraux incluent la profondeur, le mode de détection, l'utilisation de l'historique, l'affichage des ratios, l'affichage des étiquettes des points et la distance des points par rapport au motif.
- Les paramètres Gartley permettent de personnaliser les couleurs haussières et baissières, le pourcentage de déviation et les options d'affichage.
- Les paramètres ABCD incluent le pourcentage de déviation et la personnalisation des couleurs.
L'utilisateur n'a laissé aucun commentaire sur la note