RelicusRoad MACD v2 MT5
- Göstergeler
- Relicus LLC
- Sürüm: 2.0
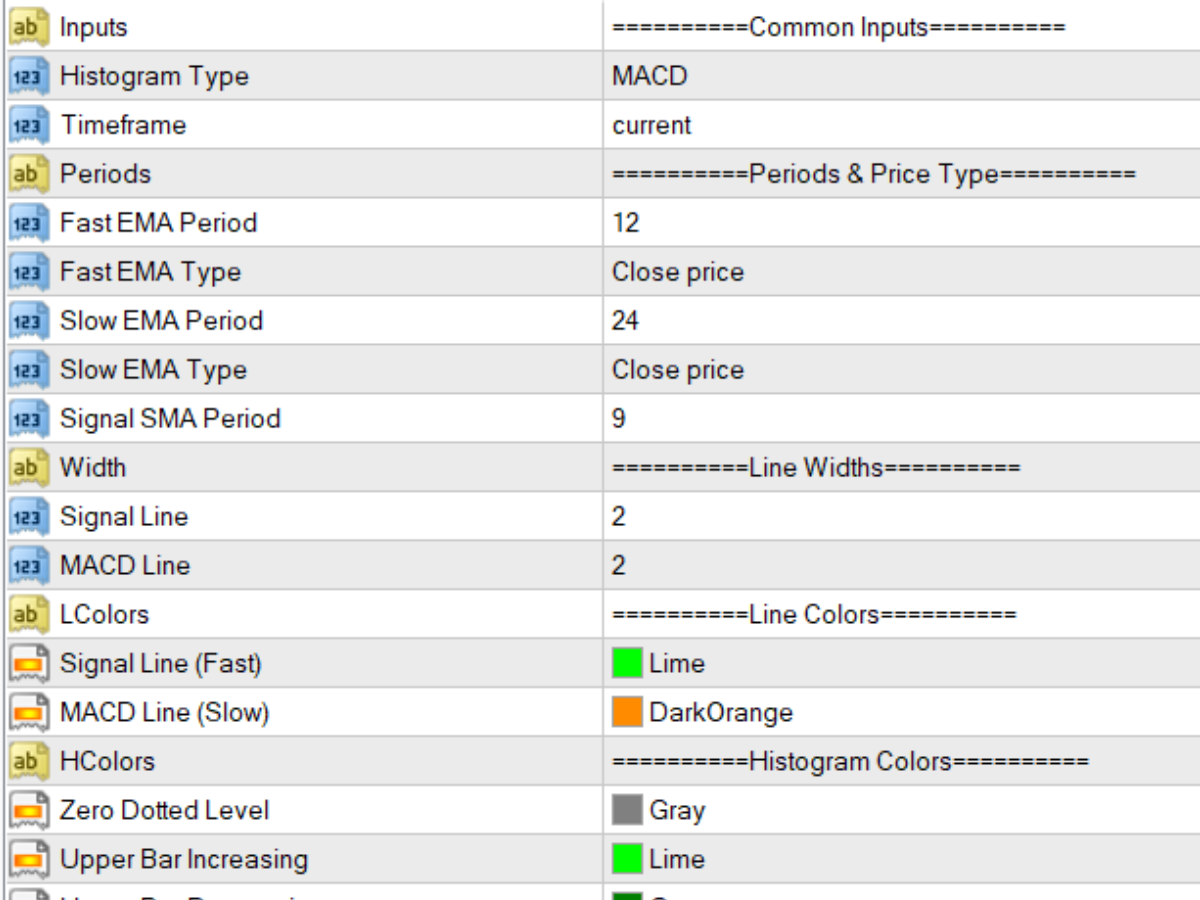
The Moving Average Convergence Divergence (MACD) işlem stratejisi, momentum ve trend yönündeki değişiklikleri belirlemek için kullanılan popüler bir teknik analiz aracıdır. MACD, 26 periyotlu üssel hareketli ortalamanın (EMA) 12 periyotlu EMA'dan çıkarılmasıyla hesaplanır. Ardından, "sinyal çizgisi" olarak adlandırılan 9 periyotlu EMA MACD'nin üzerine çizilir ve alım satım sinyalleri için bir tetikleyici olarak görev yapar.
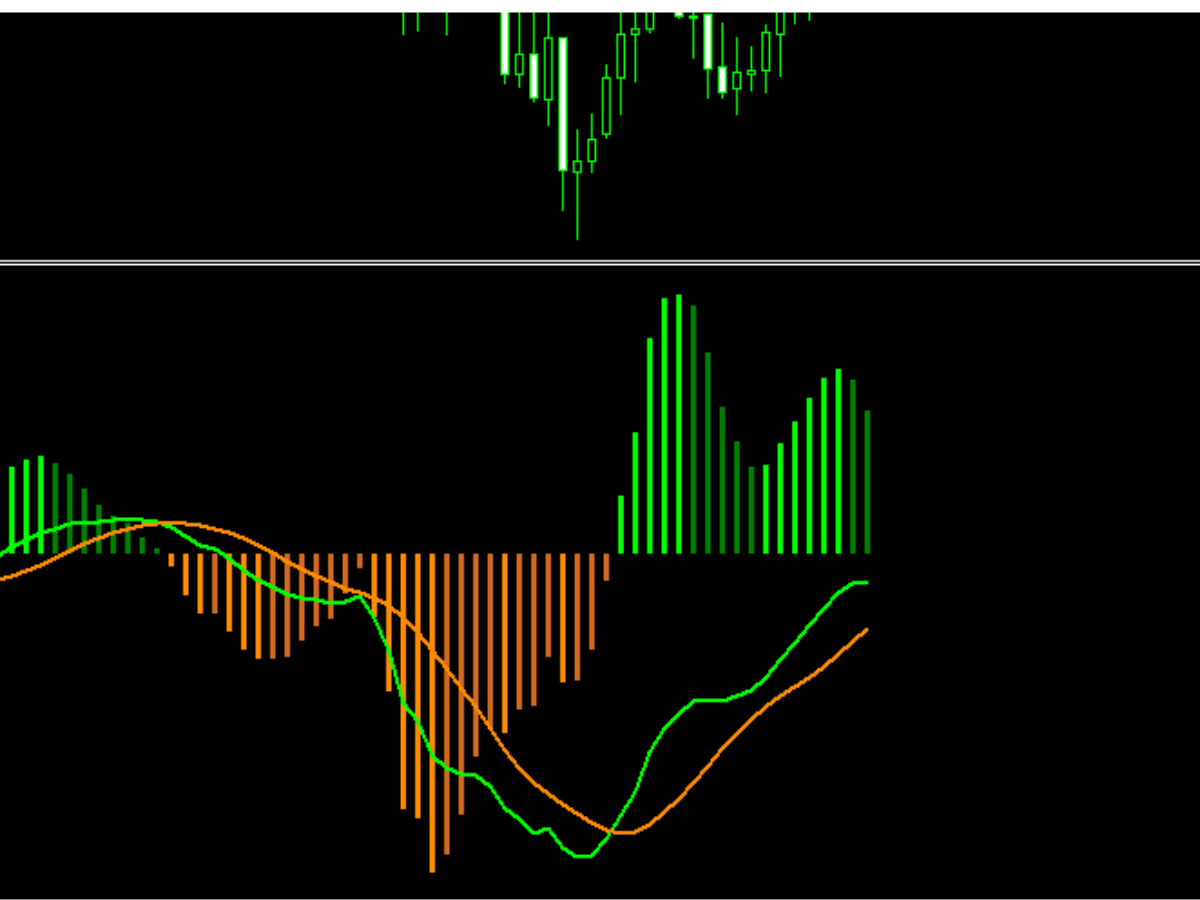
MACD, MACD hattı sinyal çizgisinin üzerindeyken boğa bölgesinde ve altındayken ayı bölgesinde kabul edilir. Bu bilgiyi kullanarak, yatırımcılar potansiyel alım satım fırsatlarını belirlemek için sıklıkla kullanırlar.
MACD çok yönlü bir göstergedir ve birçok şekilde kullanılabilir. Bazı yaygın kullanım şekilleri şunlardır:
- Geçiş: MACD hattı sinyal çizgisinin üzerine çıktığında boğa geçişi oluşur ve MACD hattı sinyal çizgisinin altına düştüğünde ayı geçişi oluşur.
- Ayrışma: Boğa ayrışması, MACD'nin temel güvenlik olmadığı sürece yeni yüksekler yapması ve ayı ayrışması, MACD'nin temel güvenlik olmadığı sürece yeni düşükler yapması durumunda oluşur.
- Trend Takibi: Boğa trendi, MACD sıfır çizgisinin üzerindeyken ve ayı trendi, MACD sıfır çizgisinin altındayken oluşur.
MACD'nin bir zamanlama göstergesi olduğu ve bir ticaret kararı vermek için diğer teknik göstergeler ve analizlerle birlikte kullanılması gerektiği unutulmamalıdır.


Great indicator