RelicusRoad MACD v2 MT5
- Indicators
- Relicus LLC
- Version: 2.0
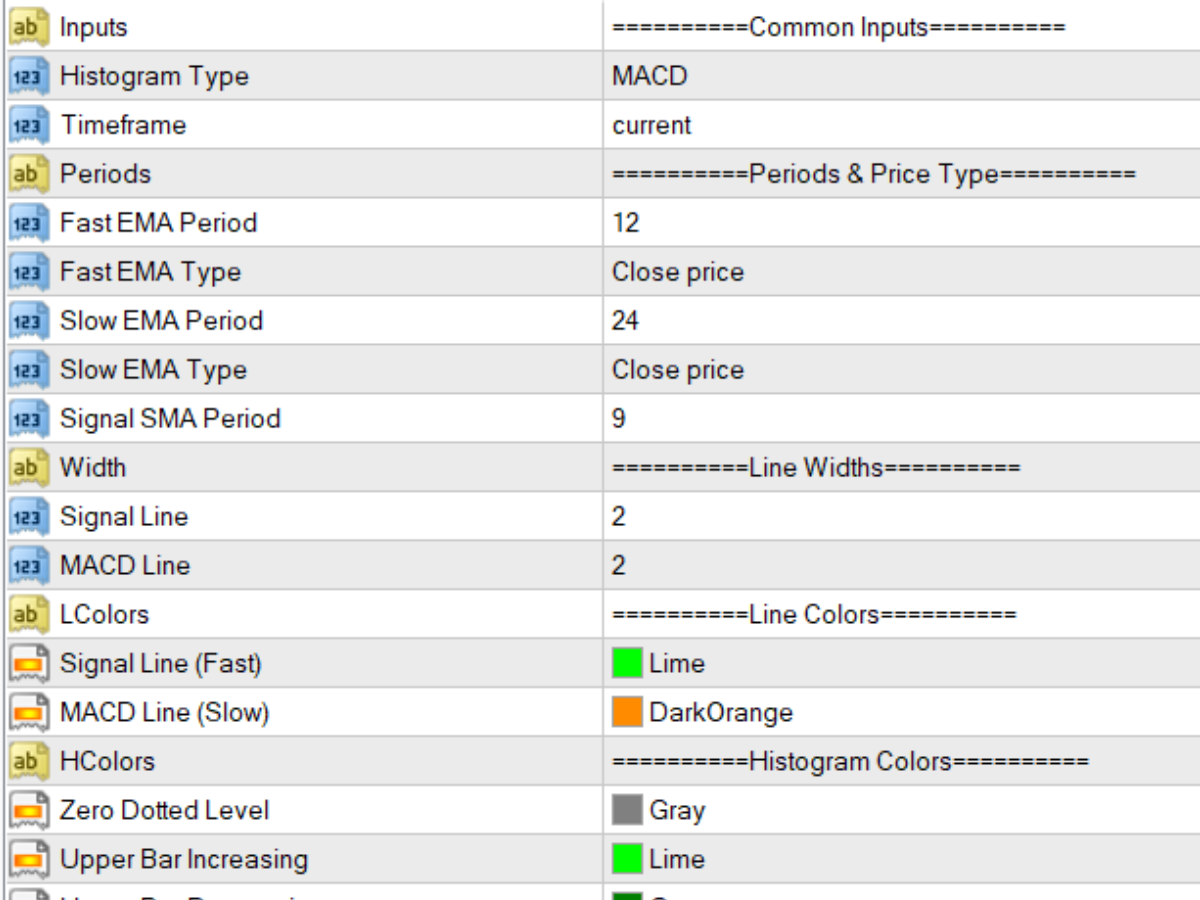
The Moving Average Convergence Divergence (MACD) trading strategy is a popular technical analysis tool that is used to identify changes in momentum and trend direction. The MACD is calculated by subtracting the 26-period exponential moving average (EMA) from the 12-period EMA. A 9-period EMA, called the "signal line," is then plotted on top of the MACD to act as a trigger for buy and sell signals.
The MACD is considered to be in bullish territory when the MACD line is above the signal line and in bearish territory when it is below. Traders often use this information to identify potential buy and sell opportunities.
The MACD is a versatile indicator and can be used in a variety of ways, some common ways to use it are:
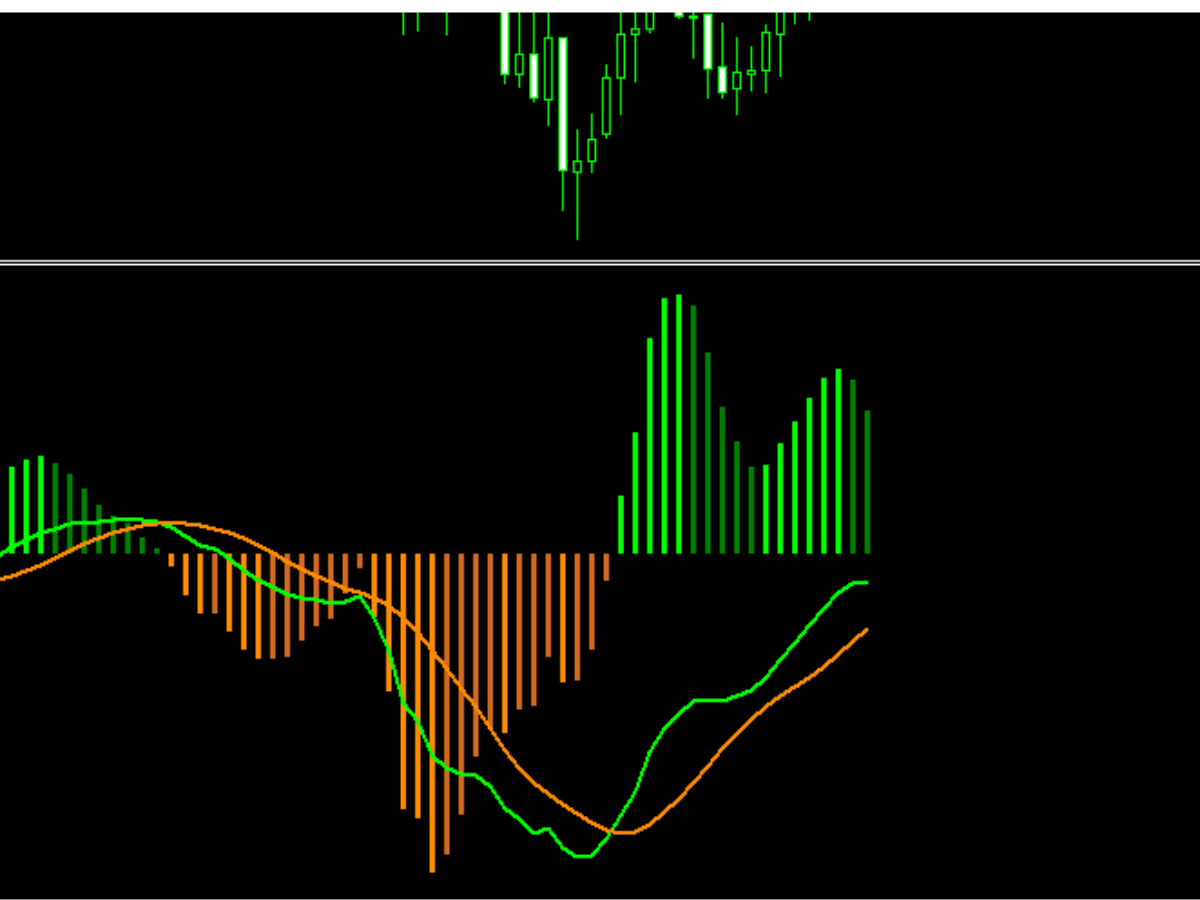
Crossover: A bullish crossover occurs when the MACD line crosses above the signal line and a bearish crossover occurs when the MACD line crosses below the signal line.
Divergence: A bullish divergence occurs when the MACD is making new highs while the underlying security is not, and a bearish divergence occurs when the MACD is making new lows while the underlying security is not.
Trend Following: A bullish trend occurs when the MACD is above the zero line and a bearish trend occurs when the MACD is below the zero line.
It is important to note that the MACD is a lagging indicator and should be used in conjunction with other technical indicators and analysis to make a trading decision.


Great indicator