RelicusRoad MACD v2 MT5
- Indikatoren
- Relicus LLC
- Version: 2.0
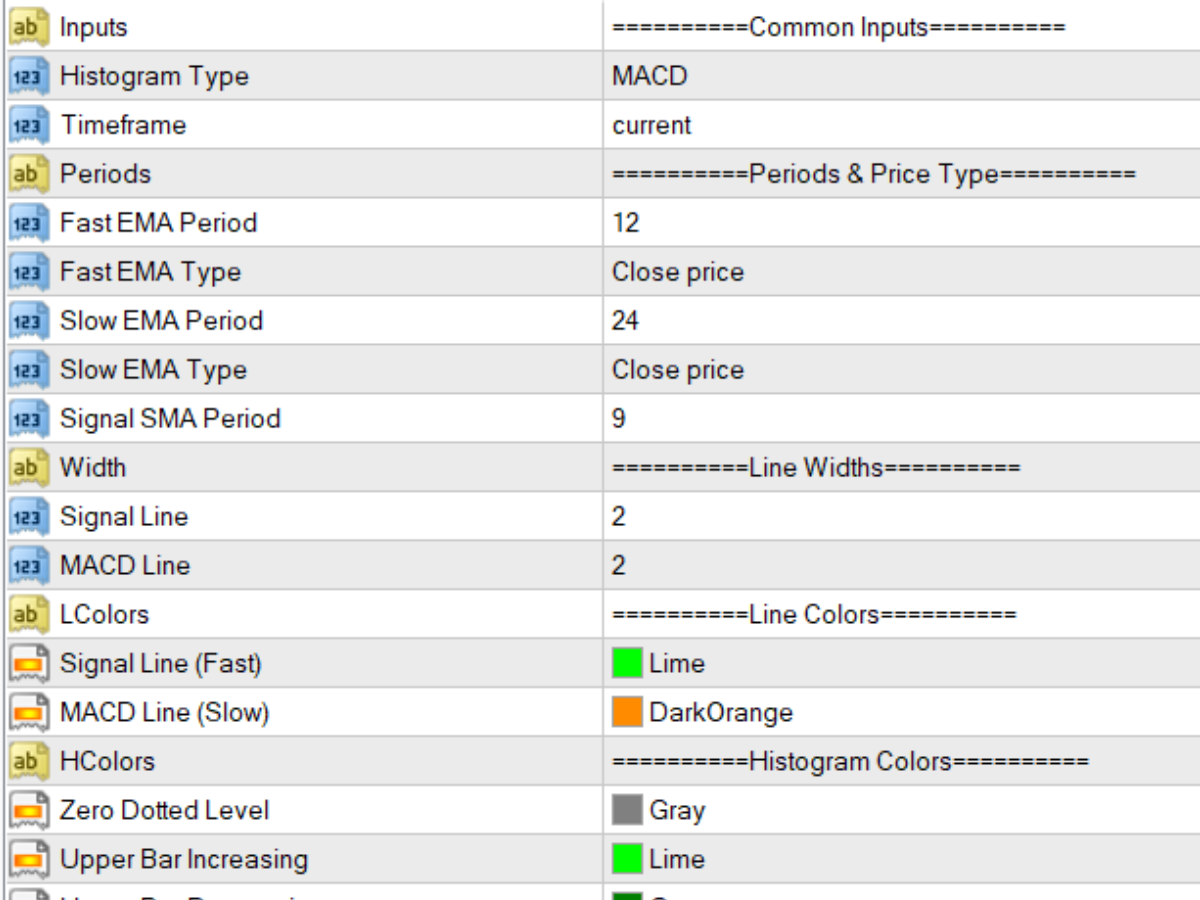
Die Moving Average Convergence Divergence (MACD) Handelsstrategie ist ein beliebtes technisches Analysewerkzeug, das verwendet wird, um Änderungen im Momentum und in der Trendrichtung zu identifizieren. Der MACD wird berechnet, indem man den 26-Perioden-exponentiellen gleitenden Durchschnitt (EMA) vom 12-Perioden-EMA subtrahiert. Eine 9-Perioden-EMA, genannt "Signal Line", wird dann oben auf den MACD geplottet, um als Auslöser für Kauf- und Verkaufssignale zu fungieren.
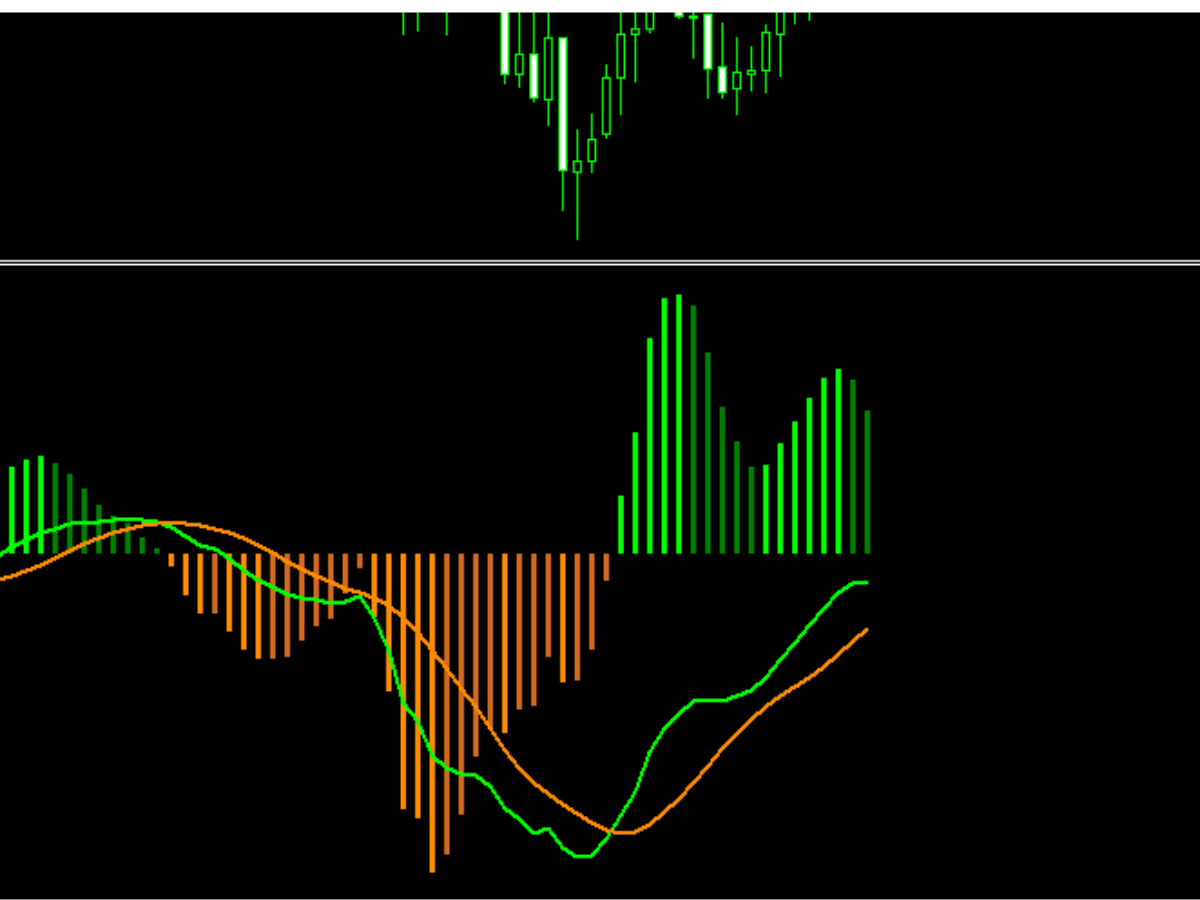
Der MACD wird als bullish betrachtet, wenn die MACD-Linie über der Signal-Linie und als bearish betrachtet wird, wenn sie darunter liegt. Händler nutzen diese Informationen oft, um potenzielle Kauf- und Verkaufsmöglichkeiten zu identifizieren.
Der MACD ist ein vielseitiger Indikator und kann auf verschiedene Arten verwendet werden, einige gängige Möglichkeiten sind:
- Crossover: Ein bullish Crossover tritt auf, wenn die MACD-Linie die Signal-Linie nach oben kreuzt, und ein bearish Crossover tritt auf, wenn die MACD-Linie die Signal-Linie nach unten kreuzt.
- Divergenz: Eine bullish Divergenz tritt auf, wenn der MACD neue Höchststände erreicht, während das zugrunde liegende Wertpapier dies nicht tut, und eine bearish Divergenz tritt auf, wenn der MACD neue Tiefstände erreicht, während das zugrunde liegende Wertpapier dies nicht tut.
- Trend Following: Ein bullish Trend tritt auf, wenn der MACD über der Nulllinie liegt, und ein bearish Trend tritt auf, wenn der MACD unter der Nulllinie liegt.
Es ist wichtig zu beachten, dass der MACD ein rückständiger Indikator ist und in Verbindung mit anderen technischen Indikatoren und Analysen verwendet werden sollte, um eine Handelsentscheidung zu treffen.


Great indicator