YouTube'dan Mağaza ile ilgili eğitici videoları izleyin
Bir ticaret robotu veya gösterge nasıl satın alınır?
Uzman Danışmanınızı
sanal sunucuda çalıştırın
sanal sunucuda çalıştırın
Satın almadan önce göstergeyi/ticaret robotunu test edin
Mağazada kazanç sağlamak ister misiniz?
Satış için bir ürün nasıl sunulur?
MetaTrader 5 için yeni Uzman Danışmanlar ve göstergeler - 160
A ready-made trading system based on automatic plotting and tracking of Fibonacci levels for buying and selling any symbol on any timeframe. Demo version - calculation of the last 290 bars is not performed.
Advantages Determines the trend direction (14 indicators) Displays the trend strength and the values of indicators comprising the trend direction Plotting horizontal levels, support and resistance lines, channels Selection of the Fibonacci levels calculation type (6 different methods) Alert
FREE
A ready-made trading system based on automatic plotting and tracking of Fibonacci levels for buying and selling any symbol on any timeframe.
Advantages Determines the trend direction (14 indicators) Displays the trend strength and the values of indicators comprising the trend direction Plotting horizontal levels, support and resistance lines, channels Selection of the Fibonacci levels calculation type (6 different methods) Alert system On-screen Email Push notifications
Buttons Changing the

Версия 2.0 2018.10.20 1. Добавлен расчет коэффициента ранговой корреляции Спирмена.
2. При наведении курсора на показатель таблицы появляется всплывающая подсказка (Расхождение RSI, направление сделок, информация о свопе). Table of currency pairs - разработана в помощь трейдеру торгующему на рынке Форекс по методу основанному на корреляционной зависимости валютных пар. Корреляционная зависимость между двумя инструментами рассчитывается через коэффициент К. Пирсона. Основная функция таблицы -
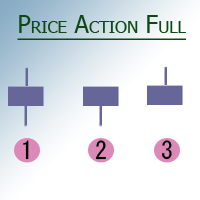
This indicator looks for 3 rather strong patterns: Spinning Top pattern Hammer or Hanging Man Inverted Hammer or Shooting Star These patterns may indicate a trend continuation or its reversal, depending on the location of the patterns.
Input parameters Zero - consider candles without a body Multiplier for hammerhigh - multiplier for the larger shadow of the Hammer Multiplier for hammerlow - multiplier for the smaller shadow of the Hammer Multiplier for wolf - multiplier for the shadows of the

The Trend Detect indicator combines the features of both trend indicators and oscillators.
This indicator is a convenient tool for detecting short-term market cycles and identifying overbought and oversold levels. A long position can be opened when the indicator starts leaving the oversold area and breaks the zero level from below. A short position can be opened when the indicator starts leaving the overbought area and breaks the zero level from above. An opposite signal of the indicator can

This panel shows the price position and the selected MAs for the selected timeframes and symbols.
You can control up to 3 symbols; up to 6 timeframes; up to 10 different Moving Averages. Version for MetaTrader 4: https://www.mql5.com/ru/market/product/28281 Version for MetaTrader 5: https://www.mql5.com/ru/market/product/28096
Parameters NUM_BAR - bar number for analysis; timeframe_1....timeframe_6 - names of used timeframes (if set to "current", the timeframe will not be used); symbol_1 .
FREE
The Detrended Price Oscillator (DPO) removes longer term trends, isolating short term price cycles. It allows for determination of cycle length and prediction of the current place in the cycle, determination of bull or bear trends and trend turning points, and provides several trade entry signals. There are two different ways of calculating the index, both of which are useful, and both of which are provided in the indicator parameters. The default setting for the SMA Averaging Period (n) will no
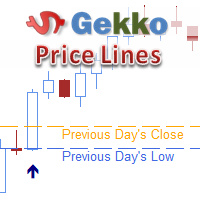
This is Gekko's famous Price Lines indicator. Historical prices benchmarks (like highest top in the year, lowest bottom in the month, week open, previous day's close, etc.) are usually important support or resistance areas that when broken produce great entry and exit point. This indicator will show you these important price benchmarks and will alert you when current price breaks through any of them.
Inputs Plot Strong Bar Arrows for the past X historical bars - the number of historical bars t
This tool will allow you to export the Historical data (Open, High, Low, Close, Volume) for any financial instrument present in your MetaTrader 5. You can download multiple Symbols and TimeFrames in the same csv file. Also, you can schedule the frequency of download (every 5 minutes, 60 minutes, etc.). No need to open a lot of charts in order to get the last data, the tool will download the data directly. The CSV File will be stored in the folder: \MQL5\Files .
How it works Select the Symbols
FREE

Free version. Only works on EURUSD Do you want to always know in a quick glance where price is going? Are you tired of looking back and forth between different timeframes to understand that? This indicator might just be what you were looking for. Trend Signal Multitimeframe shows you if the current price is higher or lower than N. candles ago, on the various timeframes. It also displays how many pips higher or lower current price is compared to N. candles ago. Number N. is customizable The data
FREE

Plug’n’Trade BR is an Expert Advisor with a minimum number of input parameters. The robot is designed for trading the Brent oil futures contract (BR) on FORTS derivatives market. Plug’n’Trade trades using unique technical indicators, which perform mathematical analysis of the price movement. The EA automatically sets the optimal stop loss and take profit. Plug’n’Trade works on M30 chart. All computations are performed when a new candle forms. This robot does not require optimization and is easy

This indicator looks for 3 rather strong patterns: Spinning Top pattern Hammer or Hanging Man Inverted Hammer or Shooting Star These patterns may indicate a trend continuation or its reversal, depending on the location of the patterns.
Input parameters Distance - distance between the signal and the formed signal Note: the higher the timeframe, the greater the value should be used in Distance to display the signal correctly
Indicator Features Suitable for any currency pair Operating timeframe
FREE

This is Gekko's Strong Bars indicator. It produces signals when there is a strong bullish or bearish bar, for that it uses three different conditions: 1 - when the current bar is higher/lower than the last x bars (x is an input parameter), 2 - when the current bar size is higher than the average size of the last x bars (x is an input parameter) and 3 - when the current bar has a short candle tail (shadow).
Inputs Plot Strong Bar Arrows for the past X Historical Bars: number of historical bars
The Wave Scalper EA is fully automated scalping system that uses price action to identify good scalping trades and executes them with an invisible trailing stop loss. It also includes a money management feature which calculates lot size based on account size and risk with an option to set a maximum draw down at which the EA will stop trading. This is a long term strategy combined with money management which works well on most pairs, but predominantly GBPUSD, USDCAD, EURUSD, AUDUSD & USDJPY. Plea
FREE

"LINKER" is an indicator that links any number of windows of the charts it is running on. A synchronized crosshair is also available, toggled by the (Ctrl) key or the (L) button. The visibility of the trade levels can be toggled on each chart separately using the (Shift) key or the (V) button. The buttons and the crosshair have customizable settings and colors. For instance, you need to analyze a trading instrument on different timeframes, for example, on H1, H4 and D1. Doing this in a single ch

MetaTrader 4 version is available here: MT4 Drawer . This tool allows you to draw on the chart using keyboard shortcuts. It also provides some custom drawing tools for your convenience. You can configure 3 variants for each tool (6 for advanced patterns), which you will be able to choose from dashboard. There is also, a possibility to define up to 30 quick access keys that skips the dashboard step and goes straight to drawing. Here are the list of supported tools: Advanced Pattern - draws two t
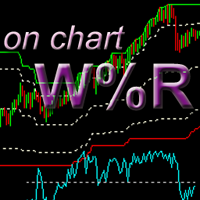
This is a variation of Williams' Percent Range indicator which draws high/low/mid range and overbought/oversold levels directly on the chart, where the last candle Close price corresponds to the %R value. Advantage of this representation is that it is possible to see exact extremum reaches by price (0 and -100 levels) and current price value in regards to overbought/oversold conditions. In addition, this indicator allows tracking price action on a different timeframe (for example, see the price

Visit our all-new Stein Investments Welcome Page to get the latest information, updates and trading strategies. Do you want to become a constantly profitable 5-star forex trader? Then get our Stein Investments trading tools and send us a screenshot to get your personal invitation to our exclusive trading chat with 500+ members.
Lighthouse is an outstanding precise and reliable support and resistance indicator.
It displays the most important trading levels and draws them according to

This indicator draws strong price levels (price consolidation levels). The levels are plotted using 2 MA indicators and 1 MACD using a complex algorithm. The algorithm used in the EA is also in personal use.
These levels have 4 variants (colors of the variants can be customized): strong up, weak up, strong down, weak down. In turn, a weak level usually appears and then it can become strong. A strong level can also become weak. Version MT4: https://www.mql5.com/en/market/product/27997/ Versio

The script creates a brief daily summary report of the weekly trade in a separate window.
Input parameters of the script number of weeks - set the time interval (the number of weeks) for the report. switch for symbols selection - three modes for selecting the instruments to generate the report: All_Symbols - report is generated for deals of all instruments. Current_Symbols_Only - report is generated only for deals of the instrument in the current window. Without_Current_Symbols - report is gen
"All in One" panel. You can simultaneously control: up to 3 symbols; up to 6 periods; up to 31 popular signals. You can see the sum for all signals taking into account the weight of the signal Version for MetaTrader 4: https://www.mql5.com/ru/market/product/27880 Version for MetaTrader 5: https://www.mql5.com/ru/market/product/27830
Parameters NUM_BAR - number of the bar to analyze (set a value greater than 0 to work on closed bars). timeframe_1....timeframe_6 - working timeframes (if set to "
FREE

This multi time frame and multi symbol indicator identifies high-probability breakout patterns. It does this by identifying strong, symmetrical pennants and triangles. This pattern DOES NOT appear very often on higher timeframes. But when it does, it is a very high-probability setup. The indicator also includes an Inside bars scanner. It can for example be used to detect a special type of Inside bars formation which is formed by a Master candle (MC) followed by 4 inside candles (please see the
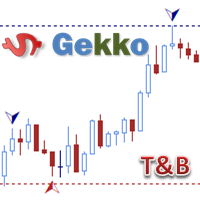
Type: Oscillator This is Gekko's Famous Tops and Bottoms indicators. Find important Tops and Bottoms on chart of any symbol or timeframe, based on set of configurations to adjust the indicator to the instrument you are trading.
Inputs Calculate Tops and Bottoms for the past X Bars: number of bars the indicator will plot Tops and Bottoms for, the fewer the faster. At Least Two Bars Making New Highs or Lows to Confirm: true - only consider a new High or Low when the last 2 bars have Highs or Low
Introduction to EFW Analytics EFW Analytics was designed to accomplish the statement "We trade because there are regularities in the financial market". EFW Analytics is a set of tools designed to maximize your trading performance by capturing the repeating fractal geometry, known as the fifth regularity in the financial market. The functionality of EFW Analytics consists of three parts. Firstly, Equilibrium Fractal Wave Index is an exploratory tool to support your trading logic to choose which r

This expert advisor can enter and exit trades at specific times and on specific weekdays, expressed in GMT Time. It offers weekday selection, trade management settings, a martingale function and money management features. [ Installation Guide | Update Guide | Troubleshooting | FAQ | All Products ] Easy to use and supervise Fully configurable entry and exit times (up to 5 trades)
Enable or disable trading weekdays in inputs
Customizable break-even, stop-loss, take-profit and trailing-stop setti
FREE
"All in One" Expert Advisor. It can work simultaneously on:
up to 6 periods; up to 31 popular signals. Features:
You can see the sum for all signals taking into account the weight of the signal Trades on each timeframe are managed separately from each other It is possible to set different Money Management for each timeframe Version MT4: https://www.mql5.com/ru/market/product/27996 Version MT5: https://www.mql5.com/ru/market/product/27835
Parameters NUM_BAR - number of the bar to analyze
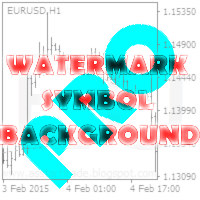
This utility displays the name of the current symbol and the current period in the chart background in a large font. It is very convenient, e.g. when you use multiple charts with different symbols, period or when saving a chart screenshot. The information is displayed in two lines. In the first line, the chart symbol and current timeframe are shown in a larger font (e.g. AUDUSD,h1 ). In the second line, the full name of the current symbol is displayed in a smaller font (e.g. for GPBJPY it shows
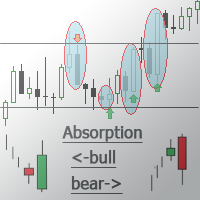
This indicator detects the Engulfing candlestick pattern and draws the corresponding market entry signal.
Features It works on all pairs and timeframes. The indicator analyzes a combination of 2 or 3 candlesticks depending on settings. The number of pre-calculated bars (signals) is configurable. The indicator can send an alert to notify of a found signal. Signal can be filtered by setting the number of candlesticks of the same color (trend) preceding the pattern formation. The indicator has an
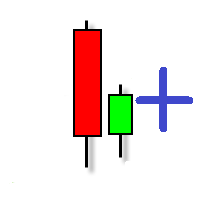
The indicator displays the inside bar pattern on the chart. Its distinguishing feature is the triple filtration. First, not all candles meeting usual conditions can be used as first candles here. It should be a "free" candle, meaning that its High or Low (depending on conditions) should have a free space to the left. The VSA method has a similar condition called 'new fresh ground' . In case of an uptrend, the candle's High should be free, in case of a downtrend, it is the candle's Low. Second, t

Improved version of the free HMA Trend indicator (for MetaTrader 4) with statistical analysis. HMA Trend is a trend indicator based on the Hull Moving Average (HMA) with two periods. HMA with a slow period identifies the trend, while HMA with a fast period determines the short-term movements and signals in the trend direction.
The main differences from the free version: Ability to predict the probability of a trend reversal using analysis of history data. Plotting statistical charts for analyz

The Expert Advisor is used to create Renko chart, realtime updates, easy for technical analysis. Backtest your strategy with all indicators with Renko chart in MetaTrader 5.
Parameters Box Size : input the number of box size. Show Wicks : if true , draw a candle with high/low. History Start: input the date to creat first candle.
Maximum Bars: limit number of bars on renko chart
How to use Attach the Expert Advisor to a chart (timeframe M1), for which you want to create a renko. Input box siz
The on-balance volume indicator (OBV) is a momentum indicator and was developed in 1963 by Joseph E. Granville. The OBV shows the importance of a volume and its relationship with the price. It compares the positive and negative volume flows against its price over a time period. To provide further confirmation that a trend may be weakening, Granville recommended using a 20-period moving average in conjunction with the OBV. As a result, OBV users could then observe such events more easily by notin
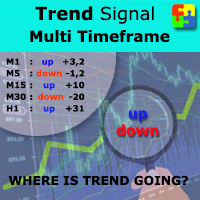
Do you want to always know in a quick glance where price is going? Are you tired of looking back and forth between different timeframes to understand that? This indicator might just be what you were looking for. Trend Signal Multitimeframe shows you if the current price is higher or lower than N. candles ago, on the various timeframes. It also displays how many pips higher or lower current price is compared to N. candles ago. Number N. is customizable The data is shown in a window that you can m
This indicator is designed to automatically build support/resistance levels. The indicator calculates the density of the price distribution in the specified time range and creates a table of volumes for each price. Levels are constructed from the minimum to the maximum volumes specified by the user. Some input parameters can be changed using hot keys without opening the settings window.
Inputs StartPoint - start bar number Range - length of the level in bars (time range) VolumeMin - minimum vo
The Aroon Indicator is a technical indicator showing whether a price is trending, the strength of the trend, and whether any reversal of trend or range-trading is likely. The indicator consists of two lines, the Aroon Bullish Line and the Aroon Bearish Line. The Bullish Line is calculated as (bars in period - bars since highest high in period)/bars in period, expressed as a percentage. The bearish line is calculated similarly since the lowest low. Both are plotted on the same chart. Thus, both l

The TickDelta indicator shows the difference in the number of oscillations of the best prices per unit of time. In this case, the unit of time is the specified timeframe (M1, M2, M5, M15, etc.). This value indirectly shows the market "sentiment". Due to the "tick-wise" nature, the indicator is more appropriate for use in scalping strategies. When applied in conjunction with real volumes and monitoring of various instrument charts, it is possible to identify certain reversal setups. In some cases

Hamster Scalping tam otomatik bir ticaret danışmanıdır. Gece ölçeklendirme stratejisi. Giriş olarak RSI göstergesi ve ATR filtresi kullanılır. Uzman Danışman, bir riskten korunma hesabı türü gerektirir.
ÖNEMLİ! Talimatları ve bonusu almak için satın aldıktan hemen sonra benimle iletişime geçin!
Gerçek işin izlenmesi ve diğer geliştirmelerim burada görüntülenebilir: https://www.mql5.com/en/users/mechanic/seller
Genel öneriler
Minimum para yatırma 100 $, minimum spread ile ECN hesaplarını

Multicurrency and multitimeframe modification of the Stochastic Oscillator. You can specify any desired currencies and timeframes in the parameters. The panel displays the current values and intersections of the lines — Signal and Main (stochastics crossover). Also, the indicator can send notifications when crossing overbought and oversold levels. By clicking on a cell with a period, this symbol and period will be opened. This is MTF Scanner. The key to hide the dashboard from the chart is "D"

Multicurrency and multitimeframe modification of the Relative Strength Index (RSI) indicator. You can specify any desired currencies and timeframes in the parameters. Also, the panel can send notifications when crossing overbought and oversold levels. By clicking on a cell with a period, this symbol and period will be opened. This is MTF Scanner. The key to hide the dashboard from the chart is "D" by default. Similar to the Currency Strength Meter, the Dashboard can automatically select pairs c

The VR Orders History script is designed to upload a trade report to a csv file. This format is intended for additional analysis of trading history in programs such as EXCEL, Openoffice, and Libreoffice. Thanks to the script, it is now much easier for a trader to analyze their trading history. The program facilitates the analysis of the trading history for the MetaTrader 5 terminal. The trader sees structured trading. The entire report is based on the following principle: Position > Order on the
FREE
The USDJPY Trader EA is an automated trend following system that is always in the market and trades using sell stop and buy stop orders with trailing stop losses to capture large movements in the market. It also includes a money management feature which calculates lot size based on account size and risk with an option to set a maximum draw down at which the EA will stop trading. This is a long term strategy combined with money management and will work on any pair but works best on USDJPY M15. Vi
FREE
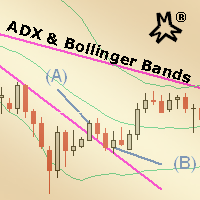
MMM ADX & Bollinger Bands & MA strategy: This EA's strategy combines two built-in indicators to enhance its signals and decide to open a new order at the right time. There is an ADX indicator and you may choose its signal's strength and Bollinger Bands indicator confirms the trends and MA to check if the prices are deviating from its pattern. By joining both indicators' data and the moving average, it is possible to calculate quality signals, avoiding sudden market movements against your tradin

This tool allows you to better analyze your chart. With "Crosshair Percent", you can calculate distances in the chart in a percentage way (in a very simple way, when the pointer is attached in the form of a crosshair: CRTL + F). The utility allows to measure and/or calculate the movements of the price NOT only in points, use a measure in professional terms as it is the percentage. The result is shown in two parts of the screen, one of them, next to the position of the pointer and the other in a
The Complex Chaos EA is an automated system that uses a pair of exponential moving averages to detect the market direction and opens trades on candle open. If the market moves against a trade it will at a set distance open another trade in the same direction to move the take profit of the group of open positions closer to the current price and make the group of trades winners overall once the price reverses. If a change in direction is detected then all trades are closed and it starts trading in
FREE

The Bollinger R (Bollinger Reversals) is designed to recognize short term high profitable counter trend patterns from the chart. This system combines both Bollinger Bands and mean reversion to define positions where the market could potentially reverse direction. This is the MT5 version of Bollinger R Description Bollinger Bands are well known in the trading community. I have added the concepts mean reversion and "distance between Price and a Moving Average" to help confirm and trade the “bounce
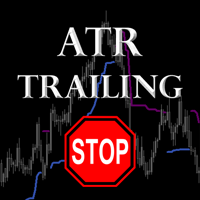
The ATR (Average True Range) Trailing Stop indicator gives a suggested trailing stop level for exiting trades. Designed to help you stay in a position for as long as possible, without getting stopped out too early by intra-bar volatility. Based on average true ranges over the last few bars, plus current price action, the indicators gives a steadily increasing line below the current price for rising markets and a steadily decreasing line above the price for falling markets. These levels are the s

Breakthrough Solution For Trend Trading And Filtering With All Important Features Built Inside One Tool! Trend PRO's smart algorithm detects the trend, filters out market noise and gives entry signals with exit levels. The new features with enhanced rules for statistical calculation improved the overall performance of this indicator.
Important Information Revealed Maximize the potential of Trend Pro, please visit www.mql5.com/en/blogs/post/713938
The Powerful Expert Advisor Version
Automa

Hull Moving Average (HMA) is well-deservedly popular among traders because of the effective averaging of market noise and a relatively small delay. The current MetaTrader 5 version changes its color when the movement direction changes. Sound and text signals are available. It also supports sending email and push messages. It is possible to trigger a signal on the current incomplete bar, although such a signal may be canceled before completion if conditions are no longer appropriate. One of the p
FREE
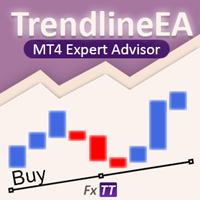
The FXTT Trendline EA for MT5 is a robot that helps you trade using the trendlines drawn on your chart. It basically allows you to set pending orders using trend lines . Something that Metatrader does not allow you to do by default. Easy to set up Choose default Lot size , Stop Loss and Take Profit Allows action on Touch, Pullback, Breakout or False Breakout of trendline The usage and configuration of the Expert Advisor is as follows: Load the EA Draw your trendlines on the chart Add Buy or Sell
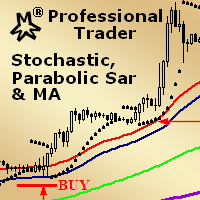
MMM Stochastic, PSAR & MA: This EA's strategy is a combination of two indicators types (Oscillator and Trend) and a Moving Average which helps to enhance the price trends signals and decide to open a new order at the right time. There is an Stochastic (Oscillator) indicator, a Parabolic SAR (Trend) indicator and a Moving Average that you may tune by using the strategy tester optimization to help you to find the best input values that will give you the best results ; It is highly recommended for
This trend Expert Advisor is based on an original interpretation of the Bollinger Bands indicator. This signal generation method allows entering the market at the very beginning of the trend with a tight stop loss. The EA contains 6 options for position closure signals, which allows selecting the best one depending on the instrument, as well as market conditions. All positions are protected by virtual and fail-safe stop loss. The virtual stop loss triggers only after a bar closes beyond its leve

All traders face to a serious question: How to estimate trading strategy performance and control risk in real-time? Eventhough use backtest and optimizing in strategy tester, but unfortunately, trader need to deal with the curse of curve-fitting, because optimized result is just for the specific set of historical data that was tested. This indicator retrieves deal information from historical data then draws balance and equity curve of account and calculate drawdown in REAL-TIME. It helps trader
In today’s market, an objective counter trend technique might be a trader’s most valuable asset. Most of the traders in the financial market must be familiar with the name "TD Sequential" and "Range Exhaustion". The Sequential R is a Counter-Trend Trading with Simple Range Exhaustion System. Sequential R is useful to identify trend exhaustion points and keep you one step ahead of the trend-following crowd. The "Sequential R" is designed to recognize profitable counter trend patterns from your ch

ScalpingProMt5 is a new indicator for professional traders. The indicator is a ready-made scalping strategy. The algorithm calculates a micro trend, then searches for price roll-backs and forms a short-term trading signal according to the market price. The indicator consists of a data window and a graphical signal on the chart in the form of an up or down arrow. The data window displays the current trading symbol, spread and appropriate trader's actions: WAIT, SELL and BUY .
Advantages the ind

This long-term trading system works on 9 pairs and timeframe. The Expert Advisor uses various trading systems, such as trend trading, counter-trend trading and others. The EA has the built-in smart adaptive profit taking filter. The robot has been optimized for each currency and timeframe simultaneously. EA uses economic news. No martingale, grid and other risky strategies. EA uses timeframes:
MetaTrader 4 MetaTrader 5 M5, M15, M30, H1 M2, M3, M4, M5, M6, M10, M12 , M15, M20, M

The BuySellArrows is an indicator without any input parameters. This makes it an easy-to-use trend trading indicator for beginners, advanced and professional traders. The main purpose of this indicator is to detect and mark (with arrows) a local trend, which is one of the most important problem for a trader regardless of their trading style. The main coding algorithm inside the indicator is calculating the speed and direction of the price change. This indicator will show Buy (color Aqua) or Sell

Monitoring : https://www.mql5.com/en/signals/author/yarkan
Features no use of any indicators Uses averaging with an increased lot Open prices only (an EA that explicitly controls bar opening) Trades Buy and Sell independently. In the EA parameters, you can set Buy, Sell or BuySell (for Hedge accounts) Displays the trade information in the top left corner of the chart
Recommendations Timeframe: M1 Leverage 1:500 Rebate to refund part of spread or commission
Parameters Pairs - setting the pa

Fibonacci decorator is a unique product that decorates Fibonacci objects. This indicator can change the specific level line of a Fibonacci object. This tool caters to both beginners and advanced traders using Fibonacci objects.
Advantages Supports three Fibonacci objects: Fibonacci Retracement Fibonacci expansion Fibonacci time zones Just add the mark of your choice to the description of a Fibonacci object's level Easy setting This indicator does not work well with Strategy Tester. Please down

DAR Portfolio Modeller Expert Advisor forms an investment share portfolio. Its model is based on two key indicators of any financial instrument - profitability and risk that are both quantified. According to the model, the profitability is a mathematical expectation of profit, while risk is defined as a profitability distribution near the mathematical expectation and calculated using the standard deviation. Unlike other similar programs, you do not have to manually download history and insert it
TSI - Trend Semaphore Indicator
Work tool developed to display the force of movement. This tool was developed for Trend Following strategies. Recommended for all types of traders. Can be used in any instrument and market. Can be used in any period of time. Trend indication using multicolored candles.
New trend A new trend is signaled by the changing colors on the chart's candles. The indicator indicates the upward trend with the green color, the downward trend by the red color and weak moveme
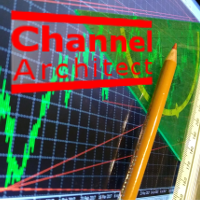
This indicator calculates and draws lines over the chart. There are two types of channels: Channel A: the mainline is drawn using local lows for uptrends and local highs for downtrends Channel B: the mainline is drawn using local highs for uptrends and local lows for downtrends The parallel lines of both types are built using the max. fractal between the base points of the mainline. There are a few conditions, which have to be fullfilled and can be changed by the parameters (see also picture 4):

Displays multiple indicators, across multiple timeframes and symbols to give a comprehensive overview of the market. Uniquely, the indicators are configurable and can include custom indicators, even those where you just have the ex4 file or those purchased from Market. Standard indicators can also be selected, the default being ADX, CCI, market price above/below Moving Average (MA), Moving Average Cross (MAX), MACD, Momentum (MOM), OsMA, RSI, Parabolic SAR, William's Percentage Range (WPR). Use
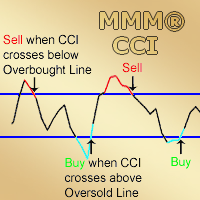
MMM Commodity Channel Index Strategy: The robot uses its two built-in improved and tested CCI indicators to determine the prices trends and calculates the signal for buying or selling. It sends an order, closes or moves the Trailing Stop loss position as the indicator works. Perfect for scalping. It will not send an order unless the calculations determine a good trend of profit. Like all MMM products, it is also programmed to minimize your losses and protect your money from the hostile market. W

Maintaining a trading log allows you to save all your market entries and exits. Perhaps, your terminal can do this for you. Order Viewer displays trades from your trading log on the chart at any moment. You can share this log with your friends to show your trading and see how others trade. The entries format in your trading log should be as follows: YEAR-MM-DD HH:MM:00.000 TICKER SIZE PRICE Below is the sample log in the Excel table ( saved as a csv file ): Date and time
Symbol Position
Price

When using CCI (Commodity Channel Index) oscillator, the waiting time till the next signal can be long enough depending on a timeframe. CCI Alerts indicator prevents you from missing the indicator signals. It is a good alternative for the standard CCI indicator. Once there appears a CCI signal on the required level, the indicator will notify you with a sound or push, so you will never miss an entry. This is especially significant if you follow the indicator in different timeframes and currency p

EvoNightEA MT5 v.10.3 Presets: Download >>> EvoNightEA MT5 v.10.3 Live Results: Here >>> EvoNightEA is a fully automated Expert Advisor based at midnight scalping during the low market volatility. EvoNightEA is based on the principles of channel trading and Price Action. The system analyzes the price movement in the daily range and, based on the data obtained, trades in the low-volatility market in rollover. Most of the parameters are dynamic, thus reducing the chance of overfitti

Renko Expert Advisor based on Renko bar simulation. The EA has two options for building Renko bars. Classic and ATR. In the classic version, renko bars are marked with areas on the main chart; in the ATR version, renko bars are modeled and drawn in the indicator window. Modeling renko bars inside the EA allows you to optimize the robot better than drawing renko bars offline.
Telegramm channel Set file Our second robot RENKOTREND Does not use martingale! Trades opened by the robot co
FREE

Cryptocurrency analysis has never been easier with Crypto Charts for MetaTrader 5. Just pick up a chart from bitcoin to exotic coins, choose your desired time frame and attach all your favorites indicators from thousands ones available at MQL5. Chart from Binance Futures, Poloniex , Bitfinex , Binance , BitMEX , Bittrex , BitMEX Testnet exchanges! Make better analysis, make better tradings! Do you want to auto trade on BitMEX exchange? Please take a look at BitMEX Trading API Crypto Char

Salva EA is an advanced and fully automated system. The basis of this strategy is the price chart itself, the trade is conducted from the price movement range.
Benefits This is not martingale, not arbitration Ready for operation without PreSetting Always use a stop loss and take profit to save your investments Easy to use (does not have complex settings) The results of the tester converge with the results on a real account High speed testing (can be optimized for 1 minute OHLC) Salva EA works

ReviewCandleChart is a unique product that can verify past price fluctuations using candlestick charts. This indicator accurately reproduces market price fluctuations in the past and can make trading decisions (entries, profits, loss cut) many times so that you can learn the trading faster. ReviewCandleCahrt is the best indicator to improve trading skills. ReviewCandleCahrt caters to both beginners and advanced traders.
Advantages of the indicator This Indicator for verifying price fluctuation
MetaTrader Mağazanın neden ticaret stratejileri ve teknik göstergeler satmak için en iyi platform olduğunu biliyor musunuz? Reklam veya yazılım korumasına gerek yok, ödeme sorunları yok. Her şey MetaTrader Mağazada sağlanmaktadır.
Ticaret fırsatlarını kaçırıyorsunuz:
- Ücretsiz ticaret uygulamaları
- İşlem kopyalama için 8.000'den fazla sinyal
- Finansal piyasaları keşfetmek için ekonomik haberler
Kayıt
Giriş yap
Gizlilik ve Veri Koruma Politikasını ve MQL5.com Kullanım Şartlarını kabul edersiniz
Hesabınız yoksa, lütfen kaydolun
MQL5.com web sitesine giriş yapmak için çerezlerin kullanımına izin vermelisiniz.
Lütfen tarayıcınızda gerekli ayarı etkinleştirin, aksi takdirde giriş yapamazsınız.