YouTube'dan Mağaza ile ilgili eğitici videoları izleyin
Bir ticaret robotu veya gösterge nasıl satın alınır?
Uzman Danışmanınızı
sanal sunucuda çalıştırın
sanal sunucuda çalıştırın
Satın almadan önce göstergeyi/ticaret robotunu test edin
Mağazada kazanç sağlamak ister misiniz?
Satış için bir ürün nasıl sunulur?
MetaTrader 5 için ücretli teknik göstergeler - 29

Sayı dizilerinden birine "Orman Yangını Dizisi" denir. En güzel yeni dizilerden biri olarak kabul edildi. Başlıca özelliği, bu dizinin lineer trendlerden, hatta en kısa olanlardan kaçınmasıdır. Bu göstergenin temelini oluşturan bu özelliktir. Bir finansal zaman serisini analiz ederken, bu gösterge tüm olası trend seçeneklerini reddetmeye çalışır. Ve ancak başarısız olursa, bir trendin varlığını tanır ve uygun sinyali verir. Bu yaklaşım, yeni trendlerin başladığı anların doğru bir şekilde belirl

Theory VWAP is a volume-weighted moving average, bringing greater relevance to prices. The VWAP base calculation follows the classic formula described in Investopedia ( https://www.investopedia.com/terms/v/vwap.asp ). VWAP = sum(typical price[i]*volume[i]) / sum(volume[i])
Functionalities
Orion Intraday VWAP innovates by allowing the user to choose between the conventional Daily, Weekly and Monthly periods, also having the option of calculating the Intraday indicator, as used in other platfo

Signal provider based on RSI Divergences
from a higher timeframe.
First 3 buffers export a signal.
Timeframe for which divergences are detected is optional, see
'RSI divergences timeframe' parameter.
The indicator uses different algorithms for divergences detection:
'Fast' algorithm is the simplest solution that works the fastest.
'Strict' algorithm filters out more noise but works slower than the previous one.
'Full' algorithm uses recursive functions and provides with lots of d

Bu ürün kanal ölçeklendirme sayesinde kapanış barlarında sinyal üretir.Bu sinyalleri bir ok sayesinde görselleştirir.Ok rengi işlem yönünü ifade eder.Varsayılan ayarlar H1 periyot için geçerlidir.Her periyot ve ürün için backtest yapabilirsiniz.İndikatörün kod içeriği mümkün olduğunca fiyat hareketlerine uygun bir şekilde uygulanmıştır.Bu sebeple trend başlangıçlarını ve sonlarını iyi tespit eder. Parametre açıklamaları: PER: Hesaplanacak bar sayısını ifade eder. PRO: Kanal genişleme faktörünü h

Three Triple Exponential Average oscillators merged into one. Fast period will pull on the slower period, and the slower will smooth out the faster and avoid early positions. You can use 2 fast and 1 slow, or Fibonacci range or 2 slow, 1 fast. NOW FREE. But please consider supporting me by buying my 2 for sale indicators.
You can use this as an entry indicator and exit indicator. Open when the tripleTRIX line crosses the zero line and close when it starts to reverse. When the peaks get bigger,

Smart Market Scanner and Dashboard The trend is very important when trading a financial instrument. The trend can be identified by checking various of structures and indicators. Trend shifts can be identified by trendline breakouts and horizontal support/resistance levels. Scanner will scan the selected symbols and show you the direction/trend on selected timeframes. Algo is based on: Price Cycles, Fractals, Order Blocks, Hi-Lo
Advantages: Multi timeframe Multi instruments including Currencies

UR Ön UçArka Uç
UR FrontEndBackEnd, en doğru destek ve direnç seviyelerini bulmak için en sevdiğim formüldür. Ayrıca ne kadar güçlü olduklarını işaretlemek için bunları farklı kategorilere (kesikli çizgiler, düz çizgiler ve alanlar) ayırdım. Tümü arabelleklerde saklanır, böylece diğer araçlara kolayca erişilebilir ve uygulanabilir.
Ek: Aracın uygulandığı varlığa göre ayarlanması gerekebilir - varlığın aracı etkileyen fiyattaki basamak sayısı farklılık gösterir. Bunun için gerekli parametr

Awesome Oscillator by Bill Williams with the ability to fine-tune and replace the averaging algorithms of the indicator, which significantly expands the possibilities of using this oscillator in algorithmic trading and brings it closer in its properties to such an indicator as the MACD. To reduce price noise, the final indicator is processed with an additional Smooth averaging. The indicator has the ability to give alerts, send mail messages and push signals when the direction of movement of th

DESCRIPTION The EasyFollowerTrader Bot1 DayTrade indicator operates only in favor of the majority trend. Thus, the indicator, at first, observe the trend of the daily chart to operate in its favor. Then the indicator watch the current chart trend. When these two charts are moving in the same direction, we have the highest probability of winnings. We will call this region the region of high probability of gain. In the region of high probability of gain, the indicator will indicate the best ent
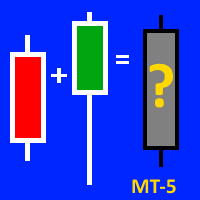
This indicator will be VERY USEFUL for anyone who works with candlestick patterns. This indicator is designed to display the average figure from two adjacent candles (current and previous). Accordingly, it shows IN CONTEXT the strength or weakness of bulls / bears (!). But please, don't forget about the classical basics of technical analysis (!). All indicators are just an auxiliary tool for reading a chart (!). A demo version on the example of mt-4 can be found here: https://www.mql5.com/ru/ma

Book Map Order Flow shows the price and volume, processing the DOM. See the volume in a better way. See the support and resistance and the possibility of breakouts of them. Input up to 20 price levels to see where the volume is trading and what side. The indicator was made from an EA by denkir but it needed include files to work so I developed and indictor from this out of MQL5 how to cookbook article here: https://www.mql5.com/en/articles/1793 . It can be an easy and valuable tool for all.

Accelerator Oscillator by Bill Williams with the ability to fine-tune and replace the averaging algorithms of the indicator, which significantly expands the possibilities of using this oscillator in algorithmic trading and brings it closer in its properties to such an indicator as MACD.
To reduce price noise, the final indicator is processed with an additional Smooth averaging. The indicator has the ability to give alerts, send mail messages and push signals when the direction of movement
I really like this indicator. But I made it, so of course I would.. NOW FREE. But please consider supporting me by buying my 2 for sale indicators. You can multiply the weight of each indicator used to give more emphasis on it's value when averaging between the 3. Boost fast TEMA and it can move the indicator faster. Boost slow FrAMA and watch it smooth out. I like to use them as open/close lines and set them up so they move quick, but have the FrAMA smooth it out more.
Check out my other ind

В основу алгоритма этого осциллятора положен анализ веера сигнальных линий технического индикатора RSI . Алгоритм вычисления сигнальных линий выглядит следующим образом. В качестве исходных данных имеем входные параметры индикатора: StartLength - минимальное стартовое значение первой сигнальной линии; Step - шаг изменения периода; StepsTotal - количество изменений периода. Любое значение периода из множества сигнальных линий вычисляется по формуле арифметической прогрессии: SignalPeriod(Number)

Wink IND is an indicator that tell you: -when MACD is saying buy or sell -when RSI is saying buy or sell -work on multi timeframes MT4 Version
by Wink IND: you don't need to have Knowledge about MACD or RSI don't need to check and compare MACD and RSI respectly don't need to check all of timeframes and compare the resaults don't lose time, save more time for your decisions in trading
Wink IND: multi timeframe indicator multi currency indicator show the positions by graphic shapes, arrows an

В основу алгоритма этого трендового индикатора положен анализ веера сигнальных линий универсального мувинга I . Алгоритм вычисления сигнальных линий выглядит следующим образом. В качестве исходных данных имеем входные параметры индикатора: StartLength - минимальное стартовое значение первой сигнальной линии; Step - шаг изменения периода; StepsTotal - количество изменений периода. Любое значение периода из множества сигнальных линий вычисляется по формуле арифметической прогрессии: SignalPeriod(

ESS ETKİLEYİCİ DURUM SİNYALLERİ
Bu gösterge, bir filtrenin uygulandığı zarf tipi mumları algılar, bu filtre, ölçülebilir parametreler dahilinde mümkün olan en büyük etkinliği belirlemenin mümkün olduğu 3 stratejiden oluşur.
Sinyaller, her yön için yukarı ve aşağı oklarla gösterilir ve ayrıca uyarıları, e-postaları ve cep telefonuna push mesajlarını etkinleştirebilir veya devre dışı bırakabilirsiniz.
Hiçbir göstergenin %100 etkili olmadığını belirtmekte fayda var, bu nedenle kendi strateji

The Active Trend indicator helps to analyze the market on the selected time interval. It defines the mainstream. Used in trading. You can use so basic to determine the trend. The indicator works well on both short and longer trend sections. In flat it is recommended to use filters of your choice. It can accompany the position with a stop, it is recommended to set the stop at a fixed distance from the point formed by the indicator. The simplest way to use the indicator is to open a trade in the
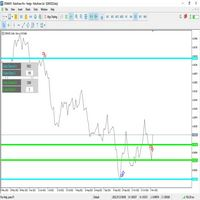
Gösterge Fiyat Kanalı, iki bağımsız fiyat kanalı ve fiyat bölgesi seviyesinden oluşur - (A / B). Gösterge, fiyatların davranışını ve hareketini ve ayrıca kanal seviyelerinin - (A / B) bozulmasını, seviyeleri yeniden düzenlemeyi ve yeni ekstremum ve minimum bölgeleri sabitlemeyi sürekli olarak izler. Önceki ve mevcut en yüksek ve en düşük seviyelerin analizi için, her kanaldaki çubuk sayısına bağlı değildir - (A / B). Gösterge, grafikteki her kanal için yararlı bilgiler görüntüler - (A/B): 1. He

Angle of Moving Averages This indicator is very simple yet powerful concept which constantly calculate the slope of the current bar moving average with respect to the N bar before moving average value. This no only give a good entry and exit signal but also it shows traders the strength of the signal. It shows positive green histogram when market is moving toward upward direction and red histograms for downtrend. When large histograms found means market has very strong trend. Inputs Available
Silas is a trading assistant for multi-timeframes traders. It show on the screen, in a very clear way, all the informations needed to suits to your trading. It show : - Supply and demand zone from 2 timeframes of your choice - Setups based of market structure from 2 timeframes of your choice - Daily current high and low points - The last 2 closed candles and the current candle from an higher time frame on the right of the graph. - Actual daily candle on the left Everything is customisable !

DESCRIPTION
The EasyFollowerTrader-Bot3-DayTrade indicator only trades with the trend. Thus, the indicator will, at first, observe the trend of three averages synchronous with the selected time-frame. Then the indicator observes the trend of the daily chart. When these two charts are moving in the same direction, we have the highest probability of winnings. We will call this region the region of high probability of gain.
In the region of high probability of gain, the indicator will indicate

The indicator calculates intraday levels based on the average daily price range, builds support and resistance levels that may be reversal.
Parameters Period ATR - period of the ATR indicator Shift time - time offset for the opening of the day Color opening of day - color of the opening line of the day Color 1AR, -1AS - line color 1AR, -1AS Color AR 1/2, AS -1/2 - line color AR 1/2, AS Color AR 1/4, AS -1/4 - line color AR 1/4, AS -1/4 Color AR 3/4, AS -3/4 - line color AR 3/4, AS -3/4 Colo

DESCRIPTION
The EasyFollowerTrader Bot4 DayTrade indicator always trades with the trend. Thus, the indicator, at first, observes the trend of the average of the highs and lows of the candles of the selected time-frame. Then see if this trend is in line with the trend of the daily chart to operate in favor of the major trend. When these two charts are moving in the same direction, we have the highest probability of winnings. We will call this region the region of high probability of gain.
In

DESCRIÇÃO O indicador EasyFollowerTrader-Bot2-DayTrade opera apenas a favor da tendência. Assim, o indicador, em primeiro momento, observar a tendência de três médias síncrona com o time-frame selecionado. Em seguida, o indicador observar a tendência do gráfico diário. Quando estes dois gráficos estiverem se movimentando na mesma direção, teremos a maior probabilidade de ganhos. Chamaremos esta região como região de alta probabilidade de ganho. Na região de alta probabilidade de ganho, o ind

It is an indicator used to identify support and resistance points from the daily VWAP and you can use it to check the best entry and exit points.
The calculated value of the channel distance can be calculated in several ways:
- Manual Defining the value to be projected to calculate the distance of the channels.
- Automatic Select the timeframe to be used. Regardless of the graphic time that is on the screen, if the parameter is changed to H1(One hour candles), the system will c

MA Slope is a simple indicator that measures the slope of a specific Moving Average. We usually say that the price is in an uptrend when it is above the moving average, or it is in a downtrend when it is below the moving average. However, this information is inadequate since most of the time the market is in range. During range-bound markets, price moves back and forth around the Moving Average giving a lot of false signals. MA Slope helps identify and validate trends as it directly measures t

The Average Daily Range (ADR) is an indicator that shows how far a currency pair can move in a day. Automatically displays the upper and lower ADR levels. Automatically calculates the percentage and distance of ADR achieved by the currency pair for the day. Notifies when the price reaches the ADR level. Changes the color and thickness of the ADR line when the price reaches it.

Everything is simple. The usual Information indicator.
Shows on the chart: Current spread, buy swap, sell swap, time to close the candle, broker time.
The indicator can be placed at the top right or at the bottom right of the chart.
Most often, the spread is called the difference between the sale and purchase price.
Swap is the cost of transferring a position to the next day.

The Average Daily Range (ADR) is an indicator that shows how far a currency pair can move in a day.
Automatically displays the upper and lower ADR levels.
Automatically calculates the percentage and distance of ADR achieved by the currency pair for the day.
Changes the color and thickness of the ADR line when the price reaches it.
The payment is made in 14 days. It is displayed on timeframes from M1 to M30.
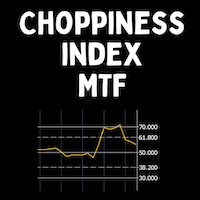
The Choppiness Index was created by Australian commodity trader E.W. Dreiss. It is designed to determine if the market is choppy (trading sideways) or not choppy (trading within a trend in either direction). A basic understanding of the indicator would be; higher values equal more choppiness, while lower values indicate directional trending. The values operate between 0 and 100. The closer the value is to 100, the higher the choppiness (sideways movement) levels. The closer the value is to 0,

The movement exhaustion is a color rule that helps indicate when the movement will revert its direction. The darker the color, the greater the probability to revert. The indicator is based on the price statistic. Works on every timeframe, every instrument. Five color options: 0. Natural movement. (Gray) 1 - 4. Movement exhaustion (Yellow to maroon) The trader can use it as reversal or exhaustion signal. In a trend following trade it can be used as an exhaustion signal, indicating the movement ca

Here’s the problem: the default zigzag indicator given in MT5 trading platform does not really capture the most of the highs and lows on chart do draw zigzags. On chart below, notice that some of ther high, low of price have been missed to draw zigzags by this default zigzag indicator (picture 1). It is not so apparent until you compare default zigzag indicator to this SwingZZ indicator. Have a look on picture 2 and 3. The swing zigzag indicator is best because it captures most of the swing high

Theoretical Foundation The Keltner Channels are channels ploted using volatility deviations above and bellow a moving average. The indicator is an excellent tool to help the trader build trend and mean-reversion strategies. Parameters The Orion Dynamic Keltner allows the user to select the Volatility Calculation Type, being ATR or Average Range (not considering price gaps). Also, the user can select the Calculation Period, Number of Deviations, Moving Average Mode and the Moving Average Ca

Theoretical Foundation Similar to the well-known Average True Range (ATR), the Average Range indicator is a volatility measure that is calculated using only the range of the bars (high – low), not considering the Gaps, as with the ATR. The Average Range can be very useful for day traders as it allows one to get the measure of the volatility of the last N bars. Parameters You can select the calculation period of the indicator.

Gösterge, Trend Çizgisi, Dikdörtgen, Metin nesneleriyle çalışır ve bunları bir grafikten diğerine oluşturup kopyalamanıza olanak tanır.
Otomatik kopyalayıcılara daha uygun bir alternatiftir, çünkü neyin ve nereye kopyalanacağını daha esnek bir şekilde seçmenize izin verir.
Kısayol tuşları:
'1,2,3,4,5,6' - ince yatay çizgiler oluşturma (renk ayarlarında ayarlanır), SHİFT ile aynı - kalın çizgi ' ~ ' - rastgele renkli bir çizgi oluşturma ))) '7,8,9' - boyalı dikdörtgenler oluşturma (renk ay
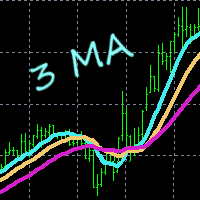
This indicator gives you a modified version of three Moving Averages. Great for scalping. Does not feature any alerts, and is best used manually after confirming multi line displays. Settings: Period1 Period2 Period3 Period4 How to use: Simply attach to any chart with default settings. Buy when the 4 lines converge below the price. Sell when the 4 lines converge above the price. Take note of the slope of Period4. See example pictures below. Best results when looking at three or more time frames
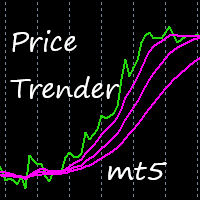
This indicator uses a special algorithm to plot the 4 lines for trading. Great for scalping. Features alerts. Settings for trend filters. How to use: Simply attach to any chart with default settings. Buy when the three pink lines converge below the green line. Sell when the three pink lines converge above the green line. Best results when looking at three or more time frames, and the three blue lines have just converged below or above the green line.
Use as you see fit for your strategy. Best r
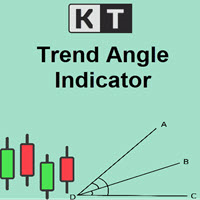
The KT Trend Angle helps to identify ranging and trending markets. The idea is to only enter a trade following the market trend if the slope is steep enough.
An angle is the ratio of the number of bars to the number of points: The bars mean the time offered by standard (M1, M5, etc.) and non-standard time frames. Points represent the unit of price measurement with an accuracy of 4 or 5 decimal places.
Input Parameters Period: An integer value to define the intensity of angled trendlines. A

KT Forex Blau Balance combines elements of momentum and volatility. It helps you identify entry and exit points.
Blau Balance consists of two moving averages (a slow-moving average and a fast-moving average) intersecting key transition points in market price. The indicator turns green or red when one is above or below the other, signaling to buy or sell trade signals.
It can be used in currency pairs and other markets that your MT4 or MT5 platform supports. Both short-term and long-term tra

The KT De Munyuk is a trend-based indicator that uses Parabolic SAR to identify the market direction. The indicator shows the PSAR in the form of green/red dots using a separate window. Buy Signal: When a green dot appears after a series of at least three red dots. Buy Exit: When a red dot appears on the current or next higher time frame. Sell Signal: When a red dot appears after a series of at least three green dots. Sell Exit: When a green dot appears on the current or next higher

In MetaTrader, plotting multiple horizontal lines and then tracking their respective price levels can be a hassle. This indicator automatically plots multiple horizontal lines at equal intervals for setting price alerts, plotting support and resistance levels, and other manual purposes. This indicator is suitable for Forex traders who are new and looking for chances to make quick profits from buying and selling. Horizontal lines can help traders find possible areas to start trading when the
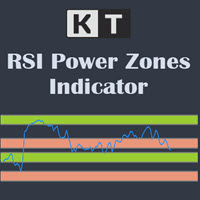
The KT RSI Power Zones divides and shows the movement of RSI into four different power zones to identify the potential support and resistance zones using the RSI.
Bull Support The bull support ranges from 40 to 50. The price is expected to reverse to the upside from this zone.
Bull Resistance The bull resistance ranges from 80 to 90. The price is expected to reverse to the downsize from this zone.
Bear Support The bear support ranges from 20 to 30. The price is expected to reverse to the

KT Price Border creates a three-band price envelope that identifies potential swing high and low areas in the market. These levels can also be used as dynamic market support and resistance. The mid-band can also be used to identify the trend direction. As a result, it also functions as a trend-following indicator. In addition, its ease of use and more straightforward conveyance of trade signals significantly benefit new traders.
Features
It works well on most of the Forex currency pairs. It

The BSI stands for Bar Strength Index. It evaluates price data using a unique calculation. It displays readings in a separate window. Many financial investors mistake this indicator for the Relative Strength Index (RSI), which is incorrect because the BSI can provide an advantage through its calculation method that the RSI indicator does not. The Bar Strength Index (BSI) is derived from the Internal Bar Strength (IBS), which has been successfully applied to many financial assets such as commodit

The KT Tether Line is a trend-following tool consisting of three indicators that work together to generate trading signals. It can correctly identify market trends while signaling trade entries. It was first introduced by Bryan Strain in the Stock & Commodities magazine in 2000 in "How to get with the trend and out at the end."
The Concept
When a market trend is confirmed, the most challenging part is determining the timing of the entries. This indicator alerts you to potential trend reversal
The Indicator assists in decision making along with the user's market reading. By drawing the trend, this indicator becomes very useful on days of high volatility in the market, that is, it offers strategic insights on days of economic data, news or pronouncements. On flat market days it becomes usual to identify possible market reversals. Follow Youtube to understand the most suitable scenarios for its use.

Ichimoku Aiko MTF is a collection of technical indicators that show support and resistance levels, as well as momentum and trend direction. It is a multi-timeframe indicator so you don't need to change the chart timeframe when you want to see the ichimoku clouds on a higher timeframe. eg. The chart timeframe is M15 and you want to see on the M15 timeframe chart the H1 ichimoku indicators (the ichimoku in Metatrader can't do that) that's why you need to use Ichimoku Aiko MTF.
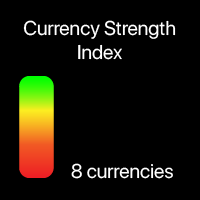
Current strength of the 8 major currencies My #1 Utility: includes 65+ functions, including this indicator | Contact me if you have any questions The indicator is displayed in a separate window, it can be moved to any place on the chart. In the input settings you can adjust: Interface theme : dark / white; Prefix and Suffix, if the currency pairs on your broker have it:
(e.g. if Symbol is "EURUSD .pro ", please set " .pro " as a Suffix); Panel size Font size
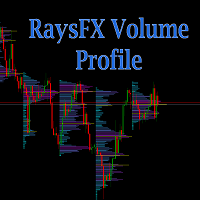
Calculation method The calculation method is summing the number of deals performed at a certain price. Alternatively, the volumes at a certain price can be summed if the real volume type is set in the parameters. The trade data is interpolated based on the most accurate terminal data available (М1 timeframe data). Each bar is divided into several trades based on the estimated price movement inside the bar. This is a distinguishing feature of the product setting it apart from other ones that hav

Supply / demand zones: observable areas where price has approached many times in the past. My #1 Utility: includes 65+ functions, including this indicator | Contact me if you have any questions The indicator shows where the price could potentially be reversed again. Usually, the more times the price has been rejected from the level, the more significant it is. In the input settings you can adjust: Enable or disbale Weak zones; Show or hide zone description; Font size; Set the bas
Absolute volatility for each day for the last 4 weeks My #1 Utility: includes 65+ functions, including this indicator | Contact me if you have any questions The indicator is displayed in a separate window, it can be moved to any place on the chart. In the input settings you can adjust: Interface theme : dark / white; Calculation method: price, pips, points, % change;
Panel size Font size
This indicator compares volumes from the same period to previous days instead of calculating the average of previous candles, so it is possible to detect volume anomalies more accurately.
I have always been bothered by seeing very large volumes at the beginning of a trading day and almost no volume throughout the day, making volume-based strategies very limited. This indicator can verify the strength of the volume of candles based on previous days, so it is possible to perceive volumes that ar

Scanner and Dashboard for Money Flow Index MT5 The Money Flow Index (MFI) is a technical oscillator that uses price and volume data for identifying overbought or oversold signals in an asset. It can also be used to spot divergences which warn of a trend change in price. The oscillator moves between 0 and 100.
Advantages of the Scanner: - Full Alert Options. - Multi Timefrare - Works for all instruments including Currencies, Indices, Commodities, Cryptocurrencies and Stocks. - Fully customisab

Time Line by MMD is a simple indicator that supports historical data analysis and trading on statistical models that follow the MMD methodology.
Start Time - specifying the time when we start analyzing and playing the MMD statistical model Time Duration in minutes - duration of the model and its highest effectiveness (after the end of the line, the price returns - statistically - to the set level) Lookback days - the number of days back, subjected to historical analysis Base Time Frame - the

This indicator draws the high intraday price and the low intraday price of the first n minutes of the day. The chart shows the days with vertical lines and two horizontal lines to indicate the max and the min close price of the n first minutes of the day. The max/min lines start and end with the day calculated. With this indicator you can see how starts the day compared with the previous days. It is valid for any market inasmuch as the start time is calculated with the data received.
Paramete
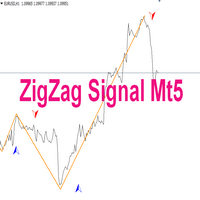
Indicator description: Indicator - ZigZag Signal is created on the basis of a well-known and popular indicator - ZigZag. The indicator can be used for manual or automatic trading by Expert Advisors. 1. The ZigZag Signal indicator has alerts of different notifications for manual trading. 2. If used in Expert Advisors, the indicator has signal buffers for buying and selling. You can also prescribe and call the indicator as an external resource and other settings and applications: (email me in a

Xtrade Trend Detector is an indicator capable of finding the best opportunities to take a position in any stock market. Indeed, it is a great tool for scalpers but also for Daytraders. You could therefore use it to identify areas to trade, it fits easily on a chart. I use it to detect trends on Big timeframes and take positions on Small timeframes. Don't hesitate to give me a feedback if you test it.

The Squeezer indicator simply draws ascending lines with Sell signal in the downtrend and descending lines with Buy signal in the uptrend to catch the pullbacks and sniper entries. This is a common successful trading strategy being used by many successful traders, and the good thing about this strategy is that it works with all time frames. The difference is in the take profit level between them. Buy / Sell signals are triggered at the close of the current candles above / below the ascending or
This indicator draws a price area in which the volume percentage was traded the day before. The chart shows the days with vertical lines and two horizontal lines to indicate the upper price and the lower price of the percentage of volume was traded the day before. The upper/lower lines start and end with the day calculated. But they are referred with the values of the day before. NOT the day in which are. With this indicator you can see where the volume moved in the day before. It uses percenti

Merhaba; Tw79 time zone pivot strateji indikatörü önemli kırılımları bulur ve kırılımlar sonrası aynı yönde kar marjını koruyarak toplam kar hedefinin devamlılığını sağlar. İndikatör girdi açıklamaları; Start Hours:Başlangıç ve referans noktasını ifade eder.Sıfır yada bir rakamını kullanın. Offset:Referans sonrası hesaplanacak bar sayısını ifade eder.Ortalama değerler 55-144 arasındadır. Number of bar:Sinyal için hesaplanacak son mumu ifade eder.Bir olarak kalmalıdır. Sound On:Sinyal açık-kapalı
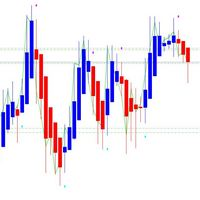
Heiken Ashi Signal göstergesi MT5 ticaret terminali için tasarlanmıştır. Mt5 terminalinde bulunan standart Heiken Ashi göstergesine dayanmaktadır. Gösterge, yazarın Uzman Danışmanları tarafından otomatik ticaretin yanı sıra manuel olarak da kullanılabilir. Ticaret EA'larında Heiken Ashi Sinyal göstergesini kullanmak için, piyasaya giriş ve alım satım pozisyonları açmak için sinyal tamponları vardır. Daha fazlasını aşağıda okuyabilirsiniz.
Heiken Ashi Sinyal göstergesinin özellikleri ve özelli
RSI Traffic Light Indicator tracks several RSI ( Relativ Streng Index) Periods and informs you, if the trend is changing. Trend is you friend, one of the classical Trend following is the Relativ Streng Index (RSI). With RSI Traffic Light Indicator you will get information about trendchange. The RSI Traffic Light Indicator alerts you if the trend is changing for your pair. Different trendchange criterials and visualisation themes inclusive. Your can adjust the indicator Trendchange criterials by
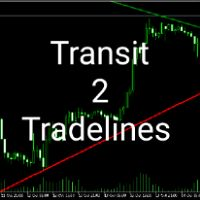
Transit2Trendline this indicator system is made to reduce the job of analyzing and to help those who can't or don't know how to draw trendlines.Transit 2 Trendlines draws only two important trendlines, support and resistance. The diagonal support is drawn in red color .The diagonal resistance is drawn in green color. Note this are very important trendlines which can easily be traded with the classic strategy of trendlines, breakout and retest. The Transit 2 Trendlines will draw patterns selected

Another renko-based indicator. It returns different usable values for an EA, and is directly displayed on the main chart. Its setting is very simple: The size of the renko The number of bars taken into account The falling color The color on the rise Returned values: Buffer 0 : Value of the middle Buffer 1 : Value of the Top Buffer 2 : Value of the Bottom Buffer 3 : Direction of renko (0.0 for top ; 1.0 for bottom) Buffer 4 : Ratio of the renko, for example, if it is twice, 3 times, ro more of
It is a very simple indicator to display daily loss percentage, open position loss percentage, monthly loss percentage and monthly profit percentage. MT4 version
We assure you that we welcome any suggestions to improve this indicator and make the necessary changes to improve this indicator.
You can contact us via Instagram, Telegram, WhatsApp, email or here. We are ready to answer you.

Developed by Smart Trader - Smart Reversion Pattern is an indicator capable of identifying reversal patterns , both bullish reversals and bearish reversals.
It is designed to provide fast, real-time awareness of patterns.
We also thought about the interface part, creating a clean and pleasant look to identify formation patterns on the chart.
Note: If any pattern you need is not listed, just contact us and request inclusion - we usually respond within a few hours.
Bearish Reversal P

S&R indicator automatically finds the closest support and resistance levels (or zones) for the loaded traffic.
• The indicator works on all timeframes (it is advisable to choose at least M15) • The indicator works on all markets • Doesn’t redraw • Flexible settings The work of the indicator is based on the fractal indicator built into the MT4 platform. The fractal is a local extremum described by Bill Williams. The support and resistance indicator automatically finds the levels or zones,

The Candle Timer indicator is an Custom Indicator that displays the remaining time before the current candle would close. The Candle Timer indicator works by retrieving the time from the broker’s server. It also retrieves the time when the next candle would begin. Then, it calculates the difference between the projected open time of the next candle and the current time on the broker’s server. The difference between the open time of the next candle and the current server time is then displayed o
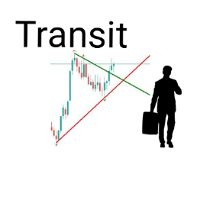
TransitX1 indicator is very useful, with unlimited signals and works on all the timeframes and all the piers. TransitX1 draws two trend lines very short trendlines (+/-20 bars) which can be considered as support and resistance. The support is in red trendline and the resistance is in green trendline. TransitX1 gives buying and selling signals, with only 3 being previous signals and the 4th one being the current signal. Buying signals are in green arrows and are always on the support trendline an
MetaTrader Mağaza, geliştiricilerin ticaret uygulamalarını satabilecekleri basit ve kullanışlı bir sitedir.
Ürününüzü yayınlamanıza yardımcı olacağız ve size Mağaza için ürününüzün açıklamasını nasıl hazırlayacağınızı anlatacağız. Mağazadaki tüm uygulamalar şifreleme korumalıdır ve yalnızca alıcının bilgisayarında çalıştırılabilir. İllegal kopyalama yapılamaz.
Ticaret fırsatlarını kaçırıyorsunuz:
- Ücretsiz ticaret uygulamaları
- İşlem kopyalama için 8.000'den fazla sinyal
- Finansal piyasaları keşfetmek için ekonomik haberler
Kayıt
Giriş yap
Gizlilik ve Veri Koruma Politikasını ve MQL5.com Kullanım Şartlarını kabul edersiniz
Hesabınız yoksa, lütfen kaydolun
MQL5.com web sitesine giriş yapmak için çerezlerin kullanımına izin vermelisiniz.
Lütfen tarayıcınızda gerekli ayarı etkinleştirin, aksi takdirde giriş yapamazsınız.