YouTube'dan Mağaza ile ilgili eğitici videoları izleyin
Bir ticaret robotu veya gösterge nasıl satın alınır?
Uzman Danışmanınızı
sanal sunucuda çalıştırın
sanal sunucuda çalıştırın
Satın almadan önce göstergeyi/ticaret robotunu test edin
Mağazada kazanç sağlamak ister misiniz?
Satış için bir ürün nasıl sunulur?
MetaTrader 5 için yeni teknik göstergeler - 5
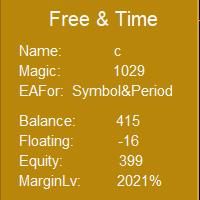
This indicator can use EAMagic to statistics EA since the operation of the revenue data and the current trading volume and trade data statistics, now the first version, should be slowly updated. When using, you must enter the number of EA's Magic when loading, in order to receive EA's transaction data. The part of the input currency pair and cycle can be filled in by the user to more clearly understand the currency pair and cycle that is currently being traded, and to facilitate the screenshot

This is MT5 version, MT4 on this link: Alert Line Pro MT4 Alert line pro allows to make alert when price cross these objects: Horizontal lines Trendline Price Zone (Rectangle) Alert when close current bar (have new bar) When the price crosses the alert lines, the software will sound an alarm and send a notification to the MetaTrader 5 mobile application. You need to settings your MetaQuotes ID of MT5 apps to MetaTrader5 software to get notification to the mobile phone. Sound files must be pl

TG MTF MA MT5 is designed to display a multi-timeframe moving average (MA) on any chart timeframe while allowing users to specify and view the MA values from a particular timeframe across all timeframes. This functionality enables users to focus on the moving average of a specific timeframe without switching charts. By isolating the moving average values of a specific timeframe across all timeframes, users can gain insights into the trend dynamics and potential trading opportunities without sw
FREE
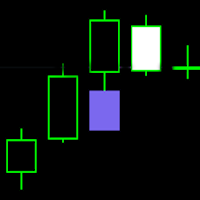
FVG - Fair Value Gap indicator is a three candle pattern indicator . It find inefficiencies or imbalances in market. It act as magnet before continue the trend.
indicator key function
1. No object is used to draw the plot. You can use this to build EA and backtest also.
2. Min and max value to Filter-out the noises .
It use as retest zone and can be use as entry price also. It popular among price action traders. your suggestion and comments are welcome and hopping that you will find th

Candle_Timer_and_Spread göstergesi, tek bir grafik üzerinde mumun sonuna kadar geçen süreyi ve seçilen semboller için spread ile birlikte fiyat değişim yüzdesini gösterir.
Geçerli zaman diliminde mumun sonuna kadar geçen süreyi ve günün açılış fiyatına göre yüzde olarak fiyat değişimini gösteren zamanlayıcı, varsayılan olarak grafiğin sağ üst köşesinde bulunur. Panel, seçilen semboller için geçerli fiyatın günün açılışına göre dağılımını ve yüzde değişimini gösterir. Panel varsayılan olarak s
FREE

MACD Histogram göstergesi, traderların piyasa trendlerini ve momentum değişikliklerini daha iyi anlamalarını sağlamak için tasarlanmış, MACD göstergesinin güncellenmiş bir versiyonudur. Orijinal MACD'den farklı olarak, bu versiyon iki çizgi arasındaki farkı gösteren bir çubuk grafik olan bir histogram içerir: MACD çizgisi ve sinyal çizgisi. Nasıl çalıştığına gelince: MACD çizgisi sinyal çizgisinin üzerinde olduğunda, yükseliş piyasasını önerir ve histogram çubukları yeşil renkte gösterilir. Öte

Bu, mum çubuğu fiyat hareketini temel alan mekanik olarak tasarlanmış bir göstergedir. Bir alım veya satım dürtüsü oluştuğunda uyarı üreten herhangi bir alım satım enstrümanı üzerinde çalışır, ancak sinyalleri doğrulamak için ayrıca giriş ve çıkış teknikleri sağlayan bir video ve açıklayıcı belgeler vardır. Youtube benjc ticaret danışmanında arama yapın ve bu ürünle ilgili açıklayıcı videoları bulun.
En son sürüm, sinyalleri filtrelemek ve onları daha doğru hale getirmek için trend ve osilatö

Haber Göstergesi. 12 Ülkenin faiz oranını gösterir (Avustralya, Brezilya, Kanada, Meksika, euro bölgesi, İngiltere, Hindistan, Yeni Zelanda, İsviçre, Amerika Birleşik Devletleri, Güney Kore, Japonya). Faiz oranının döviz kuru üzerindeki etkisini analiz etmeye yardımcı olacaktır. Büyük zaman dilimlerinde bir gösterge ayarlamak mantıklıdır. Bilgi içeriğini iyileştirmek için, istenen ülkenin göstergesinin ayar stilini değiştirmek mantıklıdır, böylece çizgi toplam gösterge kütlesinden sıyrılabilir,
FREE

Full implementation of Directional Movement System for trading, originally developed by Welles Wilder, with modifications to improve profitability, to reduce the number of unfavorable signals, and with Stop Loss lines.
No re-paint
Features
Buy/sell signals displayed on the chart Stop levels visually indicated on the chart Profit-taking points presented in the indicator window Exit points for unfavorable positions presented in the indicator window Signal confirmation through high/low swing c

The indicator is designed for displaying the following price levels on the chart: Previous day's high and low. Previous week's high and low. Previous month's high and low. Each of the level types is customizable. In the indicator settings, you set line style, line color, enable or disable separate levels.
Configurations ----Day------------------------------------------------- DayLevels - enable/disable previous day's levels. WidthDayLines - line width of daily levels. ColorDayLines - lin
FREE

Kindly rate and comment about the product for upgradation & Support
The 5 EMA is plotted in green color ( Lime ). The 14 EMA is plotted in red color ( Red ). The 20 EMA is plotted in blue color ( Blue ). The 200 EMA is plotted in black color ( Black ). The 200 EMA is plotted in yellow color ( Yellow ).
The Quarter EMA that provided calculates and plots four Exponential Moving Averages (EMAs) on the chart using different periods: 5, 14, 20, and 200. Each EMA
FREE

Embrace the Power With Ultimate Trend Trader Indicator. Facing the reality of individual traders, we are far from harnessing the capabilities of AI and high-frequency trading algorithms that dominate today's markets. Without access to massive data centers or infrastructure to compete on microseconds, the battle seems skewed. Yet, the true advantage lies not in technological arms but in leveraging human intellect to outsmart the competition. The Ultimate Trend Trader Indicator embodies this appr
Description of work
The 'MA7 Galega' indicator is based on the standard Moving Average (MA) indicator. Shows a puncture of the moving average. Detailed information about the 'MA7 Galega' indicator.
Indicator settings
General settings: Period – MA period; Method – MA method; Apply to – price type; Consider the direction of the candle .
Message settings: Send message to the terminal (Alert) – permission to send messages to the terminal using the Alert function; Send message to the mobile ter

Description of work
The 'MA7 Ixora' indicator is based on the standard Moving Average (MA) indicator. Shows the intersection of the fast and slow moving averages. Detailed information about the 'MA7 Ixora' indicator.
Indicator settings
General settings: Consider the direction of the candle .
Fast moving average settings: Period – MA period; Method – MA method; Apply to – price type.
Slow moving average settings: Period – MA period; Method – MA method; Apply to – price type; Add to FMA pe
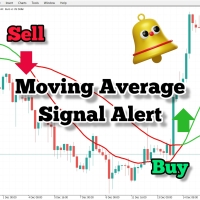
İşlem stratejinizde hareketli ortalamaları kullanıyorsanız, bu gösterge sizin için çok faydalı olabilir. İki hareketli ortalamanın kesişiminde sinyal sağlar, işitsel uyarılar gönderir, işlem platformunuzda bildirimler görüntüler ve olayla ilgili bir e-posta da gönderir. Kendi işlem tarzınıza ve stratejinize uyum sağlamak için kolayca özelleştirilebilir ayarlarla birlikte gelir. Ayarlanabilir parametreler: Hızlı MA (Fast MA) Yavaş MA (Slow MA) E-posta Gönder (Send_Email) İşitsel Uyarılar (Audibl
FREE

This is Wilder's ADX with cloud presentation of DI+ & DI- lines. Features
4 standard lines of the ADX indicator: DI+, DI-, ADX, ADXR cloud presentation of DI+/DI- lines with transparent colors applicable to all time-frames and all markets
What Is ADX
J. Welles Wilder Jr., the developer of well-known indicators such as RSI, ATR, and Parabolic SAR, believed that the Directional Movement System, which is partially implemented in ADX indicator, was his most satisfying achievement. In his 1978 boo
FREE

The MACD 2 Line Indicator is a powerful, upgraded version of the classic Moving Average Convergence Divergence (MACD) indicator.
This tool is the embodiment of versatility and functionality, capable of delivering comprehensive market insights to both beginner and advanced traders. The MACD 2 Line Indicator for MQL4 offers a dynamic perspective of market momentum and direction, through clear, visually compelling charts and real-time analysis.
Metatrader4 Version | How-to Install Product | How
FREE

Exclusive Limited Time Offer! Grab this useful indicator for a lifetime at just $49. Enhance your trading experience with this amazing Metatrader indicator that tracks your live trade status. The indicator displays live take profit, stop loss & trailed stop loss, or trailed profit value with the best dashboard with account balance alert. Indicator Features:
Trade Details The indicator shows the last 5 active trades data in chronological order. Don't miss this opportunity to get your copy tod

This is an extension indicator that allows the user to select any second time-frame from 1 to 60 second without any multiplier limitaion (ex, 7 seconds, 13 seconds ... are all allowed).
There is only one input called Interval that allows you to set the seconds timeframe you want given is in the range above. You can use indicators on that new time frame with no problems and also build your EAs based on any second timeframe. I hope this is useful, please let me know any bugs you find!
Note: Sin
FREE

Description of work
The 'MA7 Viola' indicator is based on the standard Moving Average (MA) indicator. Shows a sharp increase or decrease in the moving average. Detailed information about the 'MA7 Viola' indicator.
Indicator settings
General settings: Difference – difference between the last two MA values, percentage; Period ; Method ; Apply to ; Remove subsequent arrows – removes subsequent arrows in one direction.
Message settings: Send message to the terminal (Alert) – permission to send

We have turned one application of the RSI indicator into a separate indicator, represented by red and green bars, which is incredibly simple and effective.
By simply inputting the parameters for the RSI, you can obtain the RSI indicator represented by red and green bars. The application of the RSI indicator has been expanded into a powerful new indicator, visually presented through red and green bars, undoubtedly an innovative move in the field of financial technical analysis. The design of t

RSI Barometer Pro provides traders and investors with intuitive insights into market sentiment and potential trend reversals by representing RSI values using red and green bars. The meticulous design of red and green bars in RSI Barometer Pro visually showcases market dynamics. When the bars appear green, it indicates that the RSI is below 50, suggesting a relatively stable market phase. Conversely, when the bars turn red, it signifies that the RSI is above 50, indicating potential market volat

Product Name: RSI Momentum Gauge
Product Description: The RSI Momentum Gauge is an advanced indicator that transforms the traditional concept of overbought and oversold signals from the RSI (Relative Strength Index) into a visually intuitive representation using red and green bars. Designed to empower traders and investors with actionable insights, this innovative indicator provides a clear assessment of market conditions and potential trend reversals. The RSI Momentum Gauge's distinctive fea

This is diamond!
Diamond Pattern is based on Read The Market(RTM) concepts. The purpose of this model is to face the big players of the market (financial institutions and banks), As you know in financial markets, big traders try to fool small traders, but RTM prevent traders from getting trapped. This style is formed in terms of price candles and presented according to market supply and demand areas and no price oscillator is used in it. RTM concepts are very suitable for all kinds of inves

Pips on Candles shows the number of pips involved in each candle on the chart. It is possible to set 3 different ranges for counting on each single candle via the RangeType parameter: With "HighLow" you count the pips present between the minimum and the maximum. The number is shown under each candlestick on the chart. With "OpenClose" you count the pips present between the opening and closing price of the candle. The number is shown under each candlestick on the chart. With "HighDistAndLowDist"

The forex spread is the difference between a forex broker's sell rate and buy rate when exchanging or trading currencies . Spreads can be narrower or wider, depending on the currency involved, the time of day a trade is initiated, and economic conditions.
Forex Spread WatchDog :
This Forex indicator ensures that you are getting the best spreads while trading, and guards against broker spread widening.
FREE

Colored EMA/SMA Indicator: A Dynamic Tool for Trend Analysis The Colored EMA/SMA (Exponential Moving Average/Simple Moving Average) Indicator is a cutting-edge financial tool designed to empower traders and analysts with deeper insights and a clearer understanding of market trends. By blending the precision of the EMA with the simplicity of the SMA, this indicator offers a comprehensive view of market momentum and potential price movements. Features: Color-Coded Visuals : Utilizes a vibrant colo

Smart Delta Volume, piyasanın volatilitesine göre otomatik olarak ayarlanan dinamik seviyeleri kullanır. Bu özellik, piyasa koşullarındaki değişikliklere daha hassas ve gerçek zamanlı olarak uyum sağlayan bir analiz sağlar. Dinamik olarak ayarlanabilme yeteneği ile gösterge, hacim akışı ve fiyat hareketi konusunda daha kapsamlı ve güvenilir bir görüş sunar. Ayrıca, Smart Delta Volume, fiyatın iki dinamik seviyeyi aştığında tetiklenen bir geri çekilme doğrulayıcısı sunar. Bu koşul, geri çekilmen

Classic MACD
It has MACD line, Signal line, and Histogram . The Histogram has 4 colors , showing its movement direction as simple as possible. The smoothing factor in the input helps to eliminate noisy signals. Besides different price types (hlc, hlcc, ohlc, ...), there is an option to use volume data as the source for MACD calculations (which is better to be used by real volume not unreliable tick volume). While the original MACD indicator uses Exponential Moving Average, this indicator provid
FREE

Bu ürün, broker sunucunuzun saat dilimine göre 15 ülkenin işlem seanslarını ve grafik sıkışıklığını önlemek için istediğiniz ayarlara göre çeşitli görüntüleme modlarını görüntülemek ve kullanıcının istediği zamana göre seans ayarlama imkanı sunmak üzere tasarlanmıştır.
Forex piyasasında güneş asla batmaz, ancak ritmi farklı işlem seanslarının ritmine göre dans eder. Bu oturumları, örtüşmelerini ve benzersiz atmosferlerini anlamak, piyasaya karşı değil, piyasaya karşı hareket etmek isteyen her

Algo Map Lite ile tanışın - ticaret deneyiminizde devrim yaratmak için tasarlanmış son teknoloji bir yazılım. Bu gelişmiş araç, işlem seanslarınızla kusursuz bir şekilde bütünleşerek her durumda kapsamlı bir kırılma seviyesi analizi sağlar.
Sezgisel arayüzü ve gerçek zamanlı seviye yazdırma işlevselliğine ek olarak Algo Map Lite, performans iddialarını güçlendirmek için titiz kazanma oranı ölçümlerini bir araya getirmesiyle öne çıkıyor. Şeffaflık ve güvenilirliğe olan bağlılığımız, son 10

Accurate Gold göstergesi, deneyim seviyesinden bağımsız olarak kullanıcı dostu bir araçtır ve kullanımı oldukça sezgiseldir. Altın piyasasındaki M5 zaman diliminde kesin sinyaller arayan tüccarlar için tasarlanmıştır. Bu gösterge, fiyat hareketlerini ve hacim dinamiklerini analiz etmek için gelişmiş matematiksel algoritmaları kullanarak kesin alım ve satım sinyalleri üretir. Bu göstergenin, repainting özelliği de dahil olmak üzere karakteristik özellikleri, tüccarlara potansiyel piyasa dönüşle

Her gün belirli bir mum üzerinde çalışan bir PIVOT'u kaç kez aradınız?
Birçok tüccar, piyasa açıldıktan 30 dakika sonra veya öğlen 12 gibi her gün belirli bir saate göre günün trendinin yönünü tahmin etmeyi sever.
Bu gösterge belirli bir zaman (saat ve dakika) belirlemenize olanak tanır ve o zamandan bir sonraki güne aynı anda bir pivot çizer. Söz konusu mum/saate göre beş çizgi gösterir: medyan, maksimum, minimum, destek ve direnç.
Seçilen zaman PERIOD sınırlarının dışındaysa (M5 zaman d
FREE

Keltner-Enhanced, Keltner Kanallarının doğruluğunu ve okunabilirliğini, bunları ayarlamak için birçok seçenek ve META varsayılanının ötesinde daha fazla beş fiyat hesaplaması ile geliştirir.
Keltner-E göstergesi, Bollinger Bantları ve Hareketli Ortalama Zarflarına benzer bantlı bir göstergedir. Bir orta çizginin üzerinde bir üst zarf ve orta çizginin altında bir alt zarftan oluşurlar.
Keltner Kanallarını kullanırken dikkat edilmesi gereken ana olaylar, Üst Zarfın üstünde veya Alt Zarfın al
FREE

OBV MACD
Calculating MACD based on OBV data Features
3 outputs: MACD & Signal & Histogram 4 Colored Histogram Smoothing factor show/hide option for MACD & Signal lines Description
Among the few indicators developed for working with volume data, OBV (On Balance Volume) is the simplest yet most informative one. Its logic is straightforward: when the closing price is above the previous close, today's volume is added to the previous OBV; conversely, when the closing price is below the previous cl
FREE

This is one of the most popular and highly rated volatility index (VIX) indicators on the market. It provides the same readings as the VIX does for stock indexes. However, this indicator works across all asset classes. VIX Fix Finds Market Bottoms. This indicator is not for inexperienced traders. Use it for day and swing trading. MT4 Version - https://www.mql5.com/en/market/product/112238 Bernard Baruch summed it out best: "Markets fluctuate." The Chicago Board Options Exchange (CBOE) Vo
FREE

O Touch VWAP é um indicador que permite calcular uma Média Ponderada por Volume (VWAP) apenas apertando a tecla 'w' no seu teclado e após clicando no candle do qual deseja realizar o calculo, clicando abaixo do candle é calculada a VWAP baseado na minima dos preços com o volume, clicando sobre o corpo do candle é calculado uma VWAP sobre o preço medio com o volume e clicando acima do candle é calculado uma VWAP baseado na máxima dos preços com o volume, voce tambem tem a opção de remover a VWA
FREE

One of the best trend indicators available to the public. Trend is your friend. Works on any pair, index, commodities, and cryptocurrency Correct trend lines Multiple confirmation lines Bollinger Bands trend confirmation Trend reversal prediction Trailing stop loss lines Scalping mini trends Signals Alerts and Notifications Highly flexible Easy settings Let me know in the reviews section what you think about it and if there are any features missing.
Tips: Your confirmation line will predict tr
FREE

This indicator show Gann Swing Chart (One Bar) with multi layer wave. 1. Wave layer F1: Gann waves are drawn based on candles. SGann wave(Swing of Gann) is drawn based on Gann wave of wave layer F1. 2. Wave layer F2: Is a Gann wave drawn based on the SGann wave of wave layer F1. SGann waves are drawn based on Gann waves of wave layer F2. 3. Wave layer F3: Is a Gann wave drawn based on the SGann wave of wave layer F2. SGann waves are drawn based on Gann waves of wave layer F3. ---------Vi
FREE
Description of work
The 'MA7 Agave' indicator is based on the standard Average Directional Movement Index (ADX) indicator. Shows the intersection of the +DI and -DI lines. Detailed information about the 'MA7 Agave' indicator.
Indicator settings
General settings: ADX period - Average Directional Movement Index indicator period.
'MA7 Flax' settings: ATR period – Average True Range indicator period, (0 – not used); ATR multiplier – Average True Range indicator value multiplier, coeff; Remove

Our goal is to empower every trader with their own unique trading system.
Indicator - Red-Green Series
Ultimate simplicity: Red for uptrend, green for downtrend! It can be used independently or in combination with other indicators. This is a red-green indicator based on the crossover of two moving averages. We have more indicators in store and will be adding them gradually. Friends who make a purchase are kindly requested to contact us after their purchase.
In the world of financial tradi
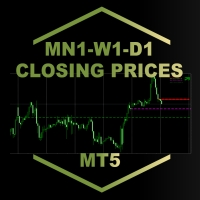
MN1-W1-D1 Close Price Indicator to Index Trading for MT5
The indicator draws lines to the close prices of the last closed bars of monthly, weekly and daily timeframes. Observably, these prices are significant support and resistance prices at major indices, like Nasdaq, DAX. The info panel always shows the prices relative to each other in the correct order. If the current price is the highest - i.e. higher than the last monthly, weekly and daily closing price - it is in the first row. The lowest

Description of work
The 'MA7 Flax' indicator is based on the standard Average True Range (ATR) indicator and candle data. Shows candles that are larger in size relative to the ATR indicator value. Detailed information about the 'MA7 Flax' indicator.
Indicator settings
General settings: ATR period – Average True Range indicator period; ATR multiplier – Average True Range indicator value multiplier; Remove subsequent arrows – removes subsequent arrows in one direction.
Message settings: Send

This indicator helps you identify support and resistance levels. Also it adds break points when level is broken. Price sometimes goes back to break point. It has 4 technical parameters and 4 buffers for expert advisors. Buffer indexes: 0 - Resistance, 1 - Support, 2 - Resistance break point, 3 - Support break point". Number of Levels: Determines how many levels are on graph ( if 3 - 3 levels of support and 3 levels of resistance) Tolerance in percentage %: This parameter is used to filter out
Introducing the Engulfing Goddess Metatrader 5 (MT5) Indicator , a revolutionary tool designed for traders who seek to harness the power of candlestick patterns in their trading strategy. This indicator is built on the principles of engulfing candlestick patterns , a popular method used by successful traders worldwide. Our Engulfing Goddess Indicator stands out with its ability to detect various kinds of engulfing patterns . It employs a range of filters, providing you with a comprehensive anal

Market Cycle and Trading Sessions Indicator
Introducing our Market Cycle and Trading Sessions Indicator, a tool designed to provide you with a comprehensive view of the financial market like never before. Observe the market's pulse with our exclusive indicator. Gain a deep understanding of market phases, from accumulation to distribution, to make informed, strategic decisions with a high probability.
What makes our indicator?
1. Date Range for Calculations: Customize the start and end da

Introducing The Day Trader System: Your Shortcut to Day Trading Success! Are you a day trader seeking simplicity without compromising profitability? Look no further! We present The Day Trader System – your go-to solution for identifying lucrative opportunities in the fast-paced world of Forex. Simple Yet Powerful: The Day Trader System is a straightforward yet highly effective indicator designed exclusively for day traders. Say goodbye to complexity and hello to a system that simplifies
FREE

Что показывает на графике индикатор TrendBreak? 1 — рисует линию тренда до максимальных максимумов в 100 баров. 2 — рисует линию тренда до максимальных максимумов в 30 баров. 3 — рисует линию тренда до максимальных минимумов в 100 баров. 4 — рисует линию тренда до максимальных минимумов в 30 баров. И эти линии указывают на сжатие тренда. Также индикатор выбирает 100-й бар и рисует ровную линию к максимуму и минимуму.
FREE

The underlying strategy of this indicator is based on identifying momentum in the market and attempting to capture the direction of the trend through transitions between bullish and bearish moments. Utilizing bands around the RWMA allows for identifying potential overbought and oversold situations in the market.
1. Calculation of the Range Momentum Index (RMI): The RMI is based on a combination of the Relative Strength Index (RSI) and the Money Flow Index (MFI), both of which are momentum ind

O Chart Control é um indicador que permite de forma rapida e pratica alterar o timeframe e ativo do grafico, possibilitando que voce possa fazer todas as suas analises em apenas um grafico sem precisar abrir vários, além disso voce pode escolher o entre os temas claro e escuro para o qual melhor se adapta a sua preferencia.
MT4: https://www.mql5.com/pt/market/product/112155
FREE
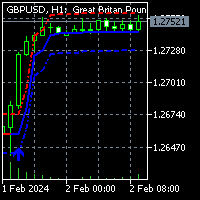
To get access to MT4 version please click here . This is the exact conversion from TradingView: "HalfTrend" by "Everget". This is a light-load processing indicator. This is a non-repaint indicator. Buffers are available for processing in EAs. All input fields are available. You can message in private chat for further changes you need. Thanks for downloading

The TradeQL Indicator is a customizable tool that highlights specific trading patterns on candlestick charts. Users can define patterns through TradeQL queries, which the indicator then applies to the chart, visually representing matches and captured groups. Ideal for identifying complex trade setups in real-time.
TradeQL queries are specified using the TradeQL Language. See https://github.com/abdielou/tradeql for more details. This language is expressed as a regular expression. The language a
FREE

This indicator finds Double Top and Double bottom Example : What is Double Top When price establishes a new high and then falls, then reverse to the same candle area of High then its considered a valid double top and vice versa for double bottom. 1. It plots and high and low on visible chart if ChartChange is set to true else it searches on new bar opening
2. If there is double top and double bottom found in visible chart window then it plots a line 3. It has options to customize text color, te
FREE
Altın Desen, Fibonacci dizisindeki altın orana dayalı 3 mumlu bir konfigürasyondur.
Altın oran 1,618'dir. Varyasyonları 0,618, 2,618 ve 3,618'dir. Bu göstergede sonuçlar 2,618 ile en iyi sonuçtur.
Altın formasyonu normal bir mum ve ardından ilk mumun en az 2,618 katı büyüklüğünde kapanış fiyatına sahip daha büyük bir mumdan oluşur.
Altın Boğa Deseni yükseliş mumlarından, Altın Ayı Deseni ise düşüş mumlarından oluşur.
Sinyale ek olarak, son 2 mumun üzerine yayılan, mavi bir çizgi

Functional in the Forex market. Functional on the B3 market - Bolsa Brasil Balcão. Motivation The Price Guide indicator is a tool that helps you insert support and resistance points at the chosen price and in the quantity you want, it depends on the agility of its configuration. This FULL version will work in Meta Trader 5 on all accounts and Strategy Tester . To test on the DEMO account , download the free version at: https://www.mql5.com/pt/market/product/111620 Operation The method

Functional in the Forex market. Functional on the B3 market - Bolsa Brasil Balcão. Motivation The Price Guide indicator is a tool that helps you insert support and resistance points at the chosen price and in the quantity you want, it depends on the agility of its configuration. This DEMO version will work on the Meta Trader 5 Demo account and Strategy Tester. Get the Full version that works with a Real account click: https://www.mql5.com/pt/market/product/111897 Operation The methodology publi
FREE

Introducing the Accelerator Divergence Indicator, a powerful tool designed to enhance your Forex trading experience. This innovative indicator is specifically crafted to identify market divergence, providing traders with valuable insights for more informed decision-making. The Accelerator Divergence Indicator utilizes advanced algorithms to detect divergence in the market, visually guiding traders with precision-drawn lines that highlight key points of interest. Divergence occurs when the price
FREE

What is this indicator? This indicator is the ADX (Average Directional Movement Index) supporting Virtual Trading mode of Knots Compositor . When the mode is turned on, the indicator will be recalculated based on the displayed candlesticks. When the mode is turned off, the indicator will be recalculated based on the original chart candlesticks.
KC-Indicators - KC-MA (Moving Average) - KC-ENV (Envelopes) - KC-BB (Bollinger Bands) - KC-ADX (Average Directional Movement Index)
FREE

What is this indicator? This indicator is the MACD (Moving Average Convergence/Divergence) supporting Virtual Trading mode of Knots Compositor . When the mode is turned on, the indicator will be recalculated based on the displayed candlesticks. When the mode is turned off, the indicator will be recalculated based on the original chart candlesticks.
Types of the applied price - Close - Open - High - Low - Median Price (HL/2) - Typical Price (HLC/3) - Weighted Price (HLCC/4)
KC-Indicators
FREE

What is this indicator? This indicator is the Stochastic Oscillator supporting Virtual Trading mode of Knots Compositor . When the mode is turned on, the indicator will be recalculated based on the displayed candlesticks. When the mode is turned off, the indicator will be recalculated based on the original chart candlesticks.
KC-Indicators - KC-MA (Moving Average) - KC-ENV (Envelopes) - KC-BB (Bollinger Bands) - KC-ADX (Average Directional Movement Index) - KC-MACD (Mo
FREE

Stat Monitor is a good information indicator.
Benefits of the indicator: The indicator provides useful information - the current spread, the cost of one lot of the symbol, trading leverage and the recommended lot size for trading. You can use the indicator on the MetaTrader 5 trading platform of any broker. The indicator provides useful information.
Version of the Stat Monitor indicator for MetaTrader 4 I wish you all good luck in trading and stable profit!
FREE

What is this indicator? This indicator is the RSI (Relative Strength Index) supporting Virtual Trading mode of Knots Compositor . When the mode is turned on, the indicator will be recalculated based on the displayed candlesticks. When the mode is turned off, the indicator will be recalculated based on the original chart candlesticks.
Types of the applied price - Close - Open - High - Low - Median Price (HL/2) - Typical Price (HLC/3) - Weighted Price (HLCC/4)
KC-Indicators - KC-MA (M
FREE

What is this indicator?
This indicator is the Bollinger Bands supporting Virtual Trading mode of Knots Compositor . When the mode is turned on, the indicator will be recalculated based on the displayed candlesticks. When the mode is turned off, the indicator will be recalculated based on the original chart candlesticks.
Types of the applied price - Close - Open - High - Low - Median Price (HL/2) - Typical Price (HLC/3) - Weighted Price (HLCC/4)
KC-Indicators - KC-MA (Moving Averag
FREE

What is this indicator?
This indicator is the Moving Average supporting Virtual Trading mode of Knots Compositor . When the mode is turned on, the indicator will be recalculated based on the displayed candlesticks. When the mode is turned off, the indicator will be recalculated based on the original chart candlesticks.
Types of the moving average - Simple (SMA) - Exponential (EMA) - Smoothed (SMMA) - Linear weighted (LWMA)
Types of the applied price - Close - Open - High - Low - Media
FREE

What is this indicator?
This indicator is the Envelopes supporting Virtual Trading mode of Knots Compositor . When the mode is turned on, the indicator will be recalculated based on the displayed candlesticks. When the mode is turned off, the indicator will be recalculated based on the original chart candlesticks.
Types of the moving average - Simple (SMA) - Exponential (EMA) - Smoothed (SMMA) - Linear weighted (LWMA)
Types of the applied price - Close - Open - High - Low - Median Pri
FREE

O indicador é uma ferramenta desenvolvida para o MetaTrader, projetada para auxiliar na análise detalhada do comportamento do preço em relação a uma média móvel específica. Ao ser anexado ao timeframe diário, o ele realiza cálculos e monitora, em timeframes menores, quantas vezes o preço toca determinados níveis de afastamento durante o dias além de calcular a média dos toques.
MT4: https://www.mql5.com/pt/market/product/111706
FREE

Vision è un indicatore professionale che legge i dati storici del periodo impostato e in base a tali elabora una previsione scrivendo l'andamento sul grafico, l'impatto visivo eccellente rende chiaro l'andamento del prossimo trend e mette a fuoco il prezzo d'ingresso il posizionamento di ordini e la distanza per SL e TP, di default è impostato con un rapporto bilanciato 24 a 24 ciò significa che in base alle ultime 24 candele prevederà scrivendo sul grafico l'andamento delle 24 candele successi

Calculate the Variance of prices on the chosen time frame and compare with the price range reached. Or in other words how mutch is price moving in the recent candles? Two impots: Candle = 4 (Default) number of previous candle to calculate Backward = 500 (Default) How many candle to go backward
Variance is calculated as follow: Variance(X) = Average(X 2 ) – [Average(X)] 2
Subsequently Variance is rapported to the price range fo the chosen period (i.e. 4 candles) Indicator = Variance(X) / (
FREE
The Liquidation Estimates (Real-Time) experimental indicator attempts to highlight real-time long and short liquidations on all timeframes. Here with liquidations, we refer to the process of forcibly closing a trader's position in the market.
By analyzing liquidation data, traders can gauge market sentiment, identify potential support and resistance levels, identify potential trend reversals, and make informed decisions about entry and exit points.
USAGE (Img 1) Liquidation refer

An indicator to show the current U.S. Dollar Index ( USDX , DXY , DX ). It is a weighted geometric mean of the dollar's value relative to the following select currencies: Euro (EUR), 57.6% weight. Japanese yen (JPY) 13.6% weight. Pound sterling (GBP), 11.9% weight. Canadian dollar (CAD), 9.1% weight. Swedish krona (SEK), 4.2% weight. Swiss franc (CHF) 3.6% weight.
You can request me to customize a similar indicator with weighted and currency pairs you desire. Just call me on MQL5, thank
MetaTrader Mağaza, ticaret robotları ve teknik göstergeler satmak için en iyi yerdir.
MetaTrader platformu için ilgi çekici bir tasarıma ve iyi bir açıklamaya sahip bir uygulama geliştirmeniz yeterlidir. Milyonlarca MetaTrader kullanıcısına sunmak için size ürününüzü Mağazada nasıl yayınlayacağınızı açıklayacağız.
Ticaret fırsatlarını kaçırıyorsunuz:
- Ücretsiz ticaret uygulamaları
- İşlem kopyalama için 8.000'den fazla sinyal
- Finansal piyasaları keşfetmek için ekonomik haberler
Kayıt
Giriş yap
Gizlilik ve Veri Koruma Politikasını ve MQL5.com Kullanım Şartlarını kabul edersiniz
Hesabınız yoksa, lütfen kaydolun
MQL5.com web sitesine giriş yapmak için çerezlerin kullanımına izin vermelisiniz.
Lütfen tarayıcınızda gerekli ayarı etkinleştirin, aksi takdirde giriş yapamazsınız.