YouTube'dan Mağaza ile ilgili eğitici videoları izleyin
Bir ticaret robotu veya gösterge nasıl satın alınır?
Uzman Danışmanınızı
sanal sunucuda çalıştırın
sanal sunucuda çalıştırın
Satın almadan önce göstergeyi/ticaret robotunu test edin
Mağazada kazanç sağlamak ister misiniz?
Satış için bir ürün nasıl sunulur?
MetaTrader 5 için yeni teknik göstergeler - 25

Free version of the TickScalper indicator. The Tick Scalp indicator is a trading assistant for a scalping trader. Works in a separate window. Tracks the momentary activity of the market, shows the graph of the movement of ticks and the strength of bulls or bears. Sometimes it can anticipate the beginning of a strong movement before any other indicators. Helps the trader to make a decision to open the desired order. Designed to work on any instrument. Used timeframes from M1 to M15. Has simple a
FREE

Here is the boom and crash crazy Ma scalper a secretly coded color MA that is 1000% NON-REPAINT Works best on boom and crash 1000 Can be used on all timeframes from the 1 Minute timeframe to the Monthly timeframe The indicator is also a multi-time frame indicator you can select which timeframe to use The indicator is made for scalping purposes. as the trend changes the color of the indicator changes all well

!! FLASH SALE !! Over 80% off !! For ONE week only. Now only $47 - normally $297! >>> Ends on 30 June 2023 - Don't miss it!
Buy and Sell Arrows On The Chart According To Price Action Sends Alerts On MT5 To Your Phone To You Email
Does NOT repaint. Works on any pair, any timeframe.
10 Activations allowed so you are free from limitations. MT4 Version here . For spreads from a tiny 0.1 pips RAW/ECN Accounts, click here . Check out my Waka Esque EA signal here: >> High Ri

Mum sayacı Bu gösterge mumları sayar ve sayılarını daha uzun bir süreye göre gösterir daha büyük zaman çerçevesi Günlük zaman aralığını " Bigger Timeframe " olarak seçebilir ve en küçük zaman aralığına sahip olan grafikte çalıştırabilirsiniz. sayacın çubukları günlük çizelgeye göre sayacağını. Parametre olarak " H1 " zaman dilimini geçerseniz, gösterge H1 grafiğindeki çubukları nasıl sayacağını bilecektir, yalnızca daha küçük zaman dilimlerine sahip grafiklerde çalıştırması gerekir. Ana parametr
FREE

Bu gösterge ogive şekillerine dayanmaktadır. Bu tür şekiller aerodinamik ve uzay teknolojisinde kullanılır. Mermilerin bile bir çeşit ogival şekli vardır. Bu tür formların teknik bir göstergede kullanılması, göstergenin hassasiyeti ile istikrarı arasında bir uzlaşmaya varılmasını mümkün kılar. Bu, uygulamasında ek olanaklar sağlar. Gösterge parametreleri: iType - ogive formunun türü. iPeriod - gösterge dönemi. iFactor , parabolik ve üstel formlarda kullanılan ek bir parametredir. Geçerli de

Description. The basis for the formation of the Renko chart is the price range. If the price goes beyond its limits, the chart shows a box above or below the previous one. As a result, we see price movement without additional "noise" and important support and resistance levels. Features.
For use in conjunction with the Expert Advisor, an additional buffer is implemented-a box counter. For convenience and to increase the speed of testing, the user can use the "new box" event, which the indicato
FREE
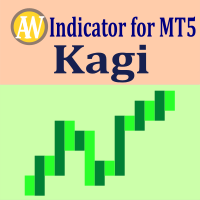
Description. The basis for the formation of the Kagi chart is the price range, always the reverse of the movement. If the price goes beyond its limits, a box is displayed on the chart. Boxes are formed of different sizes and are always alternating, that is, after the "up" box, a "down" box will be built. Time is not involved in the construction. Features. For use in conjunction with the Expert Advisor, an additional buffer is implemented-a box counter. For convenience and to increase the speed
FREE

HEIKEN PLUS is the only indicator you really need to be a successful trader , without in depth knowledge of the forex trading or any tools.
Also there is automatically trading EA available now: https://www.mql5.com/en/market/product/89517? with superb SL/TP management! and sky high profit targets !!!
Very suitable tool for new traders or advanced traders too. This is MT5 version. For MT4 version visit : https://www.mql5.com/en/market/product/85235?source=Site
HEIKEN+ is a combination o
The indicator plots the Up and Down arrows on every price swing made by the classic Zigzag indicator. When Zigzag makes a new swing low, a green arrow is plotted. Likewise, a red arrow is plotted when Zigzag makes a new swing high.
Features
Compared to the classic ZigZag, it marks the swing points more effectively. It helps to identify the forming chart patterns in advance. It comes with a Multi-Timeframe scanner which shows the Zigzag direction on each timeframe. All Metatrader alerts includ

This indicator shows the bullish/bearish market regime using the no. of bars moved above and below the overbought/oversold region of RSI. The green histogram depicts the Bull power, while the red depicts the Bear power.
Features
It can be used to enter new trades or validates trades from other strategies or indicators. It comes with a multi-timeframe scanner that scans the bulls/bears power across all the time frames. It's a perfect choice to boost the confidence of new traders via validatin
The indicator measures the buying and selling force between the buyers and sellers in the form of a histogram/oscillator by using a BOP equation:
BOP = Moving Average of [close – open)/(high – low)]
Igor Levshin first introduced the Balance of power in the August 2001 issue of Technical Analysis of Stocks & Commodities magazine.
Features
Quickly find the buying and selling pressure among the traders. It comes with simple inputs and an interface. All Metatrader alerts included.
Appli
SSL stands for Semaphore Signal Level channel. It consists of two moving averages applied to high and low, respectively, to form a price following envelope. Buy Signal: When the price closes above the higher moving average. Sell Signal: When the price closes below the lower moving average.
Features It comes with a multi-timeframe scanner that scans for the new signals across all the timeframes. A straightforward personal implementation of the classic SSL effortlessly finds the trend directio

Back to the Future это индикатор который определяет направление тренда. Определяет четыре уровня для роста и падения 1-й уровень флета 2 -й уровень коррекции 3-й уровень продолжения тренда и 4-й уровень возможного разворота. Индикатор рисует трендовые линии краткострочного и долгострочного тренда. Так же индикатор определяет динамические сел и бай зоны в виде прямоугольников. От ближайшего максимума или минимума рисует фибо уровни для определения целей движения. В меню индикатора отключа

It's a modified, and improved version of the classic HMA developed initially by Alan Hull in 2005. It uses a combination of three weighted moving averages to reduce the lag. Long Entry: When HMA turns blue from red with an upward slope. Short Entry: When HMA turns red from blue with a downward slope.
Features It comes with a multi-timeframe scanner which scans for the new signals across all the timeframes. HMA reduces lags which usually come with the traditional moving averages. Effectively

Numa folha qualquer
Eu desenho um sol amarelo
E com cinco ou seis retas
É fácil fazer um castelo
Corro o lápis em torno da mão e me dou uma luva
E se faço chover com dois riscos, tenho um guarda-chuva
Se um pinguinho de tinta
Cai num pedacinho azul do papel
Num instante imagino uma linda gaivota a voar no céu
Vai voando, contornando
A imensa curva norte-sul
Vou com ela viajando
Havai, Pequim ou Istambul
Pinto um barco à vela
Branco navegando
É tanto céu e mar num beijo azul
Entr
FREE

MASpeed, hareket hızı göstergesi ile evrensel hareketli ortalamadır. Ortalama, eşikten daha hızlı hareket ettiğinde çizgideki noktalar görünür. Eşik değerini ayarlarda belirtebilirsiniz. Bu göstergeye dayanarak, çok çeşitli ticaret stratejileri oluşturabilirsiniz. Göstergede hareketli ortalamanın ayarlanması için büyük fırsatlar var - 10 çeşit yumuşatma. İnşa edilecek 12 fiyat seçeneği. Ortaya çıkan hareketlerin ayrıştırılması için bir seçenek eklendi. Ek avantajlar şunlardır: hızlı ve optimize
FREE

Mesafe Fiyat Hareketli Ortalama
Bu, fiyattan hareketli ortalamaya olan mesafeyi gerçek zamanlı olarak hesaplayan bir göstergedir.
Bununla sizin tarafınızdan seçilen belirli bir zaman diliminde fiyatın hareketli ortalamadan maksimum sapmasını izleyebilir, örneğin mesafeyi son 30 günün maksimum sapmasına göre izleyebilirsiniz.
Hareketli ortalamanın periyodunu ve türünü seçmek mümkündür.
Daha da iyi hale getirmek için, fiyatın tüm zamanların en yüksek seviyesine ulaşması durumunda iki uy
FREE

The worktime indicator helps you identify the most important times to day to trade the currency pairs. It was created based on the ICT day trading free tutorials that are freely vailable on his youtube channel. You can use this indicator together with my other indicators that i have shared freely with you like the true day, custom periods, daily month, weekly open lines - they together complement each other very well.
Nuggets from this indicator: 1. Draws the asian session box showinng you th
FREE
The Higher timeframe candle tracker is used to get a glimpse of what the selected higher time frame candle is like. It plot the candle after the current price. It can come in handy for day traders and short term traders that often worry about how the current higher timeframe candle may look like. You can select the higher time frame or lower time frame from the options provided: By default the color for bears is red and for bulls is green. You are able to change the width of the candle, its wick
FREE

Excellent tracking performance and minimal noise! This trend detection indicator that avoids whipsaws and uncertain market noise and is also agile enough to react to changes in trend.
It is also designed to adapt to dynamic markets.
Functions mainly as a filter to help you trade in the direction of the trend.
Features.
Simple and easy to use. Low load and easy to try out The excellent tracking performance and smooth lines that make it ideal for market analysis Can be used as a trend filter
FREE

AIS MT5 INDICATOR 5 ALL INCLLUSIVE SET
GUIDE
CHAPTER 1 IMPORTANT INFORMATION <1> THIS INDICATOR IS ONE OF THE SERIES OF NEW AIS INDICATORS AIS MT5 INDICATOR 1 =ADVANCED CLASSIC= AIS MT5 INDICATOR 2 =MULTIFRAMES= AIS MT5 INDICATOR 3 =LINES= AIS MT5 INDICATOR 4 =MARKET PROFILES= AIS MT5 INDICATOR 5 =ALL INCLUSIVE SET
CHAPTER 2 GENERAL FEATURES OF THE SERIES
<1> AIS MT5 INDICATOR 1 =ADVANCED CLASSIC= < DEVELOPMENT PAUSED > DISPLAYS MAIN TIME POINTS AND PRICE LEVELS OF THE CHART

Volality 75 Fractal Scalper Non-repaint The arrows appear on the current candle. momentum and trend based strategy Works on all timeframes from the 1 Minute to the Monthly timeframe Bollinger bands have been added to show the trend direction whether its bullish or bearish Blue fractal arrow is your buy entry Orange fractal arrow is your sell entry you can use the Vix 75 fractal scalper in combination with other indicators.

Trend Paneli, kullanıcı tarafından seçilen on çifti kullanarak M1 - D1 zaman çerçevelerinin onaylanmış bir trend yönünü gösterecek basit ve kullanışlı bir araçtır.
Gösterge, herhangi bir stratejiye/şablona yön teyidi eklemek için tasarlanmıştır ve ardından grafiği farklı bir çift veya zaman dilimine hızlı bir şekilde değiştirmek için temiz bir etkileşimli arayüz olarak çalışır. Grup sohbeti : https://www.mql5.com/en/users/conorstephenson
Kurulum tavsiyesi ve ücretsiz bir Uzman Danışman için
FREE

Very powerful indicator! converted from TradingView with upgraded alerts and added notifications. Ideal use in EAs.
Use as a supplementary Indicator to confirm your entries, but it is as good on it's own.
The indicator consists of 3 different Trend Meters and a 2 Trend Bars which are used to confirm trend
How to Use:
The more Trend meters are lit up the better =>>
-more GREEN COLOR at one bar means more confirmation to open buy trade,
- more RED COLOR signals for one bar = more

Bu gösterge, ağırlık katsayıları olarak sözde "kötü" sayıları kullanır. Karşıtları, bu göstergede de sunulan "iğrenç" sayılardır. Sayıların bu iki sınıfa bölünmesi, belirli bir sayının ikili gösterimindeki birim sayısı ile belirlenen Hamming ağırlığı ile ilişkilidir. Bu sayıları ağırlıklandırma faktörleri olarak kullanmak, trend izleyen bir göstergeyle sonuçlanır. Ayrıca, iğrenç sayılar daha hassas bir gösterge verir ve kötü sayılar muhafazakar bir gösterge verir. Aralarındaki fark çok büyük de

The indicator plots a trend channel using the technique by Gilbert Raff. The channel axis is a first-order regression. The upper and lower lines show the maximum distance the Close line had moved away from the axis line. Therefore, the upper and lower lines can be considered as resistance and support lines, respectively. A similar version of the indicator for the MT4 terminal
As a rule, most movements of the price occur within a channel, going beyond the support or resistance line only for a s
FREE

This indicator is very useful for day traders or short term traders. (MT5 version) No need to calculate the number of pips manually, just look at the chart and you will see the Virtual Take Profit / Virtual Stop Loss target line and evaluate whether the entry point is feasible to reach the intended target or not.
Enter the intended Take Profit / Stop Loss pips for your trade. The indicator will display Virtual Take Profit / Virtual Stop Loss lines for you to easily see if the target i
FREE

Think of the Super Fractal Indicator as the Bill WIlliams Indicator on Steroids. Indicator Abilities: 1. Adjust Candle around Fractal High or Low. 2. Adjust Lookback period and only plot for a specific number of history candles avoiding cluttering your trading desk. 3. The Indicator uses buffers so you call and use it from any EA.
Note : The higher the candles around Fractal, the stronger the Turning point anfd viceversa is true.
FREE

The idea of a Value Chart indicator was presented in the very good book I read back in 2020 , " Dynamic Trading Indicators: Winning with Value Charts and Price Action Profile ", from the authors Mark Helweg and David Stendahl. The idea is simple and the result is pure genius: Present candlestick Price analysis in a detrended way!
HOW TO READ THIS INDICATOR
Look for Overbought and Oversold levels. Of course, you will need to test the settings a lot to find the "correct" one for your approach.
FREE

The ADX indicator (average directional index) is a technical tool designed to measure the strength of a market trend. The ADX indicator is used for various purposes such as measuring the strength of a trend, finding a trend and a trading range, and as a filter for various Forex trading strategies.
Some of the best trading strategies are based on following the market trend. There are also strategies through which traders make profit by trading against the trend. In any case, if you can identif

The purpose of the inidcator is to identify the reversal point.
The blue arrow is buy signal and the yellow star is its stop loss. The red arrow is sell signal and the yellow star is its stop loss. Please note that the singal is against trend,it could be continual fail. Alert feature: if there is a signal, the indicator will send alerts of popup window,email or mobile push. Inputs: Popup Window Alert: it is false in default Email Alert : it is false in default Mobile Push Alert: it is false in

Indicator alerts for Dual Relative strength index rsi. Large rsi preset at 14 is below 30 small rsi preset at 4 is below 10 for buy bullish signals .
Large rsi preset are 14 is above 70 small rsi preset at 4 is above 90 for sell bearish signals . Includes mobile and terminal alerts. draws lines when alerts.
This indicator can help identify extremes and then the tops or bottoms of those extremes .
FREE

Funciona como bandas de bollinger normais. Criado por Joe Ross, é um setup de maior risco por ser contra-tendência. Pode ser usado para Day Trade, Swing Trade e Position. Para identificar, é necessário inserir no gráfico as Bandas de Bollinger, com uma Média Móvel Simples de 20 períodos e largura (desvio) 2. Verifica-se um fechamento de determinado candle abaixo da banda inferior de Bollinger. Se o próximo candle fechar dentro das Bandas, marca-se a máxima dele. O rompimento dessa máxima será o
FREE

The Spots Indicator can be used for Entering and Exiting your trades based on the common candlestick patterns such as: engulfing, hanging man, doji etc. It is designed to publish desktop and mobile notification every time a signal is triggered. However, it is worth noting that this indicator is recommended to be used with other indicator for confirming the entries. It is best to use it with the Investment Castle Trend Lines indicator and the Supply and Demand indicator .
This indicator takes input from Support and Resistance levels, combined with a special trend filter. Easily spot tops and bottoms, and trade with more confidence. Great for scalping. This indicator can be used on all time frames and pairs. Features alert function.
No need to set up the indicator.
How to use: Simply attach to any chart. Zoom chart out completely. Red histogram line color = Selling opportunities. Blue histogram line color = Buying opportunities. See pictures below. To spot high
Tool converted from tradingview indicator. Modified version with pivot points calculated in a more intuitive way.
This tool displays relative volatility and directional trend. Excellent way to pickup diversions and reversals. Length can be lowered to 11 or 13 in settings to show price range.
Can be used to identify patterns such as parallel channels and likely direction of price action.
This indicator gives you a modified ZigZag, combined with a trend filter. Great for scalping. Perfect for channel trading. Features alert functions. No need to set up the indicator. How to use: Simply attach to any chart. Buy when the golden line stops below the price. Sell when the golden line stops above the price. It also helps to keep the audible alert set to true. Best results when checking two or more timeframes before entering trades on the lower time frames. Use as you see fit for your

Merkezi Pivot Menzil seviyeleri, merkezi bir pivot noktasının etrafında oluşturulur.
Merkezi pivotla ilgili bu seviyeler, sayısız piyasa davranışını ve olası sonuçları belirlemek için kullanılabilir.
Merkezi pivottan uzaklık ve önceki gün seviyelerine göre yeni seviyelerin oluşturduğu fiyat, takip eden günlerin trend yönünü ve gücünü belirlemek için kullanılabilir.
Merkezi Pivot Aralıkları, destek ve direnç görevi görebilir, stop loss koyacağınız bir kılavuz sunar ve ayrıca fiyatın devam
FREE

Kurumsal Düzeyler / Banka Düzeyleri ... Psikolojik Düzeyler / Çeyrek Teorisi.
Bu gösterge otomatik olarak "000, 200, 500 ve 800" seviyelerinde çizecektir, benim "Kurumsal Seviyeler" olarak bildiğim şey VEYA, çizelgeye "000, 250, 500 ve 750" seviyelerini de çizebilir.
Kurumsal Seviye ticareti / Çeyrek teorisini nerede öğrendiğinize bağlı olarak, bunları farklı isimler olarak bilebilirsiniz, esasen ana fikir, bu seviyelerin çoğu forex piyasasında güçlü destek ve direnç noktaları olarak harek
FREE

ROC Fiyat Histogramı Uyarısı, mevcut fiyat ile belirli sayıda dönem önceki fiyat arasındaki yüzde değişimini ölçen momentum tabanlı bir teknik göstergedir. ROC, fiyat değişiklikleri yukarı yönde ise gösterge yukarı doğru pozitif bölgeye, fiyat değişiklikleri aşağı yönde ise negatif bölgeye hareket ederek sıfıra karşı bir histogramla çizilir.
ROC periyodunun hesaplanmasındaki ana adım, 'hesaplanan periyot' giriş ayarıdır. Kısa vadeli tüccarlar, dokuz veya on iki gibi küçük bir değer seçebilir.

TickCounter göstergesi, her yeni çubukta yukarı ve aşağı keneleri sayar.
Hesaplama, gösterge tabloya yerleştirildiği andan itibaren başlar.
Histogram çubukları şunları temsil eder: Sarı çubuklar - toplam kene sayısı; Mavi çubuklar - YUKARI işaretler; Kırmızı çubuklar - AŞAĞI işaretler. Mavi çubuk görünmüyorsa, daha fazla aşağı onay işareti vardır ve kırmızı çubuk mavi olanın üzerinde görüntülenir (kırmızı katman mavi olanın üzerindedir). MT4 version: https://www.mql5.com/en/market/product/

MT5 için WA_PV_BOX_EFFORT X SONUÇ WAPV Box Effort x Result Indicator, Paket Göstergeleri grubunun (Wyckoff Academy Wave Market) bir parçasıdır. MT5 için WAPV Box Effort x Result Indicator , fiyat ve hacmi okumanıza yardımcı olur. Okuması, çaba x sonucunun tanımlanmasına yardımcı olmaktan ibarettir. grafik tarafından oluşturulan dalgalarda. Kutu yeşil olduğunda MT5 için WAPV Kutusu Eforu x Sonuç Göstergesi, hacmin talebin lehine olduğu ve kutunun kırmızı olduğu anlamına gelir hacim arzdan yana. K

MT5 için WAPV Fiyat ve Hacim Göstergesi, (Wyckoff Academy Wave Market) ve (Wyckoff Academy Fiyat ve Hacim) araç setinin bir parçasıdır. MT5 için WAPV Fiyat ve Hacim Göstergesi, grafikteki hacim hareketini sezgisel bir şekilde görselleştirmeyi kolaylaştırmak için oluşturuldu. Bununla, piyasanın profesyonel bir ilgisinin olmadığı en yüksek hacim anlarını ve anları gözlemleyebilirsiniz. Piyasanın "akıllı para" hareketiyle değil, ataletle hareket ettiği anları belirleyin. Kullanıcı tarafından değişt

WAPV ADH Arz ve Talep göstergesi, (Wyckoff Academy Wave Market) adı verilen bir dizi göstergenin parçasıdır. WAPV ADH Arz ve Talep Göstergesi MT5 için alıcılar ve satıcılar arasında kazanan tarafı belirlemeyi amaçlamaktadır. Okuması çok basittir, yeşil çizgi kırmızı çizginin üzerinde olduğunda talep komuta altındadır, kırmızı çizgi yeşil çizginin üzerinde olduğunda arz komuta altındadır. Yeşil ve kırmızı çizgiler ne kadar pozitifse, hacim girişi o kadar yüksek, sıfıra veya negatife o kadar yakın

WAPV ADH Arz ve Talep Forex Göstergesi, (Wyckoff Academy Wave Market) adlı bir dizi Göstergenin parçasıdır. WAPV ADH Forex Arz ve Talep Göstergesi MT5 için alıcılar ve satıcılar arasında kazanan tarafı belirlemeyi amaçlamaktadır. Okuması çok basittir, yeşil çizgi kırmızı çizginin üzerinde olduğunda talep komuta altındadır, kırmızı çizgi yeşil çizginin üzerinde olduğunda arz komuta altındadır. Yeşil ve kırmızı çizgiler ne kadar pozitifse, hacim girişi o kadar yüksek, sıfıra veya negatife o kadar

MT5 için Weis Wave Bouble Yan Göstergesi, araç setinin bir parçasıdır (Wyckoff Academy Wave Market) MT5 için Weis Wave Bouble yan Göstergesi, David Weis tarafından oluşturulan halihazırda kurulmuş Weis Wave'e dayalı olarak oluşturulmuştur. Weis Wave Çift Taraflı göstergesi, piyasayı olduğu gibi dalgalar halinde okur 1900 yılında R. Wyckoff tarafından. Çaba x sonuç, neden ve sonuç ve arz ve talebi belirlemeye yardımcı olur. Diferansiyeli, sıfır ekseninin altında kullanılabilmesi ve daha da iyileş

MT5 için VSA Candle Signal, araç setinin (Wyckoff Academy Fiyat ve Hacim) bir parçasıdır. İşlevi, mum oluşumunda Fiyat ve Hacim ilişkisini belirlemektir. Oluşturulması, Fiyat ve Hacim analizinde bir öncü olan R.Wyckoff'un öncüllerine dayanmaktadır. MT5 için VSA Candle Signal, karar vermede yardımcı olur ve okumanızı bırakır daha net ve akıcı. Aşağıdaki resimlere bakın.

MT5 Real Volume için Kuvvet ve Zayıflık Göstergesi, (Wyckoff Academy Fiyat ve Hacim) araç setinin bir parçasıdır MT5 Real Volume için Kuvvet ve Zayıflık Göstergesi, hacmin Gücünü ve Zayıflığını toplu bir şekilde belirlemek için geliştirilmiştir. Fiyat ve hacim arasında bir panorama vizyonunun etkinleştirilmesi. Gösterge, bir osilatör ve bir histogram olarak kullanılabilir. Bir fantezi olarak, fiyatla bir araya getirildiğinde R. Wyckoff'un üç yasasının tüm önermelerine sahiptir: Sebep ve Etki, Ça

The Force and Weakness Indicator for MT5 Forex is part of the (Wyckoff Academy Price and Volume) Toolkit The Force and Weakness Indicator for MT5 Forex was developed to identify the Strength and Weakness of volume in an accumulated way. Enabling the vision of a panorama between price and volume. The Indicator can be used as an oscillator and as a histogram. As usual it has all the premises of R. Wyckoff's three laws when put together with the price: Cause and Effect, Effort x Result and Supply a

Resistance and Support is an easy to use indicator to apply horizontal lines of resistance and support. There are two windows for adding levels. When you press the button, a line appears on the price chart. It is possible to move this line with the mouse, thereby changing the indicator readings. In the indicator menu there is a choice of possible alerts - no alert, alert on touching the level and an alert for closing the candle after the level.
FREE

Everyone knows how to analyze the market , which level to buy / sell this is an easy job , which leads to unusual horrible loses , very little few people knows WHEN then enter the market , time is Money , this is the key!!!
This version is a Proof of concept limited version of ZamanCYcles founded here: https://www.mql5.com/en/market/product/81883?source=Site +Market+Product+Page This works Only on 3 Minutes Time frame for 45 Candles Get rest of planets and more than 10 other algorithms to pre
FREE

Andrew Pitch fork is one of the most interesting string trend & Channel & Fibo technical analysis , it's like ALL in ONE tool would be very enough for you.
FYI, This indicator will expire by end of July 2022.
Using 2 Andrew pitch Forks with 2 different time frames on same chart is really very hard working and might be impossible , but with this indicator is possible now , moreover , using this method as Candle Volume based analysis give strong trust for your trade.
I assume if you are hav
FREE

John Bollinger created this indicator in 2010 as a way to read the original indicator (Bollinger Bands) in a more "technical" way, shown as an oscillator. The typical range of the Bollinger Bands %B is 0 - 0.5 - 1.0, where "0" represents the lower band, the "0.5" the middle band, and "1" the upper band. The line on the indicator represents the Closing prices. As simple as that.
SETTINGS
Bollinger Bands period of analysis Standard Deviation multiplier Shift Price type to be analyzed
If you
FREE

A ideia do indicador é mudar de cores assim que o candle viole a banda; Caso o candle viole a banda superior, pinta o candle de vermelho, Caso o candle viole a banda inferior , pinta o candle de verde, Se o candle passar em algum momento pela média, ele assume uma cor acinzentada; Os candles que não passem pela média, nem violem a banda, apresentarão cor verde fraca, se for de alta e cor vermelha fraca se for de baixa. Projeto concebido no canal Aprenda a programar, keltner cores.
FREE

I always wondered if I can have multiple time frame Moving average on same chart , it is not possible , now with my Indicator is possible , As you know Moving average is lagging not leading indicator , but how can I predict future levels of it ?
I came with this idea , I hope you will like it , I made a Mirror of Moving average , the other side of specific time will be shown in the other side of the chart where the price didnt reach yet , that will help you to know the levels you can start sel
FREE
This indicator combines input from two trend filters and the ADX. You can change the trend line on chart to your preference. Great for scalping and channels. Features alert function and parameter TrendLinePeriod.
How to use: Simply attach to any chart. Sell on red bullets, with trend line above price. Enter on bullets closest to this line. Buy on blue bullets, with trend line below price. Enter on bullets closest to this line. Best results when checking the higher time frames before entering t

Ichimoku Trend Finder is a multi symbol multi timeframe trend dashboard that helps traders to monitor and identify potential market trends from one chart. This panel scans the Ichimoku Kinko Hyo indicator in 28 configurable instruments and 9 timeframes for classic Ichimoku trend signals with a deep scan feature to scan all market watch symbols (up to 1000 instruments!).
Download Demo here (Scans only M1 and M6) Settings description here MT4 version here
After the purchase, don't fo
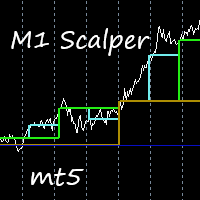
This indicator is excellent for scalping on the M1 or M5 chart. Uses a special algorithm for the lines. No need to set up the indicator. Does not feature any alerts and is best used manually after visually confirming the line displays. NB: Make sure to download M1 history before testing and use.
How to use: Simply attach to M1 or M5 chart. Zoom chart out completely. Sell when all lines above the white line (PriceLine). Sniper line crosses above white line. Buy when all lines below the white li

This indicator gives you arrows, two SR lines and a golden trend line. Uses a special trend algorithm to plot the arrows, combined with support and resistance inputs. Perfect for channel trading. Features alert functions.
Parameter TrendArrowPeriod. Parameter TrendLinePeriod. (Change to your preference) How to use: Simply attach to any chart with default settings. Zoom in the chart, to see the two blue SR lines and arrows more clearly. When the blue SR line is below the price, golden trend line

WolfeWaveBuilder göstergesi ile ticarete katılın! Bu, en başarılı ve karlı yatırım kararlarını almak için özel olarak oluşturulmuş benzersiz bir araçtır. Canlı hesaplar için idealdir ve tamamen test edilmiş ve neredeyse garantili bir ticaret stratejisinden yararlanır. fırsatı kaçırmayın! WolfeWaveBuilder göstergesi ile ticaret yaparak para kazanmaya başlayın!
MT5 sürümü https://www.mql5.com/ru/market/product/8920
Gösterge Özellikleri
Wolfe Waves stratejisi için sinyaller verir.

Watermark Centralized
Adds a watermark centered with the asset name and chosen period.
It is possible to override the font type, font size, font color and separator character.
The watermark is positioned behind the candles, not disturbing the visualization.
It has automatic re-centering if the window is resized.
Hope this indicator helps you, good trading ;)
FREE

Demand and supply zones Support and Resistance areas Show broken zones Show tested and untested zones Show weak zones Fractal factors Notifications when price reaches point of Interest with Push notifications and pop ups Customizable History Clickable Works on all Timeframes Works on all pairs.
Free for a while till further notice and changes. The demand and supply bot coming soon
FREE

Moving Average Trend Scanner is a multi symbol multi timeframe triple MA crossover dashboard that helps traders to monitor, and identify potential market trends from one chart. This panel scans 3 moving averages in up to 28 configurable instruments and 9 timeframes for triple moving average alignment and moving average crossover with a deep scan feature to scan all market watch symbols (up to 1000 instruments!).
Download Demo here (Scans only M1 and M6) Settings description here MT4 v

The Market Entropy indicator was created to measure the order of price changes over time. consists of two lines and a histogram where the lines are responsible for measuring the price movement and the histogram measures the strength of the analyzed movement. It can be used to find a trend (Image 2) or price reversal (Image 3).
Blue Line: Buy Entropy Red Line: Sell Entropy Historgram: Market Entropy
Interpretation: Buy Line above the Sell Line indicates that in the analyzed period buyers wer

Advanced Bollinger Bands Scanner is a multi symbol multi timeframe Bollinger bands dashboard that monitors and analyzes the Bollinger Bands indicator from one chart. This panel scans the Bollinger bands indicator in up to 28 configurable instruments and 9 timeframes for price overbought/oversold, price consolidation (Bollinger bands squeeze), and consolidation breakout (squeeze break) with a deep scan feature to scan all market watch symbols (up to 1000 instruments!).
Download Demo here

Всем привет. Представляю Вашему вниманию Индикатор TRUE ATR. Так же есть данный индикатор для mt4 https://www.mql5.com/ru/market/product/82414 Данный индикатор работает на всех рынках. TRUE ATR высчитывает среднестатистическое движение инструмента за 1 день и показывает сколько в инструменте осталось энергии внутри дня. В отличие от классического индикатора АТР которые без разбора учитывает все бары(свечи), TRUE ATR при расчете среднестатистического движения инструмента использует ближайших 5

Market Conditions indicators can provide support to the trader so that he can identify market trends over a given period. The purpose of this model is to allow traders to have a global vision on the exchange markets. And the formula that we develop allow to scan the major currencies in the exchange market. The model uses a purely statistical formula which is based on the historical data of the major currencies "eur, usd, gbp, jpy, aud, nzd, cad, chd". Of which 28 currency pairs are traded. It

Using the Stochastic Oscillator with a Moving Average is a simple but very efficient strategy to predict a trend reversal or continuation.
The indicator automatically merges both indicators into one. It also gives you visual and sound alerts.
It is ready to be used with our programmable EA, Sandbox, which you can find below: Our programmable EA: https://www.mql5.com/en/market/product/76714 Enjoy the indicator!
This is a free indicator, but it took hours to develop. If you want to pay me a c
FREE

Taking into account the difference in trading sessions, the indicator shows the trend direction and the resistance level. All events are marked on the chart and alerts are sent. Using SessionAlert, you can trade calmly, steadily. You just need to specify the start and end time of the sessions. The indicator displays the resistance level, the arrow indicates the trend change event and additionally marks the price touching the resistance level. The principle of operation of the indicator is very s

This simple indicator creates a ZigZag based on market frequency. It can be very useful for those who trade TapeReading. Switch between the various timeframes and note that the ZigZag will be maintained, this is due to the method used to create a timeless indicator. Set the main input parameter: nTicks: Number of ticks for frequency inversion The other parameters are for visual aspects only, try them.
FREE
MetaTrader Mağaza, ticaret robotları ve teknik göstergeler satmak için en iyi yerdir.
MetaTrader platformu için ilgi çekici bir tasarıma ve iyi bir açıklamaya sahip bir uygulama geliştirmeniz yeterlidir. Milyonlarca MetaTrader kullanıcısına sunmak için size ürününüzü Mağazada nasıl yayınlayacağınızı açıklayacağız.
Ticaret fırsatlarını kaçırıyorsunuz:
- Ücretsiz ticaret uygulamaları
- İşlem kopyalama için 8.000'den fazla sinyal
- Finansal piyasaları keşfetmek için ekonomik haberler
Kayıt
Giriş yap
Gizlilik ve Veri Koruma Politikasını ve MQL5.com Kullanım Şartlarını kabul edersiniz
Hesabınız yoksa, lütfen kaydolun
MQL5.com web sitesine giriş yapmak için çerezlerin kullanımına izin vermelisiniz.
Lütfen tarayıcınızda gerekli ayarı etkinleştirin, aksi takdirde giriş yapamazsınız.