YouTube'dan Mağaza ile ilgili eğitici videoları izleyin
Bir ticaret robotu veya gösterge nasıl satın alınır?
Uzman Danışmanınızı
sanal sunucuda çalıştırın
sanal sunucuda çalıştırın
Satın almadan önce göstergeyi/ticaret robotunu test edin
Mağazada kazanç sağlamak ister misiniz?
Satış için bir ürün nasıl sunulur?
MetaTrader 5 için yeni teknik göstergeler - 12

Trend Yakalayıcı:
Alarm İndikatörü ile Trend Yakalayıcı Stratejisi, piyasa trendlerini ve potansiyel giriş ve çıkış noktalarını belirlemede yardımcı olan çok yönlü bir teknik analiz aracıdır. Piyasa koşullarına uyum sağlayarak trend yönünün net görsel temsili için dinamik bir Trend Yakalayıcı Stratejisi sunar. Tüccarlar tercihlerine ve risk toleranslarına göre parametreleri özelleştirebilirler. Gösterge, trendleri tanımlamaya yardımcı olur, potansiyel ters dönüşleri sinyaller, trailing stop m
FREE

Bu araçla piyasa yapısını hızla analiz edin ve önemli fiyat seviyelerinden yararlanın.
Pazar yapısı Bu özel gösterge önemli fiyat seviyelerini çizer, bunlar giriş noktaları veya kar hedefleri olarak kullanılabilir.
İşlem aralığınızı belirleyin Piyasa dönüş noktalarına saygı göstererek bu gösterge ile kafa derisi.
Breakout ticaret fırsatları Koparma fırsatlarını tespit etmek için bu göstergeyi kullanın. Bu ticaret stratejisi, ödül oranı için mükemmel risk sağlar.
Özel uyarılar Te

Introduction
The Bounce Zone indicator is a cutting-edge non-repainting technical tool built to identify key areas on the price chart where market sentiment is likely to cause a significant price reversal. Using advanced algorithms and historical price data analysis, this indicator pinpoints potential bounce zones. Combined with other entry signal, this indicator can help forex traders place the best trades possible
Signal
A possible buy signal is generated when price is in the green zo
FREE
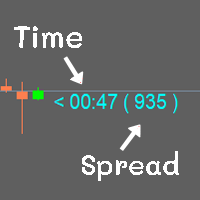
Show the time of candlesticks and spread. All data will be displayed in a rod. Can change color Can fix the size as needed
MT4 : Link https://www.mql5.com/en/market/product/102742 MT5 : Link https://www.mql5.com/en/market/product/102834
Most free code on various websites I didn't write it myself. I only do a little bit.
If you like it, please give 5 stars with it. Thank you.
FREE

Introducing the Order Block Indicator , the pinnacle of trading technology. Order blocks, the large cluster of buy or sell orders placed by institutional traders, significantly influence market direction. They form at critical price levels and can act as robust support and resistance zones. Our cutting-edge indicator allows you to harness the full potential of these influential market dynamics, providing a never-before-seen level of precision and customization. Here's why this tool stands apart:

Introduction
The PF Maximizer is a game-changing non-repainting technical tool engineered to help traders distinguish genuine trend signals from erratic market fluctuations. By employing sophisticated algorithms and cutting-edge data analysis, this indicator efficiently filters out unwanted noise, empowering traders to identify the precise starting and ending points of substantial market moves.
Signal
Potential buy signal is generated when moving average is going up and the blue line c
FREE

We value your feedback and believe that your experience with the Hull Moving Average (HMA) is essential to us and other traders. Help us continue to improve and refine our product by sharing your thoughts and insights through a review!
The Hull Moving Average (HMA) Indicator – Your Key to Smoother Trends and Profitable Trades! Are you tired of lagging and choppy moving averages that hinder your ability to spot profitable trading opportunities? Look no further! The Hull Moving Average (HMA) is
FREE
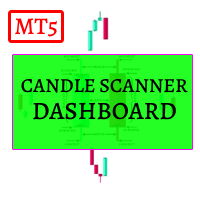
Candle Scanner Dashboard is an incredibly powerful tool in the financial markets. It excels at detecting market reversals, trend changes, and retracements. The dashboard displays patterns as they are identified, and with a simple click on each pattern, you can view them on their dedicated charts to precisely locate their occurrences. With its capability to detect 11 popular bullish and 11 bearish patterns, you can trust the dashboard to handle pattern identification effortlessly. It provides an
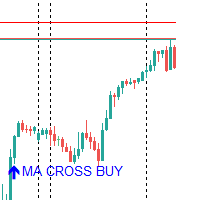
This indicator does not repaint, it is a trend indicator created to trade all financial instruments; go watch the video of the presentation on youtube https://youtu.be/OyhGcmgpzdQ you can do swin, day trading and scalping depending on the settings you will receive after your purchase, join my telegram channel @ASTBOSSA MY USERNAME FOR TELEGRAM GOOD LUCK TIMEFRAME: H1,H4,D1 (98% WIN RATE FOR ALL MARKET)

The Volume+ and VSA Signals indicator for MT5 is based on the Volume Spread Analysis (VSA) methodology to provide the signals. The signals are displayed at closing of bars on the main window or subwindow in the form of symbols. The symbols are not repainting. The indicator produces a signal on an individual bar and this signal is not buy or sell signal. When a minor trend goes in the opposite direction of a major trend, there are sequences of major trend-following signals that give a higher pro

The indicator is created using a unique algorithm that has no analogues. Based on the calculations, the contract price itself and the percentages displayed in it are calculated, which are displayed in the indicator in the form of histograms in two drawing options, as well as in six options for displaying prices on a chart in various combinations, which allows you to accurately see the interest of all trading participants in the form of drawing levels support and resistance. Trading decisions can

This Indicator breaks down the movement into 3 waves: The primary wave suitable for long-term trading The intermediate wave suitable for intraday trading The minor wave for short-term trading
Supports and resistances:
Each wave is defined by major highs and minor lows. According to Dow's theory, an uptrend will be defined by minor lows higher and higher and a downtrend by major highs lower and lower.The indicator plots the next supports and resistances for each wave.
Trend channels (primary
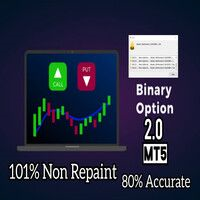
Alright. This indicator works on MT5 and is very easy to use. When you receive a signal from it, you wait for that candle with the signal to close and you enter your trade at the beginning of the next new candle. A red arrow means sell and a green arrow means buy. for easy identification of trade signal. Are you okay with that?
The indicator cost $500. We release new updates of the indicator every month and the updates are for free once you bought the indicator first time. This indicator was

MT4 Version GaussChannelPro is a powerful and innovative trading indicator designed to enhance your trading strategy with the precision of Gaussian-based channels. Leveraging the principles of Gaussian (normal) distribution, this indicator creates a unique channel on your price chart, offering valuable insights into market trends and potential turning points. Utilizing advanced statistical analysis, GaussChannelPro calculates the optimal channel boundaries based on historical price data, present

LT Regresyon Kanalını keşfedin, Fibonacci analizi, Zarf analizi ve Fourier ekstrapolasyonunun öğelerini birleştiren güçlü bir teknik gösterge. Bu gösterge, Fibonacci analizi ile aşırı alım ve aşırı satım seviyelerini tanımlamada hassasiyeti artırırken, pazar volatilitesini değerlendirmek amacıyla tasarlanmıştır. Ayrıca pazar hareketlerini tahmin etmek için bu göstergelerin verilerini entegre ederek Fourier ekstrapolasyonunu kullanır. Çok yönlü aracımız, diğer göstergelerle bağımsız veya birlikt
FREE

Bu gösterge, buradan indirilebilen My Candle Complete'in bir demo sürümüdür: Candle Patterns Creator Tam sürümü ile kendi candle kurallarınızı oluşturabilir ve stratejinize göre geleneksel candle desenlerini daha doğru hale getirebilirsiniz. Gösterge, birkaç örnek candle kuralı içerir, ancak burada sadece bazılarını göstereceğim: Pattern Rule Candle Green C > O Candle Red C < O Doji C = O Hammer (C > O and (C-O) *2 < O-L and (C-O) *0.5 > H-C) or (C < O and (O-C) *2 < C-L and (O-C) *0.5 > H-O) Ha
FREE

Smart Binary Volume göstergesi, ticaret hacmi analizini makine öğrenimi ile birleştiren çok yönlü bir araçtır. Scalping ve diğer kısa vadeli ticaret stratejileri de dahil olmak üzere çeşitli piyasalarda ve stratejilerde kullanılabilir. Gelişmiş makine öğrenimi algoritmalarını kullanarak, gösterge karmaşık desenleri tanımlar ve daha hassas alım satım sinyalleri üretir.
Buffer to Create EA. Buffer Line Gold = 0. Buffer Line Red = 2 Buffer AI = 3
AI Buffer >= 0 ("SIGNAL BUY")
AI Buffer
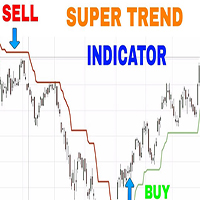
As the name suggests, it indicates the direction of the price movement in a market that is trending, that is following any particular path . It is plotted in stock price charts for investors to see marked current trend which is shown in red when prices have dipped and green when prices have risen.
Input Parameters:
CCI Indicator period ATR Indicator Period CCI Activation level Horizontal Shift of Indicator Bars
Otherwise ; You can use the Default settings

Presenting the uGenesys Break of Structure and Change of Character Indicator The uGenesys Market Structure Indicator is the advanced solution designed specifically for forex traders seeking a competitive edge. This innovative tool goes beyond merely identifying Break of Structure (BoS) and Change of Character (CHoC); it also illuminates optimal entry and exit points on your forex charts, transforming your trading experience.
While the uGenesys Market Structure Indicator can reveal pivotal pa

GeoInfo5 is one of the most informative indicators, it displays basic information about a trading instrument in a compact form. The version for the Meta Trader 4 terminal has gained wide popularity among traders. The indicator is free and will always be free. The launch version is now available for MetaTrader 5 as well.
displays information about the main parameters of the tool in a brief form in the line in the upper left corner of the chart: Spread, Swap for Buy order, Swap for Sell order,
FREE

MT4 Version Understanding market sentiment is a critical aspect of successful trading. Market sentiment refers to the overall feeling or attitude of traders and investors towards a particular financial instrument, such as a stock, currency pair, or cryptocurrency. It is a collective perception of market participants' emotions and beliefs about the asset's future price direction. Market sentiment can be bullish (positive), bearish (negative), or neutral (sideways). Knowing the market sentiment ca

Volume Cross Over is an indicator that measure positive and negative volume flow in a financial instrument, such as a stock, commodity, or index. It is base on the idea of On-Balance Volume developed by Joseph Granville. However instead of trending lines, this indicator shows volume cross over. When the closing price of an asset is higher than the previous closing price, then the Bull volume is greater than zero and Bear volume is negative. It suggests that buying volume is dominating, and
FREE

Introducing the "Super Trend Filter Oscillator," your ultimate trading companion designed to enhance your technical analysis and help you make informed decisions in the financial markets. This innovative oscillator is crafted to provide valuable insights into market trends and price movements, assisting traders like you in identifying potential entry and exit points. Features: Trend Identification: The Super Trend Filter Oscillator excels in detecting prevailing market trends, whether they are b
FREE
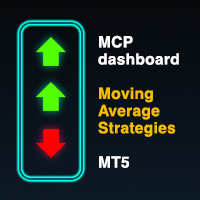
Multicurrency indicator in table format. Signals appear with confirmation, no repaints. Works on the current (open) timeframe. Notifications come for an open instrument. In the indicator settings, you can choose 1 of 4 Moving Average strategies. Strategies (represented in screenshots): Classic fast and slow moving average crossover Reverse signal of classic crossing (used for flat/sideways movement) Classic crossover relative to a slower moving average (Trend MA in settings) Price touching the f
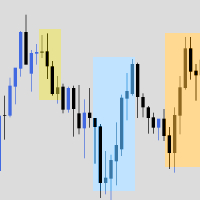
The indicator is a bundle of EIGHT different fundamental functions required for a trader: 1] Forex Session where you can determine your own timings/highlights. 2] High low marking from 1H to 1M 3] Sweetspot 4] Spread and Candle Stick Timer 5] Background logo for branding- You can place the images at any zone of the chart you want 6] Profit and Loss 7] Days names (SUN MON TUE…) on the chart 8] High/low break notification
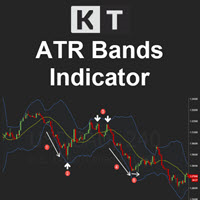
KT ATR Bands draws the volatility envelops and bands using a combination of Average True Range and Moving average. They are typically used to identify the potential reversal points and the periods of high and low volatility.
Features
Multi-Timeframe Ability: For example, you can have the atr bands from the daily timeframe on the H1 timeframe. Smart Alerts: You can turn on/off alerts for each band separately. Also, you can choose a minimum time interval between each alert to stop unnecessary,

KT DMA is a modified and advanced version of the classic Displaced Moving Averages with buy/sell crossover alerts and a Multi-Timeframe scanner that shows DMA's direction across each real-time time frame. A Displaced Moving Average is a simple moving average that moves ahead or backward in a time frame (either short-term or long-term). It also allows you to predict price movement more accurately.
Features Depicts the trend direction using the alignment of three moving averages. Buy/Sell signa
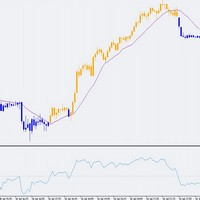
This indicator can be very important in any trading system. The Indicator colors candles above or below the 50 level of the RSI, which is a widely used indicator in technical analysis. With this indicator it is much easier to identify trends, helping with the entry and exit points of negotiations. It is a fact that in the financial market, simple things work. Este indicador pode ser muito importante em qualquer sistema de negociação. O Indicador colore as velas acima ou abaixo do nível 50 do

The Spider ZIGZAG is an algorithm to determine how critical the current peak is by spreading several lines with different parameters instead of one line between each 2 peaks. 1. The more zigzag's lines meet at a peak the higher probability the market will go for correction or change direction. 2. Usually when 3-4 zigzag's lines meet at a peak, the market enters a correction period, this don't happen instantly, it might take some time. 3. Usually when 5-6 zigzag's lines meet at a peak, th
FREE

The RSI (Relative Strength Index) scanner is a powerful technical analysis tool designed to help traders and investors identify potential trading opportunities in the forex, stocks, and cryptocurrency markets. RSI is a popular momentum oscillator that measures the speed and change of price movements and helps determine overbought or oversold conditions in an asset. The scanner takes advantage of this indicator to streamline the process of finding trading signals and opportunities. The RSI value
FREE
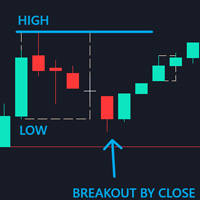
Control Candle is the candlestick which holds multiple inside bars and are in control until its high low range is broken by close of any candlestick. When control candle is broken, price may act on these control candle as support and resistance.
This indicator create rectangles on chart which will help you find control candles fast.
Control candle indicator box is customizable by color, style, width and other options in indicator settings.

KT Triple Top-Bottom identifies the triple top/bottom pattern with a breakout signal in the opposite direction. It is used to identify potential trend reversals.
A Triple Top pattern is formed when the price reaches a high point three times, while a Triple Bottom pattern occurs when the price comes to a low point three times.
Features The indicator detects the triple top/bottom pattern with high precision and accuracy. The indicator suggests a shift in momentum, with sellers or buyers takin
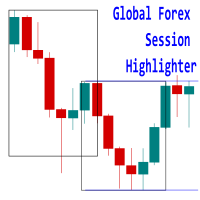
Introducing the 'Global Forex Session Highlighter' , a powerful tool designed to enhance your trading strategy by providing a visual representation of the Three major Forex trading sessions: Tokyo, London, and New York. This indicator is designed to help traders understand the dynamics of the global Forex market by highlighting the trading sessions directly on your MT5 chart. It provides a clear view of when each session starts and ends, allowing you to strategize your trades around the most act

Sunuyoruz, Didi Index Volume adlı bir teknik analiz göstergesi. Bu gösterge, Brezilyalı trader Odir Aguiar tarafından geliştirilmiştir ve finansal piyasalardaki fırsatları tespit etmede ileri ve güçlü bir yaklaşımıyla öne çıkmaktadır. Çeşitli platformlarda mevcut olan Didi Index Volume, kesin bilgilere ve değerli bilgilere ihtiyaç duyan işlemciler için vazgeçilmez bir araç haline gelmiştir.
Gösterge, Odir Aguiar tarafından oluşturulan saygın Didi Index ile işlem hacminin akıllı bir şekilde ku

Göstergenin temel amacı, işlemlere giriş ve çıkış anlarını belirlemektir, bu nedenle ExactArrow, piyasaya giriş çıkış yapılacak yerleri gösteren oklar dışında bir şey çizmez.
Göstergenin görünen basitliğine rağmen, içinde sistemin giriş ve çıkış anlarını belirlediği karmaşık analitik algoritmalar vardır.
Gösterge, mevcut mumda görünen bir ticarete girmek ve çıkmak için doğru ve zamanında sinyaller verir. Gösterge, ortalama olarak, muadillerinden 1-2 mum daha önce sinyal verir.
Göstergeyi

The Daily Highs and Lows Indicator is a versatile tool that combines support and resistance levels with real-time market dynamics. By incorporating previous daily highs and lows, it provides valuable insights into market psychology and identifies potential areas of price reversals or breakouts. With its ability to adapt to changing market conditions and customizable options, traders can stay ahead of trends and make informed decisions. This indicator is suitable for various trading styles and ti
FREE

This indicator uses candlesticks with large real bodies to predict possible market structure shift. Displacement is a very powerful move in price action resulting in strong selling or buying pressure. Generally speaking, displacement will appear as a single or a group of candles that are all positioned in the same direction. These candles typically have large real bodies and very short wicks, suggesting very little disagreement between buyers and sellers. Often, a displacement will occur just af

To get access to MT4 version please click here . - This is the exact conversion from TradingView: "CM Super Guppy" by "FritzMurphy" - This is a light-load processing indicator. - This is a non-repaint indicator. - This is not a multi time frame indicator. - Buffers are available for the lines on chart. - You can message in private chat for further changes you need. Thanks for downloading

Calculates the price change on each timeframe: floating or last closed bars.
My #1 Utility : includes 65+ functions | Contact me if you have any questions | MT4 version You can select the shift of the calculated basr: Floating (current) bars; The last closed (previous) bars; The type of price value can be selected using the blue switch on the top row: Pips; Market points; Percentage value (%); Price value; The method of calculating the bar size can be selected using the b
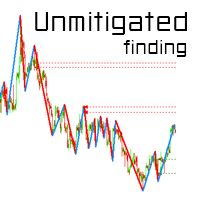
SMC Unmitigated Finding is a indicator for find unmitigated supply and demand in previous legs of price
Settings Zigzag Settings ZZDepth - by Default is 12.
ZZDeviation - by Default is 5.
ZZBackStep - by Default is 3. Horizontal Line Settings SupportColor- color for Support line.
ResistanceColor - color for Resistance line. Settings Num of Show - Number of Support & Resistance Show.

C300 SYNTHETIC INDICATOR 1MIN CHART Update V2 No repaint
*The indicator will not give a sell sign if the market conditions are not in place. *With all 3 strategy criteria in place the strategy based indicator signals 1-3 trades per day. *The drawdown can range to very high you need to place your own target profit and stop loss according to your risk management system . *The indicator is designed for only C300 and the 1min chart .
NB :Note this strategy based indicator will be free only f

Crash 500 indicator Update V2 No Repaint
This indicator works with a custom build in strategy The indicator will only give a sell sign when market conditions are in place. Only for sell. Apply own risk management target profit and stoploss. When market conditions are met the sell sign will indicate you to enter a sell position and you will have to apply your risk management system accordingly. This is only for Crash 500 market and only 1min chart
NB: Please note this indicator will be fr

3 candel indicator in 1 !!! The 3 most important candel indicator in 1 packadge. Help trader in chart visualisation, prevent reversal !!! Doji : Gravestone Doji, Long Legged Doji, Dragonfly Doji. Engulfing : Bullish, Bearish. Hammer : red hammer, green hammer. Fully parametrable indicator icon color config and alarm. Free life time update !!! Just try our demo for free.

Introducing the "Cybercycle Trend" Forex Oscillator, a powerful technical indicator designed to enhance your trading experience in the foreign exchange market. This innovative tool utilizes advanced algorithms to identify and analyze market trends, providing you with valuable insights and helping you make informed trading decisions.
The Cybercycle Trend Forex Oscillator is specifically designed to detect and measure cyclical price movements in the forex market. By incorporating this oscillato
FREE

The Game-Changing Engulfing Candle Hunter - Your Guide to Profitable Trend Trading
Step into the realm of trading possibilities with our revolutionary product - The Engulfing Hunter. Designed by traders for traders, this dynamic indicator combines the potency of engulfing candlestick patterns and the versatility of proprietary trend detection system, offering a trading edge unlike any other. Engulfing candlestick patterns have always been a revered tool in the arsenal of seasoned traders. Acti

Introducing the Kangaroo Hunter - Your Ultimate Edge in Forex Trading ATTENTION Forex Traders! Are you in constant pursuit of high-probability trade setups? Or maybe you're a novice trader struggling to pinpoint precise entry and exit points? Our solution, the Kangaroo Hunter, is about to revolutionize your trading journey. This meticulously designed indicator simplifies and refines the art of identifying the often elusive Kangaroo Tail patterns in the Forex market, pushing your trading strateg
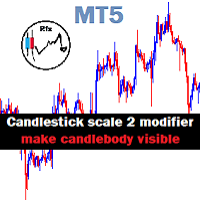
Chart Candlestick scale 2 zoom will visible instead of just a tiny unrecognized line make it look neat and tidy Instruction.
If you don't like the candles colors, you can do so by changing color. read below:
-Colors must be changed in the indicator setting.
-It won't change through the Chart properties to modify.
-After changing the color, save it as template so it wont change the colors to default value.
FREE
Market screener: Spread and Swap, for selected Symbols. You can customize the list: set only the Symbols (currency pairs) that are needed. The number of Symbols is unlimited. The list can be sorted in ascending or descending order (Symbol name). The panel can be moved to any place on the chart. You can also minimize the panel. Displayed values: Current market price (BID); Spread size; Swap, for Long positions; Swap, for Short positions; Overall P/L of the entire account; My #1 Utility : includ
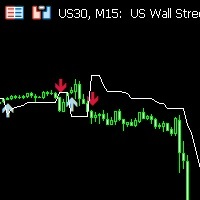
**Features:**
1. **Innovative Trend Tracking:** The UT BOT Simple Indicator leverages the power of the Average True Range (ATR), a renowned volatility measure, to calculate precise trailing stop values, providing unparalleled insights into market trends.
2. **Customizable Settings:** Flexibility is paramount in any trading strategy. With this in mind, our indicator allows you to adjust the ATR periods and other key parameters to tailor the tool to your trading style and strategy.
3. **Rea
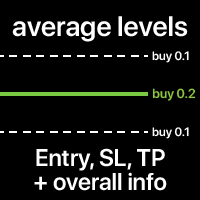
The average Entry, SL and TP levels of all trades on the Symbol. The levels can be calculated together, or separately for Buy and Sell trades. You can optionally display additional info: Level price, total Lot size, floating P/L. The styles and colors of the levels are customizable. My #1 Utility : includes 65+ functions | Contact me if you have any questions | MT4 version In the settings of the indicator, you can configure: Average Entry level: on/off; Average SL level: on/off; Average

Meet the Tweezer Hunter, an essential tool for every Forex trader looking to make accurate, trend-following trades. This powerful, intuitive indicator helps traders spot potential trend reversals before they happen, providing a significant advantage in the fast-paced world of Forex trading. The Tweezer Hunter is more than your average tweezer candle indicator; it's designed with a built-in trend identification feature that accurately detects whether the market is bearish or bullish. By integrat

ICT, SMC, Akıllı Para Kavramı, Destek ve Direnç, Trend Analizi, Fiyat Hareketi, Piyasa Yapısı, Emir Blokları, Kırıcı Bloklar, Momentum Değişimi, Güçlü Dengesizlik, HH/LL/HL/LH, Adil Değer Boşluğu, FVG, Prim ve İndirim Bölgeleri, Fibonacci Retracement, OTE, Alış Tarafı Likidite, Satış Tarafı Likidite, Likidite Boşlukları, Piyasa Oturumları, NDOG, NWOG, Gümüş Mermi, ict şablonu
Finansal piyasada doğru piyasa analizi yatırımcılar için çok önemlidir. Yatırımcıların piyasa trendlerini ve likiditey

Önceki Günün Kapanışı ve MetaTrader için Bar Kaydırma! Önceki Günün Kapanışı ve Bar Kaydırma Göstergesi, teknik analizi ve işlem yapma kararlarınızı geliştirmek için tasarlanmış bir araçtır. Bu gösterge ile herhangi bir çubuğun açılış, maksimum, minimum ve kapanış seviyeleri hakkında ayrıntılı bilgilere erişebilir ve piyasa hareketlerinin doğru ve kapsamlı bir şekilde analizini yapabilirsiniz. Bir zaman aralığını diğerinin içine yerleştirebilme hayalini kurun, böylece mevcut zaman aralığınızda f
FREE

MetaTrader 5 göstergelerindeki son yeniliğimizi tanıtıyoruz, yüksek işlevsellik ve kullanım kolaylığı ile işlem süreçlerinizi önemli ölçüde geliştirmek için tasarlanmıştır. Grafik analizinizi düzene sokmak ve işlem kararlarınızı en iyi şekilde kullanmak için tasarlanmış sağlam bir özellik seti içerir. İşte harika özelliklerinin hızlı bir özeti:
1. **Hızlı Nesne Çizme**: Değerli zamanınızı hızlı çizim özelliği ile tasarruf edin. Sadece bir düğmeye tıklayarak grafik üzerinde çeşitli işlem nesne

The indicator displays a renko chart and a supertrend indicator in real time. After installing the indicator, the window will display the Renko chart and the supertrend indicator in the same window. This allows you to more clearly and visually see the entry and exit points when a trend reversal occurs. The signal to open a position is the intersection of the Renko candlestick of the supertrend indicator point and the appearance of the opposite signal of the supertrend indicator.
The indicator
FREE
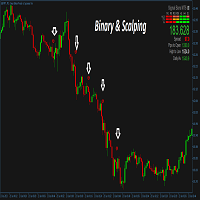
This is a trend following system for Binary options traders and forex scalpers. It is carefully crafted and recognizes periods of WATERFALL in the market and gives the trader the advantage and opportunity of riding with the momentum. It works on all timeframes and currency pairs especially high liquidity pairs. Avoid news events 15mins before and after. Always have your money management script or system in place. Tested on Deriv synthetics as well, please check screenshots. The mt4 version can b

JCAutoStm 简繁塞壬模型 1.Zigzag3浪,大中小三浪代表市场潮流、趋势、涟漪。 2.自动识别当前三浪的走势,命名每一种结构形态。 Zig123下跌3浪5浪7浪:D3/D5/D7,下跌中继形态:DRF1/DRF2/DRF3,底部反转形态:BRP1,BRP2,BRP3,特殊结构下跌5浪后底部反转结构Zig123D5BRP1/2 Zig123上涨3浪5浪7浪:U3/U5/U7,上涨中继形态:URF1/URF2/URF3,顶部反转形态:TRP1,TRP2,TRP3,特殊结构上涨5浪顶部反转结构Zig123U5TRP1/2 3.趋势线绘制,分别以大中小三浪相邻的高低点进行绘制。 绘制的原则是,收敛形态。 4.三浪有效SR,F3,F6,F12,F15,绘制水平线。 MACD背离线
FREE

To test the adviser, do you open a separate account for each of them? this is very inconvenient, but thanks to this indicator, this is no longer a problem!
Do not be too lazy to read the full description and do not close the page ahead of time, this indicator is needed by almost every trader, no matter if he trades with his hands or uses advisors.
Buying this indicator as a gift you will receive an adviser with not bad results.. if you have already received a gift from me from othe

Easy to use buy and sell signals with arrows. Non Repainting indicator. Non Lagging indicator. Down Arrows indicate sell and up arrows indicate buys. Works on any market and on any time frames. Arrow colors can be changed to match chart colors. Audible alerts. Periods can be changed to phase out false signals. Please remember to follow the trend like with any indicator.
The Scalper v2 will give you accurate guidance to trade with. It has indications with arrows and it sends notifications. This software was built based on the RSI,MACD,Martingale, Ema 50 and 200, Aligator, SMA 30,50, ADX, Volumes percent range, variable dynamics and fibonacci levels. all of these indicators have something in common, it allows analysis, support and resistance, accurate signals for buy and sell, overbought and oversold market analysis. I have combined all of these indicators into o
The Adaptive EMA consists of 3 lines: Yellow, Blue and Red If a yellow line appears, it means the market is entering Consolidation, Range, Contraction and no opportunities are available. If a Blue line appears, It means prices are accumulating, and now being marked up, so you are now entering a buy market with a strong Bullish trend. If a Red line appears, it means prices are now being marked down, price distribution is underway, so you are now entering a Sell market with a strong Bearish trend.

Smart Currency Strength is a powerful yet simple indicator that measures the strength of individual currencies.
It features a graphic panel that lists the main currencies and their strength in each timeframe, ranging from 0 (most oversold) to 100 (most overbought). The strength for all currencies in the current timeframe is also shown in a separate window as a multi-line graph, where each currency is represented with a different color, this allows you to monitor the evolution of strength tre

SourcePoint是一个很好的中长线交易指示器,他能独立使用,也可以去其他趋势型指标独立使用,可以很好的指出最佳的buy和sell位置,指标不含有未来函数,不会重新绘制,不仅能够应用到自己的手动交易过程中,还能完全可以写入到自己的EA中。建议配合BS TrendLine( https://www.mql5.com/zh/market/product/96476?source=Site+Market+My+Products+Page ) 一起使用。 (如果你感觉到这个指标能够帮助你进行更准确的交易,请帮忙给个好评,希望我的作品能够帮助更多有需要的人) ===================参数列表===================== fastP: 12 slowP:26 avgP:9 =================参考使用方法=================== 此指标可以适用于任何交易品种,能够用在任何周期。 每次形成一个交点,就是一个交易机会,同时也是一个持仓平仓点位。建议配合大小周期一起使用,这样更容易让你找到更精准的入场位置和出场位置

Moving Average Crossover Indicator. Add this Easy Indicator to your charts. The indicator indicates when to buy and when to sell. When the line is orange that is a sell signal. When the line is green that is a buy signal. Easy to use and colors can be changed so suit your charts. Easy to use. Follow the indicator and enter your buy and sell signals. Work on any market and on any timeframe.

Hesap Panosu İstatistikleri
Hesabınızın kar ve zararlarını bilmek, böylece takip edebilmeniz için odaklanmış bir görüşe sahip olmanıza yardımcı olacak bir araçtır, aynı zamanda elde edilen riski bilmek için bir düşüş analizi de getirir. Hesabınızda indirip etkinleştirdikten sonra, onu herhangi bir sembole, örneğin EURUSD H1'e eklemelisiniz, ardından bu andan itibaren araç istatistiklerinizi izlemeye başlayacaktır.
panel tamamen gelişmiştir, gizleyebilir ve istediğiniz yere taşıyabilirsiniz
FREE

Smart Drawing Assist PRO MT5. Buttons will appears next to the selected object. The buttons are straightforward and amazingly easy to use. Features are as follow: Draw zigzag . Enabling you to draw patterns, draw zigzag, and draw shapes. All you have to do is click the button and start clicking point to point and it will draw automatically. Change object color . Rectangle/Trendline/HLine/Vline/Text/Price Arrow/Arrowed Line/ and your suggestion please. Flatten trendline . make a perfect flat line

Welcome to the presentation of the AI Channel indicator, a powerful tool that uses artificial intelligence for price channel analysis in the financial market. In this session, we will explore how this revolutionary indicator can assist investors and traders in making more informed and strategic decisions. Let's get started! I. What is the AI Channel indicator? AI Channel is an indicator developed based on advanced artificial intelligence algorithms. It utilizes historical price data of financial
FREE
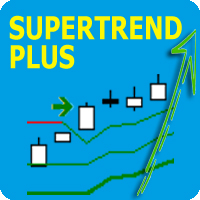
Super Trend Plus is a trading system that uses four Supertrends set with different parameters. The idea behind this system is that when three Supertrends move in the same direction, there is a strong trend confirmation, but entry occurs only when the fourth Supertrend also moves in the same direction as the other three. For example, the first Supertrend could be used with a volatility multiplier of 3 and a period of 10, the second Supertrend with a volatility multiplier of 3 and a period of 12,
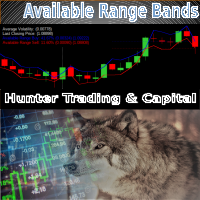
The Available Range Bands Technical Indicator draws two lines on the chart indicating the maximum limits (bands) expected for buying and selling for the current period (candle). These limits can be accessed by buffers 0 and 1 respectively.
In addition, it displays in the lower right corner the current average values of the real volatility, the last price, the predicted range of movement available for buying (% and points) and the predicted range of movement available for selling (% and points
FREE

The RFOC Symbol Background was created to display the name of the asset and the current timeframe in the background of the chart.
Displaying the name of the asset at the bottom of the chart is often used by traders who are designing the screen for spectators, making it easier to identify the asset and the timeframe during a class, for example.
It is available for the user to select the font size (small, medium or large) and select the color for better viewing according to the background colo
FREE
MetaTrader Mağazanın neden ticaret stratejileri ve teknik göstergeler satmak için en iyi platform olduğunu biliyor musunuz? Reklam veya yazılım korumasına gerek yok, ödeme sorunları yok. Her şey MetaTrader Mağazada sağlanmaktadır.
Ticaret fırsatlarını kaçırıyorsunuz:
- Ücretsiz ticaret uygulamaları
- İşlem kopyalama için 8.000'den fazla sinyal
- Finansal piyasaları keşfetmek için ekonomik haberler
Kayıt
Giriş yap
Gizlilik ve Veri Koruma Politikasını ve MQL5.com Kullanım Şartlarını kabul edersiniz
Hesabınız yoksa, lütfen kaydolun
MQL5.com web sitesine giriş yapmak için çerezlerin kullanımına izin vermelisiniz.
Lütfen tarayıcınızda gerekli ayarı etkinleştirin, aksi takdirde giriş yapamazsınız.