YouTube'dan Mağaza ile ilgili eğitici videoları izleyin
Bir ticaret robotu veya gösterge nasıl satın alınır?
Uzman Danışmanınızı
sanal sunucuda çalıştırın
sanal sunucuda çalıştırın
Satın almadan önce göstergeyi/ticaret robotunu test edin
Mağazada kazanç sağlamak ister misiniz?
Satış için bir ürün nasıl sunulur?
MetaTrader 5 için ücretsiz Uzman Danışmanlar ve göstergeler - 28

//////////////////////////////////////////////// //////////////////////////////////
An improved version of the standard Bulls Power and Bears Power indicators.
Now it's two in one.
The setup is simple - you just need to specify the period. It is also very easy to understand the readings of this indicator, a signal above zero is a buy, and below it is a sell.
//////////////////////////////////////////////// ///////////////////////////////////
I hope this indicator will be very useful t
FREE

Calculate the Variance of prices on the chosen time frame and compare with the price range reached. Or in other words how mutch is price moving in the recent candles? Two impots: Candle = 4 (Default) number of previous candle to calculate Backward = 500 (Default) How many candle to go backward
Variance is calculated as follow: Variance(X) = Average(X 2 ) – [Average(X)] 2
Subsequently Variance is rapported to the price range fo the chosen period (i.e. 4 candles) Indicator = Variance(X) / (
FREE

Indicador MAPS Indicador é um oscilador que faz o plot da Curva de Retorno de uma regressão de segundo grau para os preços de fechamento do ativo do gráfico. A Curva de Retorno é a linha central do indicador MAPS e representa a região de equilíbrio do preço entre vendedores e compradores. Os plots do indicador são: Linha central - C0 - cor da mesma varia de acordo com a tendência do mercado, sendo verde para tendência de alta e vermelho para baixa; Linhas superiores: S1, S2, S3 e S4, sendo que a
FREE

This indicator has the main purpose of showing the current spread of the asset in which the indicator was placed. Depending on the photos, visually and within the graph itself, it is possible to view the spread value at the current time, it is possible to change the vertical position of the text and the horizontal position, in addition to the font size and color of the text.
FREE

TickChart Indicator plots tick line on the main window of MetaTrader.
In the Lite version, the number of ticks is limited to 20 and the alert function described below is omitted. The tick-line shows the most detailed, fastest and real-time activities of the market, which are usually hidden in bars or candles longer than 1 minute. Usually, several new tick-line segments appear while a bar of M1 time frame is completed. After the release of an important economic indicator, the number of ticks pe
FREE
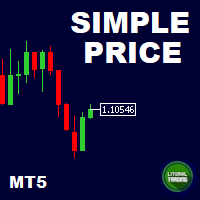
This is our simplest tool! With it you hide the Bid and Ask lines from chart and have only a small rectangle showing what current price is. This tool is useful for those who want the cleanest chart possible. You can also show the Ask price only, instead of the Bid (most common). To further assist you in cleaning the chart check out our other tool: https://www.mql5.com/en/market/product/41835 Any questions or suggestions, please contact us. Enjoy!
FREE
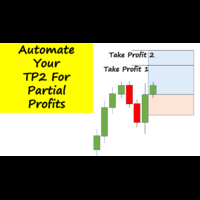
Have you ever been in a winning trade and wanted to close say half of position to lock in some profit. Well, this expert advisor does just that for you, and it's absolutely free. What you need to do is set what percentage of your trade you'd like closed and then set the price you like to close at. It that simple.
To get a better understanding of how it works, then watch the video below.
Note: The EA only works with one timeframe, changing timeframes will result in lose of all data by the E
FREE
This EA has no stop loss. All risks are at your discretion.
This is Free EA, It can make you profitable if you use it carefully. Please don't ask for the MQ5 file, I'm using it to develop other robots.
Gegenpressing MT5 EA is a fully automatic Expert Advisor for Scalping Trading on XAUUSD timeframe M1 but also in others. The basic strategy starts with Market order in Trend Following, so this EA Follow the Trend . M1 Trend…. very very fast.
If you like this EA and want to hel
FREE

This indicator is based on the MACD indicator
Also, some candlestick patterns are used in it to identify better signals
Can be used in all symbols
Can be used in all time frames
Easy to use method
Adequate settings
Settings: period: The number of candles used to calculate signals. pFast: Like the MACD indicator settings pSlow: Like the MACD indicator settings
alarmShow: If you want to receive an alert in Metatrader after receiving the signal, enable this setting alarmShowNoti: If you
FREE

Overview The Expert Advisor sends notifications to a mobile phone, via e-mail or activates an audio alarm in case any changes are detected on the trading account: opening/closing positions, changing order parameters, balance or leverage. Also, the Expert Advisor can inform that Equity on the trading account has dropped below a specified value or Free Margin is small compared to Margin. The Expert does not trade, it only monitors your account and orders.
Launching the Expert Advisor You should
FREE

The ColorLine indicator shows the line of the price moving average on the chart. The line has diffrent colors (100 bars have the same color). The color settings of the line is changing every 5 ticks, there are 3 color schemes. Indicator for demonstrating the DRAW_COLOR_LINE style. Draws a line at Close prices in colored pieces of 20 bars. The thickness, style and color of the line sections are changed randomly. The indicator code is published in the MQL5 Documentation in the section Indicator S
FREE
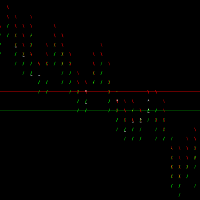
Analisador de Segundos, exibição de sinais e formação de padrões. Alteração a precisão do tempo em: Ferramentas --> Opções --> Aba Graficos --> item: Escola de Tempo Precisa. / --> indica uma compra \ --> indica uma venda "-" --> indica um movimento de indecisão. ^ --> indica um esforço dos compradores para manter e ou reverter a direção do mercado. _ --> indica um esforço dos vendedores para manter e ou reverter a direção do mercado.
As linhas de compra e venda tenta indicar o real spread do
FREE

This is a regression tree indicator for MT4/MT5.
This indicator classificate nodes on the time period so that the deviation becomes smaller,
and displays regression line and channel for each node.
It's free!
Attached CartDemo.ex4 and CartDemo.ex5 is a Demo version and has the following limitations:
Method is RandomForest only
Maximum number of bars is 200
Maximum number of trees is 2
Maximum tree depth is 2
Calculated waste lines are shown
Not display correlation coefficients
Fu
FREE

Trade with an edge by using the Trader Starter Kit. This powerful assistant was built to help all types of traders. It uses the T.A.E framework to analyze the chart in order to provide a filtered view of the market. T: Trend - Identified by checking for a series of higher highs and higher lows or lower highs and lower lows A: Area of value - Identified through a trading range calculation that obeys the rules of buy low and sell high E: Entry-trigger - Identified by analyzing candlesticks for var
FREE

A simple indicator/tool to display the current timeframe in the center of the chart. The object is automatically moved to the center of the chart whenever the chart size is changed by the user.
Input Parameters :
Font (default is Arial Black) Font Size (default is 50) Font Color (default is Silver, for light theme graphics, change to black or another dark color) Font Transparency (default is 90%)
FREE

When creating, modifying and moving a trend line, two anchor points will be selected: high / low, open / close, median or weighted from the candlestick prices.
For high / low, open / close, if the anchor point is above the candlestick, the upper price will be taken, below the candlestick - the lower one. If the point is inside the candlestick, then if the first point is higher than the second, then the first one goes up, the second goes down. Conversely, if the second is higher than the first
FREE

Indicator that show candlestick bars with an different sampling method than time fixed. Real time data is sourced to the indicator and it may be used as substitute of the default graph. Each bar is formed when a predefined volume of assets was dealt, showing in the graph the OHLC of this clustering. The amount of bars is proportional to the amount of negotiations instead of a sample in a fixed amount of time. If the broker doesn't show the real volume of the trades, this indicator won't work. Th
FREE

Demo heging tool: Create a panel on chart show detail and button support
- Show detail orders running (Buy/Sell):
+ Total orders
+ Total profits
+ All Commission
+ All Swap
- Action(Button):
+ Close All Orders
+ Close All Orders Buy
+ Close All Orders Sell
+ Proactive heged all orders running
- Auto Mode:
+ Close all order when profit reach target
+ Heged order follow target
FREE

Logarithmic chart in new window You can use both chart as half or full window All features are active in both arithmetic and logarithmic charts Magnet in arithmetic chart is standard metatrader magnet in logarithmic chart magnet have two modes: first mode only select high or low, if this mode is enabled, you can set how many candles will be search before and after to find the highest or lowest points second mode select the closest point of the candle to click, its choose between 4 points (High,
FREE

The Panel will read the floating profit/loss for the symbol of your chart and will plot the profit/loss numbers on the chart. It will work with manual trades or trades made by any expert advisor. The Panel shows the Max Drawdown in the base currency, floating profit/loss for both buy and sell orders. It will also show the same in Pips. The Panel is movable on the chart, so you can drag it using the mouse cursor.
FREE

This project did not reach the basic funding number, so I am abandoning it momentarily. The system is now free for other traders to continue the idea. You can follow my new project through my signals.
A tool for institutional investor, now avaliable for Home users. We equip you like banks equip their analysts!
How it works
Focused on the Forex market, it takes advantage of the need of nations to control the value of their currency and the world exchange variations to analyze, through the
FREE

This indicator solves the problem of chart scaling where the bar becomes too thin and it becomes difficult to determine the bar's open and close prices.
Thick Bar indicator - allows you to change the thickness of the lines and the color of the stroke, due to which you can get a thicker bar on the chart. The default indicator has a bar thickness of 2 and preset colors that can be changed in the settings
FREE

If your strategy requires trading during a certain period of market activity - calm or turbulent, this indicator will help you find such periods of time within a week for each currency pair using statistics.
The principle of the indicator is quite simple.
The entire trading week, from Monday 00:00 to Friday 23:59, is divided into timeslots, the duration of which corresponds to the current timeframe.
For each timeslot, activity is calculated - the average value of the difference between the
FREE

A professional tool for trading - the divergence indicator between the AC and the price, which allows you to receive a signal about a trend reversal in a timely manner or catch price pullback movements (depending on the settings). The indicator settings allow you to adjust the strength of the divergence due to the angle of the AC peaks and the percentage change in price, which makes it possible to fine-tune the signal strength. The indicator code is optimized and is tested very quickly as part
FREE

Este indicador apresenta 7 médias configuráveis, que podem facilmente ser utilizadas em robôs ou em operações manuais.
Facilita a identificação de tendências e reversões. Seus buffers estão ordenados e são facilmente identificáveis para utilizar em robôs. Liberado para uso em operações manuais ou automatizadas.
Em breve vamos postar um robô que utiliza estas médias como parâmetro de negociação.
FREE

--- StudentK Sync Chart --- 1. Move charts at the same time 2. Cross check among different Symbols and Timeframes 3. Plan your own trading strategies
=== Simple (Free) Version ===
1. Allow USDJPY only
2. Support M5 and M15
3. * Contact StudentK for unlocking all timeframes *
--- Context --- StudentK is not indicated as a master or K Sir for knowledgeable person who claims for winning all the time. (But lots of traders should know the fact that it is rarely truth, especially in fluctuat
FREE

Script for Metatrader 5. One click to Delete the background grid and object, all objects on the chart such as Trend lines you have drawn or created by another program arrows text Fibonacci lines removes the background grid making a clearer clean chart horizontal and vertical lines
Easy for clearing a chart or when opening new charts. Please leave a review on how its working.
FREE

Volume Cross Over is an indicator that measure positive and negative volume flow in a financial instrument, such as a stock, commodity, or index. It is base on the idea of On-Balance Volume developed by Joseph Granville. However instead of trending lines, this indicator shows volume cross over. When the closing price of an asset is higher than the previous closing price, then the Bull volume is greater than zero and Bear volume is negative. It suggests that buying volume is dominating, and
FREE

Bu komut dosyası, çeşitli pencere işlevlerinde ağırlıkları değerlendirmek için tasarlanmıştır. Bu pencere işlevleri üzerine kurulu bir gösterge https://www.mql5.com/ru/market/product/72159 adresinden indirilebilir. Giriş parametreleri: iPeriod – gösterge dönemi. iDönem >= 2 iCenter, pencere işlevinin merkezinin bulunacağı referansın dizinidir. Varsayılan olarak, bu parametre 0'dır - pencerenin merkezi, göstergenin merkeziyle çakışır. 1 <= iCenter <= iPeriod ile, pencere işlevinin merkezi ka
FREE

This is a demo version of the Candle Absorption Full indicator. It has limitations on operation. This indicator detects the Engulfing candlestick pattern and draws the corresponding market entry signal.
Features It works only with EURUSD on timeframes M1 and M5. The indicator analyzes a combination of 2 or 3 candlesticks depending on settings. The number of pre-calculated bars (signals) is configurable. The indicator can send an alert to notify of a found signal. Signal can be filtered by sett
FREE

A simple and convenient utility for closing orders. It can close both all orders together as well as buy, sell or pending orders separately. Has an intuitive graphical interface. MT4 version of the utility - https://www.mql5.com/en/market/product/78601 If you like this utility, take a look at my other products - https://www.mql5.com/en/users/nina_yermolenko/seller
FREE

Switch symbols and timeframe by arrow buttons 1. You can switch multiple symbols of one or all charts. 2. You can set list of symbols to switch between them or get them from Market Watch. 3. You can change timeframe of one or all charts. List of timeframes here [M1, M5, M15, M30, H1, H4, D1, W1, MN1]. Switch symbol of all charts: indicator check current symbol of the chart to get index of it in list and change for next or previous. Key functions: - Right arrow key: switch to next symbol. - Left
FREE

Dieser Expert Advisor ist ein Trendfolge Roboter. Der Expert Advisor hat sehr viele Einstellungen und sollte im H1 EURUSD eingesetzt werden.
Es ist auch möglich diesen Roboter GBP zu verwenden, auch sind andere Timeframes möglich.
Nachdem sehr viele Einstellungen möglich sind, kann sehr viel getestet werden.
Ziehl ist es mit diesem Roboter langfristig erfolgreich zu sein.
FREE

backtester buttons for testing strategies in the MT5 strategy tester.
load up strategy tester then click on visual test and once visual tester opened apply any chart template you'd like. To update the chart pause the visual tester and apply templates, colors and such like the normal chart. On the settings you can choose lot size and take profit and stop loss.
Enjoy
FREE

This is a tool created for scalping. it can generate pending orders with 4 input: 1. Volume : Lot for the Pending Orders 2. Distance : Distance within the Orders in Points 3. Total Order : Total Generated Orders 4. Take Profit : TP for the generated Orders in Points 5. Stop Loss : SL for the generated Orders in Points It also have another tools which can monitor the floating and close at defined profit using Closed at Profit Input What's new: - Stop Loss in Pip
FREE
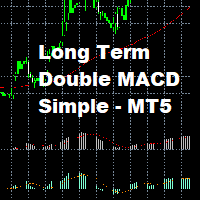
Long Term Double MACD Strategy with EMA Trend Confirmation
This strategy uses a leading and lagging MACD indicator. The leading indicator gives the entry signals, and the lagging indicator gives the exit signals. This Expert does not use any account management and as such you should make sure to set good stop losses.
Works best on longer timeframes on low volatility pairs.
FREE

Binance Future ( Binance Vadeli ) da listelenen sembolleri Metatrader5 piyasa gözlemine ekler. Ücretsiz bu dosya ile tüm liste saliseler içinde listeleyebilirsiniz. Demo hesabınıza kolayca kurabilirsiniz Binance Future Tick için yüklenmesi gereken ilk dosyadır ve ücretsiz sunulmaktadır. Araçlar menüsü / Seçenekler / Uzman Danışmanlar / Listelenen URL'ler için WebRequest kullan seçeneğini seçmeniz gerekli
Metatrader'a eklemek için videoları izleyebilirsiniz.
FREE

产品介绍 这是款非常简单有效的EA , 该EA使用布林带、AO指标以及斐波那契回调线的组合而进行工作。产品的核心理念为市场情绪的惯性交易。该EA是不考虑趋势方向的,适用于市场振幅始终的产品,多数直盘货币对均可试用。白银以及股指类慎用。
适用品种: GBP/USD JPY/USD EUR/USD
联系我: 知乎:https://www.zhihu.com/people/maysen-30 微信:maysen55
参数 介绍 开仓分数 BB、AO指标打分高于多少开仓 幻数 交易标识 布林带周期 周期,建议考虑最近5天以上数据 内偏移 偏移指数 外偏移 偏移指数(要大于内偏移) 开仓类型 固定值、资金比例 开单比例 资金比例开仓百分比 最小开仓量 固定值开仓手数 回调线观察柱数 超过柱数不再进行回调线划线
FREE

It is is your personal risk guard. Drop it on any chart on your VPS or trading computer and it will guard your total risk in any pair or asset and make sure the sum of all stops is within your risk. If you happened to exceed the risk, in a split second this EA will calculate the exact position for the combined risk of all open positions and place all stops at the exact same spot. If you open a new position with another lot size . No problem, all stoplosses will automatically adjust. Tired of man
FREE

I always wondered if I can have multiple time frame Moving average on same chart , it is not possible , now with my Indicator is possible , As you know Moving average is lagging not leading indicator , but how can I predict future levels of it ?
I came with this idea , I hope you will like it , I made a Mirror of Moving average , the other side of specific time will be shown in the other side of the chart where the price didnt reach yet , that will help you to know the levels you can start sel
FREE

O "Ouro Trader" é um robô financeiro projetado para ajudar investidores e traders a tomar decisões de investimento mais consistentes e lucrativas no mercado de ouro. O robô utiliza algoritmos avançados de análise de dados para analisar as tendências do mercado de ouro em tempo real e fornecer informações sobre quando comprar, vender ou manter ativos de ouro. Com o "Ouro Trader", os investidores podem se beneficiar de anos de experiência e conhecimento de especialistas em investimentos, sem prec
FREE
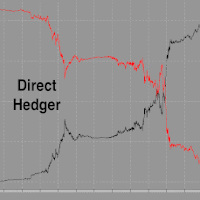
This EA is decided to protect all positions when the markt go in the wrong direction. Pre-requirement: The calculation of margin should not be SUM. E.g you have 1 Lot Buy Position (1) and 2 Lots Sell Position (2)-> then the required margin should not be sum of margin of Postion (1) + margin of Position (2) Strategy: The important parameter is the TML "Triggered Margin Level". E.g TML = 110%: This EQ will loop over all the open positions. I f the current margin level go down to <= 110%, it will o
FREE

This is an alert based on a moving average convergence / divergence (MACD) and additional moving average indicator (for trend confirmation) similar to my other product where you find detailed description of how it works. You get a colored table where colors are related to trading conditions (see below) with possibility to customize all indicator parameters, including Heikin Ashi calculations. Meaning of cell COLORS (can be redefined by user): GREEN - buy signal, PINK - sell signal, YELLOW - pay
FREE

Indicador Regressão Linear – Par de Ativos Indicador é um oscilador que faz o plot do Resíduo resultado da regressão linear entre os dois ativos inseridos como input do indicador, representado pela fórmula: Y = aX + b + R Onde Y é o valor do ativo dependente, X é o valor do ativo independente, a é a inclinação da reta entre os dois ativos, b é a intersecção da reta e R é o resíduo. O resíduo representa a quantidade da variabilidade que Y que o modelo ajustado não consegue explicar. E os resíduos
FREE

Túnel de Vegas, com até 20 níveis, permitindo plotar ou não cada nível com troca de cor, espessura das linhas e visualização ON/OFF para facilitar a utilização 100% gratuíto e vitalício
Recomendado a utilização para timeframes:
Original --> H1
Fractais --> M15, M30, H4, D1 e W1 Teste em Gráfico W1 apresentando consistência.: Acompanhe os resultados no meu sinal:
https://www.mql5.com/pt/signals/881577
Vídeo Explicativo: #Forex Trading - Indicador LacerdaFX Túnel de Vegas - 100% GRATUÍT
FREE
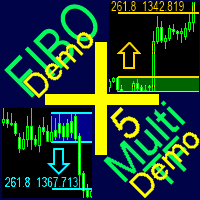
A ready-made multitimeframe trading system based on automatic plotting and tracking of Fibonacci levels for buying and selling any symbol. Demo version - calculation of the last 390 bars is not performed.
Advantages Determines the trend direction based on a complex of 14 indicators ( Cx ), extremums of ZigZag ( Z ), RSI ( R ), Impulse ( I ) Displaying the values of 14 indicators comprising the trend direction ( Cx ) Plotting horizontal levels, support and resistance lines, channels View the pl
FREE
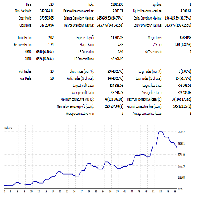
This is MacroTrendTrader. It trades in DAILY time frame even if you run it on lower time frames. It opens/closes trades once per day at a specific time that you choose via input tab: - "param(1-5)" are optimization parameters. - "Open/Close Hour" is set via input tab. Make sure to choose this to be away from nightly server shutdown. - "high risk" mode if chosen, sets a closer stop loss level. Therefore higher lot sizes are taken. This is a light load EA from processing point of view. Calculatio
FREE

This indicator emulates volume delta (buy trades vs sell trades) based on per candle volume and candle shape (direction, size of body and wicks). Artificially separated buy and sell volumes then accumulated for specified number of bars. The indicator shows a histogram of volume delta per bar, as well as a sum of the delta for the given period. What is more important, the indicator allows you to combine current symbol quotes/volumes with quotes/volumes of other related symbols (futures, indices,
FREE

Multi-timeframe trend indicator, based on the ADX / ADXWilder indicator The indicator shows trend areas using ADX or ADXWilder indicator data from multiple timeframes. The impulse mode of the indicator allows you to catch the beginning of a trend, and several "Screens" with different timeframes allow you to filter out market noise.
How the indicator works: if PDI is greater than NDI, then it`s bullish movement; if PDI is less than NDI, then it`s bearish movement; to determine any trend, it
FREE
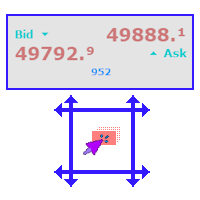
A simple and functional Current Price Panel that shows magnified Bid, Ask and spread price, that can be moved by using the mouse, to any location of the chart window. The functionality included are: Customize Current Price Panel Width and Height, Row and Column gap. Background color, background transparency and border color. Font, its size and color. Move the panel to any location of chart window. Option to show current spread as pips or points. Highlight spread in different color if it crosses
FREE

Displays previous months Highs & Lows. You can set the number of months to display levels for, also the line style, color and width. This is very useful for traders using the BTMM and other methods like ICT. I'll be creating more indicators for MT5 for the BTMM. Send me your suggestions to my Telegram: https://t.me/JDelgadoCR Take a look at my other products at: https://www.mql5.com/en/users/jdelgadocr/seller
FREE

Nueva entrega en la familia de los Baby EAs: Baby RSI es un EA Experto basado en el indicador RSI. No usa martingala ni grilla, estrategia basada en RSI, Estrategia conservadora. La oscilación relativa del indice del precio o RSI detecta sobrecompras y sobreventas, si estas revierten o hacen Pullback Baby RSI se posicionará a favor de esa corrección de precio, solo si esto ocurre, si no, no. Baby RSI es un Ea muy simple, no necesita mucho más y es una de mis favoritas estrategias automatizadas
FREE

Wolf Countdown helps you not to waste the right amount of time, it gives you back the time remaining until the candle closes.
How to use: Download and install the Wolf Countdown Indicator on your MetaTrader 5. Apply the indicator to your favorite chart.
this works on any timeframe...
Thanks to this indicator you will never miss the right moment to enter your trades.
FREE
TrendFollowMT is a fully automated trading system which is using large time frame to determine the trend and use small time frame to find the entry point. Once the trend changed to opposite side, the system will wait for another entry point to recover with bigger lot size. Moreover, the target profit will be moved up when more position had been opened. The aim is to cover the cost of waiting time and risk.
Free version will only trade on buy signal and locked the initial Lot size (0.01). Paid
FREE

The VR Close orders script is designed to close positions in the terminal at a profit or loss mark set by the trader. The program is written as a script and can work together on the same chart with any other indicators and expert advisors. The program has a simple visual panel and is easy to configure with the mouse. With this program's help, the trader can automatically close positions and delete orders depending on the conditions set. There is often a situation when you need to close position
FREE
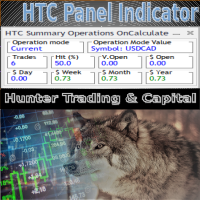
HTC Panel Indicator is an operational summary dashboard for use in conjunction with trading EA.
It provides a concise summary of the current year's trades, open positions and profit history.
The summary can be filtered by the current chart asset, by the ID (magic number) of an EA or by all trades performed in the year.
The panel must be inserted into the chart as an indicator, making it possible to add it to a chart that already has a trading EA.
FREE

A script for opening a grid of orders If you need to quickly open several pending orders on a certain distance from the current price, this script will save you from routine! Allow AutoTrading before running the script. Instructions: Run the script on the chart. This script is a limited version of the market product https://www.mql5.com/en/market/product/635 and allows opening only Buy Stop orders. Input parameters are not required in the script. Parameters such as number of orders, order type,
FREE
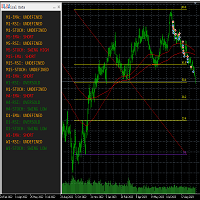
This tool helps to get a quick overview of a market. In one panel, indicators show trend, swing highs/lows and overbought/oversold information of various time frames (M1,M5,M15,H1,H4,D1,W1). Fibonacci can be used to identify different price levels. The input parameters of all indicators can be set by the user. The time frames can be changed as desired. The user can decide for himself which indicators he would like to see in the panel. Fibonacci appears on the chart at the next minute change at t
FREE

Indicator that show candlestick bars with an different sampling method than time fixed. Real time data is sourced to the indicator and it may be used as substitute of the default graph. Each bar is formed when a predefined amount of ticks is received, showing in the graph the OHLC of this clusteri of ticks. The input variable is the amount of ticks of each bar. It's a different approach of sampling, the amount of bars is proportional to the amount of negotiations insted of a sample in a fixed am
FREE

To get access to MT4 version please click here . This is the exact conversion from TradingView: "Candle body size" by "Syamay". This is a light-load processing indicator. This is a non-repaint indicator. Buffers are available for processing in EAs. All input fields are available. You can message in private chat for further changes you need. Thanks for downloading
FREE

This is a rate of change chart from the baseline. features. comparison of max 5 symbols. free baseline with drag. free timeframes of the sub window. reverse chart selectable if you need.
i.e. set symbols "-US100" notes In the sub window, you can't believe datetime on the chart, because the numbers of bars are different. You can check the baseline if you click symbol name. The dragged baseline is temporary. You must set it to indicator's parameter if you need.
FREE
Description This is a utility tool for MT5 reminding traders of all the entry points by highlighting trading history. For those who just started to learn trading, one of the most efficient tips to improve their trading skill is to look back their own trading history. However, trade history arrow shown on MT5 chart is simply too small to find out, which will keep traders away from reviewing their trade, especially stupid mistakes like overtrading. By clearly showing their trade history and face i
FREE

Earlion is an effective grid EA for trading on the AUDCAD, AUDNZD, NZDCAD currency pairs. To open positions, the EA uses data from the BB indicator. The exit is automatic and depends on the current risk. The main EA feature is the ability to minimize the risk of losing a deposit when opening a large number of positions on one currency pair. When the specified number of open positions is reached, Expert looks for an opportunity to close them with minimal losses or no losses at all. Possibiliti
FREE
SaTo EA simple for free. 1. Double MA indicator for Entry signal 2. RSI for trend filter (Uptrend: RSI value greater than RSI level, Downtrend: RSI value less than RSI level ) 3. MACD for trend filter (Uptrend: MACD greater than signal , Downtrend: MACD less signal ) Buy signal : Fast MA greater than Slow MA, RSI value greater than RSI level, MACD greater than signal Sell signal : Fast MA less than Slow MA, RSI value less than RSI level, MACD less signal
FREE
The AllClosedMT5 utility in the form of an expert. The utility is designed for closing all open positions simultaneously based on the total profit (in the deposit currency) of all open positions. The utility can be attached to any chart with any trading instrument.
Parameters Profit - the total positive profit in the deposit currency, at which all open positions are closed (profit). Stop - the total negative profit in the deposit currency, at which all open positions are closed (loss). The val
FREE

You can use this tool to create as many pending orders (limit order) as you want in one button press. All inputs must be in points. You can use this useful tool when such as FED speech times. User Inputs:
MagicNumber = Magic number DeviationPoint = Deviation point number for limit orders Level = You can choise how many level do you want to create pending orders. BuyOrder = true/false SellOrder = true/false StartDistance = Distance between each level. StepDistance = Distance to be added incremen
FREE

Sometimes swaps are hidden for certain financial instruments , hence incurring unprecedented costs over night. The need to uncover hidden swap costs is vital for profitable trading. With that being said, this expert indicator helps the trader to uncover the hidden swap costs.
Features chart objects with text short and long trade swap plug and play
Advantages uncover hidden swaps plug and play, no other configurations are needed to use it. usable on all charts and symbols swaps can be easily
FREE

After purchasing, you can request and receive any two of my products for free!
После покупки вы можете запросить и получить два любых моих продукта бесплатно! The utility is designed for manual placement of pending orders at the high and low of yesterday. The program has a built-in trailing stop, virtual take profit and stop loss. Unworked orders are deleted at the end of the day or manually. You may be interested in my other products: https://www.mql5.com/ru/users/vypchela/seller
Settings
FREE

Non-proprietary study of Joe Dinapoli used for trend analysis. The indicator gives trend signals when the fast line penetrates the slow line. These signals remain intact until another penetration occurs. The signal is confirmed at the close of the period. It is applicable for all timeframes. Parameters Fast EMA: period of the fast moving average. Slow EMA: period of the slow moving average. Signal EMA: period of the signal line. ************************************
FREE

RSI magic kjuta trial is the demo version of RSI magic kjuta.
Custom Indicator (RSI magic kjuta) based on the standard (Relative Strength Index, RSI) with additional settings and functions. The maximum and minimum RSI lines on the chart have been added to the standard RSI line. Now you can visually observe the past highs and lows of RSI, and not only the values of the closing bars, which avoids confusion in the analysis of trades. For example, the EA opened or closed an order, but the RSI l
FREE
MetaTrader platformunun uygulama mağazası olan MetaTrader Mağazadan bir ticaret robotunun nasıl satın alınacağını öğrenin.
MQL5.community ödeme sistemi, PayPal, banka kartları ve popüler ödeme sistemleri aracılığıyla yapılan işlemleri destekler. Daha iyi bir müşteri deneyimi için satın almadan önce ticaret robotunu test etmenizi şiddetle tavsiye ederiz.
Ticaret fırsatlarını kaçırıyorsunuz:
- Ücretsiz ticaret uygulamaları
- İşlem kopyalama için 8.000'den fazla sinyal
- Finansal piyasaları keşfetmek için ekonomik haberler
Kayıt
Giriş yap
Gizlilik ve Veri Koruma Politikasını ve MQL5.com Kullanım Şartlarını kabul edersiniz
Hesabınız yoksa, lütfen kaydolun
MQL5.com web sitesine giriş yapmak için çerezlerin kullanımına izin vermelisiniz.
Lütfen tarayıcınızda gerekli ayarı etkinleştirin, aksi takdirde giriş yapamazsınız.