YouTube'dan Mağaza ile ilgili eğitici videoları izleyin
Bir ticaret robotu veya gösterge nasıl satın alınır?
Uzman Danışmanınızı
sanal sunucuda çalıştırın
sanal sunucuda çalıştırın
Satın almadan önce göstergeyi/ticaret robotunu test edin
Mağazada kazanç sağlamak ister misiniz?
Satış için bir ürün nasıl sunulur?
MetaTrader 4 için ücretli Uzman Danışmanlar ve göstergeler - 207

This indicator is using the Central Limit Theorem in combination with historical volatility and Fibonacci ratios in order to create unique type of chart tool called Projected Volatility Distribution. This tool allows you to perform highly accurate intraday technical analysis where in a split second you can detect overbought and oversold conditions as well as strong trends. In addition you have at your disposal multi-functional panel which shows signals in real time and gives you the ability to o

This trading system is based on criteria of various technical indicators . These include fractals , Alligator and ADX (measuring trend strength with average directional movement index) . This algorithm uses a hedging strategy in the zone of volatility. To explain it: if fractal to buy is above the Alligator's Teeth line, the pending Sell Stop order to open the position should be placed 1 point below the low bar, which formed a fractal. If the fractal to sell is below the Alligator's Teeth line,

The EA works on the Envelopes indicator. When the price exits the channel and returns, orders are opened and then closed at the intersection of the maximum and minimum lines of the indicator. The EA uses two take profits, stop loss, auto lot and other settings that allow you to customize the robot to your needs. We recommend a deposit of 50 USD on a cent account, currency pair GBPUSD, leverage at least 1:500, timeframe H1 (or higher). The EA is able to work on any currency pairs, as well as on s
The strategy is based on RVI oscillation to check the prices trend and direction and check the moving avarages (Open Price and Low Price) to decide about the viability of opening any order. Market is very unpredictable due to economic news published every hour, but our EAs are really prepared for such hostility due to its protections. This Expert Advisor is provided with two kinds of indicators: an oscilator (RVI) in order to check the prices oscillation limit pattern and direction trend; two Mo
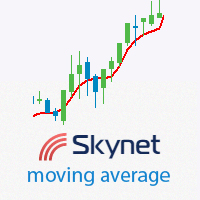
This indicator displays the trend direction, the averaged price value and flat areas. It is used to determine the averaged price value with little or no delay. During a flat, its line is often smooth, and it follows the trend during a descending or an ascending movement. The best charts for the indicator are the range\renko charts, which do not have rounded borders of price changes. Various types of moving averages and certain types of digital filters were used as a prototype. Compared to variou

Background It only needs a small initial deposit. Suitable for multi-currency trading. Immunity to the large delay and the size of the spread. Monitoring of my accounts : https://www.mql5.com/en/signals/author/mizrael
Operation Principle The EA trades within a modifiable channel. Depending on the market situation, the EA works using a long-term, short-term strategy or both. Closing is done by averaging a number of profitable and loss-making orders, regardless of the strategy currently in us

Bu teknik gösterge, grafikteki çeşitli Ters Şamdan Modellerini kullanarak fiyat hareketini otomatik olarak tanımlar ve analiz eder. Ok işaretlerini karşılık gelen kalıp adlarıyla birlikte çizerek en son ters şamdan kalıplarını bulmayı kolaylaştırır. Bu gösterge ile grafik analizini hızlı bir şekilde tanımlayabilir ve önceden tanımlanmış mum modelleriyle karşılaştırabilirsiniz. Gösterge, Dragonfly Doji, Gravestone Doji, Hammer, Pin Bar ve daha fazlası gibi hem basit hem de karmaşık bir dizi u

The Expert Advisor trades using the Stochastic indicator with the specified parameters. A trade is opened at the crossover of the specified levels. The default levels are K = 11, D = 3, Sl = 3. The EA opens a trade when overbought and oversold levels specified by the trader are crossed. Trades are closed by Take Profit levels, which are hidden form the broker. If a wrong direction is chosen, the EA opens an averaging grid of orders. If there is no signal for opening a position by Stochastic indi
The indicator finds price accumulation areas in a specified price range and time interval. By setting time to 10-18:00 and area width to 40 points, the indicator finds the area having the specified width that was most often touched by the candles in this time interval. Until 19:00, the area within the current day can move. With the first tick from 19:00, the main area is fixed and not re-painted. If Continue zone is enabled, the area having another color is set on this level after fixing the mai

An original trading robot for Forex trading. It opens deals in two directions at the same time. When the first order is closed, the EA tries to bring the second one into profit and to close it. If the market price moves against the order, then the EA places a group of orders against the price movement and opens an additional order in proportion to the price movement with a certain coefficient. Orders are closed when the entire grid of orders reaches a total profit. It is recommended to trade cur

Real-time trend, pricing, and volume details in the corner of the current chart. This indicator displays useful trend, pricing, and volume information in the corner of the current chart. With this indicator, you get real-time market trend, pricing (Ask, Bid, spread, Open, High, Low, change from previous bar Close), and volume (current, High, average). After the indicator is executed, you will see this real-time data in the upper right-hand corner of the chart or an alert indicating that an error

Currencies Cleaner panel will give you an overview of all the most traded market's currencies in a single click. First of all the panel will refresh all your charts, opening them four times in all timeframes needed.
1 - CURRENCIES It uses a complex algorithm to study the movement of 17 different indicators. It means that the algorithm not only "reads" the actual value of an indicator, but also creates a probability of success using the position of this value on the indicator and the last movem
DSProFx TrendLine Expert Advisor is a semi-automatic Forex robot that can be used for scalping and day trade as well. It works based on Trend Line.
Concept, Timeframe and Pairs DSProFx TrendLine works in all time frame. Trades will be opened if the market price touch the Trend Line that is set for Buy or Sell based on line name . "B" for Buy order and "S" for Sell order. To open more than 1 orders, for example Buy orders : use "B1", "B2", "B3", etc. The trades will be closed by some options:

This Expert Advisor is designed for effective investment management and medium-term trading. Unlike the Butterfly Platinum version, it uses the Martingale system. If the previous trade was closed at a loss, the next lot will be equal to the last lot multiplied by MultiplierLots. Every trade is protected by stop loss. Only one market order can be opened at a time. It works using pending (Stop, Limit) or market orders depending on the parameters specified. The trailing stop levels can be set in pi

The Expert Advisor is based on the principles of Parabolic SAR indicator and uses the elements of the hedging strategies. This mechanism uses the momentum of trading volatility that works on all the timeframe, day trading and swing trading. If two Parabolic SAR dots are below the price they represent the buy signal, and if the two Parabolic SAR dots are above the price they indicate the sell signal. This algorithm uses a hedging strategy that works with the volatility zone system, which we apply

Openology is a very simple indicator that can show the historical information of the opening price levels. The histogram has in fact the task of showing the history of this value in order to study the conditions of permanence and duration of this very important market condition. The indicator, in separate window, is not intrusive and through its internal customization extremely simple in use. Very important is the possibility to enable or disable a timeframe to show the agreement of study on Ope

Jeneratör Pro ortalamaya dayalı birkaç sanal stratejiden (birden yüzbinlere kadar) oluşan stratejiler oluşturmanıza olanak tanır. Her sanal stratejinin kendi strateji türü (Trend, AntiTrend), sanal para yatırma, sanal pozisyonlar, lotu vardır. EA, tüm sanal stratejilerin işleyişini kontrol eder, tüm işlemleri özetler ve ticaret hesabında ilgili işlemleri yapar. Danışman çalışma modları
Dosya_olmadan - stratejileri olan bir dosya kullanmadan mod. Tüm sanal stratejiler, " JENERATÖR
Power Index Fx is a new generation indicator that allows an intelligent multi Timeframe analysis. The indicator is flexible and completely customizable. Its positioning in separate window makes it unobtrusive and extremely functional. Its formula of calculation makes it a fundamental tool for identifying possible moments of continuation in favor of Trend. Power Index Fx is a professional tool able to increase your operational potential.
Input Values DASHBOARD SETTINGS How many symbols to show

This is an automated Forex Expert Advisor. The system is based on trading in possible flat emergence zones. The EA has a built-in price movement predicting algorithm, which enables the EA to make a decision to open averaging orders or to scale an open position. Depending on parameters, it works with pending (Stop, Limit) or market orders. To diversify risks, the Expert Advisor works simultaneously with short and long positions. Their closure can be either an oppositely directed or unidirectional
If you are using volume spread analysis, this system will give you a lot of help and features in your analytics. Please watch the video to see all the features.
Features Bars without opening price. Easy to read volume indicator. Bar reader (Bar type - Close type - Volume type - Spread type). Daily and weekly levels (Pivot - Camarilla - Fibo). And more
Indicator parameters Number_Of_Bars - Choose the number of bars you want to appear on the chart Bars_WIDTH - Choose the width of Bars, 1-2-3-4

Easy Advisor is a fully automated Expert Advisor that uses martingale. Unprofitable orders are covered by new order with increased volumes. The lot size increases 100 times from the initial to the final value. If the initial lot is Lots_1 = 0.01, then the maximum lot size in a cycle will be equal to 1. The EA uses virtual take profit and stop loss. In case of unsuccessful work, in a single cycle with the initial volume of Lots_1 = 0.01, the loss will be equal to 2000 USD. Increasing the initial

Heiken Ashi Smoothed Strategy is a very simple but powerful system to get forex market trend direction. This indicator is actually 2 indicators in 1 pack, Heiken Ashi and Heiken Ashi Smoothed Moving Average both included. Because HA (Heiken Ashi) and HAS (Heiken Ashi Smoothed) are calculated in the same one system event with necessary buffers and loop only, so it is the FAST, OPTIMIZED and EFFICIENT HA having the combined indicator of MetaTrader 4. You can choose to display HA and HAS in the sam

FutureTrade is one of the few indicators that predicts the price right on the price chart. The indicator calculation algorithm is based on the fast Fourier transform. Given the oscillatory behavior of the price, the Fourier function predicts its future behavior. The indicator should be attached in the usual way to a chart with the trading instrument specified symbol and with the M15 timeframe. This timeframe is the most optimal for working with any symbols. Once started, the indicator calculates

The indicator displays divergence and convergence on all instruments. It works on all timeframes. After finding divergence/convergence, the indicator draws a Buy or a Sell arrow according to the detected signal.
Settings Buy - show buy signals Sell - show sell signals Divergence - show divergence on the chart Convergence - show convergence on the chart KPeriod, DPeriod, Slowing - Stochastic settings drawPriceTrendLines - draw a line (of divergence/covergence) on a price chart drawIndicatorTre

Deposit : from 100 deposit units Trading pairs: I recommend currency pairs: EURAUD, CHFJPY, EURCHF, EURGBP, AUDCHF, CADCHF, USDCHF. Trading period : Any Account:
You should use ECN-ECN.Pro accounts with five-digit quotes with a moderate size (spread). Parameters: USING - Choice, trading risk or fixed lot RISK/LOT - Lot Risk Value RESTORING_THE_BALANCE - Restoring balance* HOW_THE_RESET_WINDOW - Reset the Global Variable TAKE_PROFIT - Set profit STOP_LOSS - Set loss COUNT_BUY - The number of

The script creates a brief daily summary report of the weekly trade in a separate window.
Input parameters of the script number of weeks - set the time interval (the number of weeks) for the report. switch for symbols selection - three modes for selecting the instruments to generate the report: All_Symbols - report is generated for deals of all instruments. Current_Symbols_Only - report is generated only for deals of the instrument in the current window. Without_Current_Symbols - report is gen
Stoch–Cross Scalper is an Expert Advisor based on the Stochastic oscillator indicator using the 80 threshold as overbought and 20 as oversold while utilizing a 14 day rolling period to analyze High and Low closing prices in relation to the current close price. The Stochastic oscillator is a commonly used indicator and many trading philosophies are based upon it. This expert is the result of over ten years of my fine tuning and perfecting this trading system. Almost all of the indicators availabl
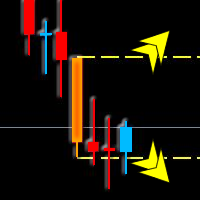
Masters Bars is an indicator that plots a line over High and Low of the last Master Bar. A Master Bar is defined as the decisive candle that exceeds the last decisive candle High-Low range. This helps traders to see if the chances for trend continuation improve or the chances for a trend reversal increase when Masters Bars range is broken. Masters Bars include an Alarm function that produces a sound, or even can send an email and/or push notification depending up what you have configured in your

This is an automated Forex Expert Advisor. The strategy is based on the assumption that the market bounces in the opposite direction several times before the big bids are satisfied. It has a built-in algorithm for predicting the price movement, which allows the EA to make decisions on opening averaging orders or increasing positions. It works using pending (Stop, Limit) or market orders depending on the parameters specified. To diversify the risks, the EA works with short and long positions simu

DIFF-2Pairs detects divergences of correlated pairs considering lots balancing (+ built-in strategy tester ). The indicator has a system for measuring the divergence of correlated pairs by various methods to estimate the value of the differential curve: the system can measure performance. statistical analysis to determine the optimal SL and TP. exporting data to a CSV file. Currently, the indicator supports the following deviations of the correlated pairs: The standard deviation is the measur
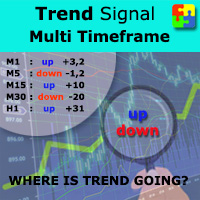
Do you want to always know in a quick glance where price is going? Are you tired of looking back and forth between different timeframes to understand that? This indicator might just be what you were looking for. Trend Signal Multitimeframe shows you if the current price is higher or lower than N. candles ago, on the various timeframes. It also displays how many pips higher or lower current price is compared to N. candles ago. Number N. is customizable The data is shown in a window that you can m

Introduction to EFW Analytics EFW Analytics was designed to accomplish the statement "We trade because there are regularities in the financial market". EFW Analytics is a set of tools designed to maximize your trading performance by capturing the repeating fractal geometry, known as the fifth regularity in the financial market. The functionality of EFW Analytics consists of three parts. Firstly, Equilibrium Fractal Wave Index is an exploratory tool to support your trading logic to choose which r

This EA trades mainly in the London and New York Sessions of the market. Forex Agent A is a day scalper with a bigger stop loss and a smaller take profit. Trades are opened at the first tick of the bar. In case of extended drawdown, take profits are adjusted to exit the market sooner and if at all possibly profitable. The built-in news filter prevents the opening of new trades when important news is upcoming. Entry points are determined exclusively by various indicators. Trade exits determined e

The Relative Strength Index (RSI) was developed by J. Welles Wilder and is a momentum oscillator that identifies overbought and oversold conditions. It is also a popular choice for many traders helping them find entries into the market.
How it Works The simplest way to use the Relative Strength Index is to wait for an overbought or oversold condition and then enter into a trade when the RSI indicates that price is resuming in the dominant direction of the trend. Buy signals : For the first con

Trading volume and volatility change for different currency pairs, depending on the movement of the clock hands. You will be able to trade more efficiently if you know which currency pairs are at the center of attention at one time or another. Timing plays a very big role when trading currencies. The indicator shows the trading sessions of the largest exchanges in the world. The operating time is displayed in the form of a countdown before the opening time and the closing time according to UTC (
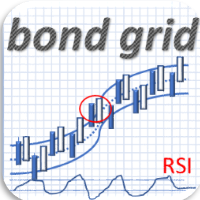
Bond is an Expert Advisor using custom indicators based on candles movements to identify reversal trends and Bollinger Bands. In case of “wrong” entries, the EA uses a grid of orders with increasing lot size (in an exponential way). The grid size is limited for more safety. Attention: this EA cannot be used with other EAs at the same time, for the same symbol and in the same account. This EA is designed to be used with different forex pairs and with some metals, commodities and indices.
Recomm

Manager Trade is a tool that will help you manage trades in an easy and simple way. It is a panel that on its first tab contains buttons and inputs, beautiful and intuitive, that allow you to place operations much faster. In its second tab, all the orders of the account are listed, leaving them available to close each one with a single click of a button.
Main features Place direct and pending orders with a single click, and in the same screen adjust SL, TP and Lots without having to reload the

Speedy Pairs is a robot that open orders based on the acceleration of the price. The strategy is to wait for a certain number of pips is reached within a certain number of seconds, when this condition are met, then the order will be open. Every order has its own tight stop loss, and the profit will be reached with trailing stop. For the backtests shown below, I performed a small optimization of about 15 months (in 2012-2013 ca.), and then I launched the test from 2011 to 2017, with starting capi
This utility is the improved version of Trailing stop for advisors. It manages other EAs' orders as well as the ones opened manually. It is capable of trailing the price (trailing stop function), set a stop loss and take profit if they have not been set before. The Pro version features the ability to set trailing stop based on fractals and points of Parabolic SAR. When configuring the utility for an EA having no trailing stop function, place it to the new window with the same currency pair speci

The objective of the Crypto-Box Indicator is to determine the most efficient entry in trends. . It works for all purposes, standing out in the main cryptocurrencies: BitCoin, LiteCoin, Ethereum and Emercoin. And in Currencies: EURUSD, USDJPY и GBPUSD. The indicator is designed to find the best conditions for financial instruments. Detects acceleration patterns in prices in areas of supports and resistances. The development team is constantly improving the functionality of the Indicator and we th
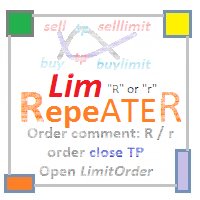
The utility repeats manual BUY, SELL, BUYLIMIT, SELLLIMIT, BUYSTOP and SELLSTOP trades having Comment = "R" or " r" . Instead of trades closed by Take Profit , the utility sets Limit orders with closed trade parameters.
Purpose The program is useful when applying manual grid strategies when a user sets an order grid in a certain price channel having certain parameters and constantly repeats trades after closing them . The program automates repeating trades.
Operation example There is a BUYST

StepUp Martingale EA is a fully automatic Expert Advisor developed for Forex trading. Expert Advisor is suitable for all types of accounts and irrespective of spread. The EA unsupervised during news release and other market condition. Even during interruption of trade due to VPS reset, network issue, etc., the EA will always detect open orders once these conditions are rectified. The EA always uses Take Profit hence it is less sensitive to the speed of a broker. Preferred currency pair is NZDUSD

Box Breakout is an Expert Advisor for level trading. When a flat range is broken, the EA places pending limit buy and sell orders.
Recommendations Currency pair: Any Timeframe: M30,H1 Recommended leverage: 1:10 and higher Minimum deposit: $500 for dollar accounts and $50 (5000 Cent) for cent accounts Before using on a real account, check it in the strategy tester and optimize the parameters for your broker Set the desired risk per trade
Settings and Inputs Risk - risk per trade (as a percent

The Expert Advisor calculates levels for placing pending buy or sell orders on each candlestick. The main task is to open a deal when the market moves, based on the correct calculation of distance for the pending order, which increases the likelihood of entering the market in a favorable period. The Expert Advisor works on all currency pairs and all timeframes, but it was created for EURUSD and the hour timeframe (H1). UseMoneyManagement - enable or disable the money management system. Possible
The Expert Advisor trades using the Stochastic indicator with the specified parameters. A trade is opened at the crossover of the specified levels. The default levels are K = 11, D = 3, Sl = 3. The EA opens a trade when overbought and oversold levels specified by the trader are crossed. Trades are closed by Take Profit levels, which are hidden form the broker. If a wrong direction is chosen, the EA opens an averaging grid of orders.
Expert parameters MAGICB - Long magic number; MAGICS - Short

MyNight Scalper is an automated scalping Expert Advisor that scalps at night, taking advantage of price consolidations during the quiet market. It is composed of eights strategies which are based on price action prediction, overbought/oversold levels determination, momentum and divergence. The EA implements advanced algorithms to verify the signals and find entry/exit points. It can work on multiple currency pairs simultaneously and always uses stop loss orders for protecting your account. No ma

Bu gösterge, W.D. Gann'ın dokuzun karesi ve 144'ün karesine bağlı olarak yazdığı "Piyasa tahminleri için matematiksel formül" makalesine dayanan bir piyasa analiz yöntemidir.
Kullanım kılavuzu:
Add Your review And contact us to get it
Tam MT5 Sürümünü Şunlardan Satın Alabilirsiniz:
https://www.mql5.com/en/market/product/28669
MT4'te ücretsiz olarak test edebilirsiniz:
https://www.mql5.com/en/market/product/15320?source=Site +Profile+Seller#!tab=reviews
Bu ürün sizin için
This indicator is a mathematical expression of the rate of price movement over time. Overbought and oversold market states comprise the basic concepts of the oscillator. The market is considered to be overbought when the indicator line is near its upper limit. In the oversold state, the indicator line is near the lower limit. The indicator also takes into account the crossover of lines. It notifies the user by displaying a dialog box, sending an email or push notifications to mobile terminals.

New opportunities for analyzing cryptocurrency in the usual MetaTrader 4. For example : We select the symbol of the cryptocurrency and attach any indicators, Expert Advisors or scripts.
Startup Mode View cryptocurrency; Data collection.
Capabilities Work as with a standard currency chart; Automatic update of open charts; Selection of individual cryptocurrency for updating; Selection of individual timeframes for updating; Work on the desired timeframes; Open charts do not affect the work of C

This utility records the swap, which allows you to monitor and analyze the changes in the swap. The program writes a file with the swap data for every pair selected in the Market Watch. The data are recorded to a csv file at the specified time, the file is located in <terminal root directory>/MQL4/Files. File format: Date Day Time Currency pair Long-swap Short-swap 16.01.2018 Mon 23:30 EURNOK -34.81 27.14 16.01.2018 Mon 23:30 EURDKK -0.022 -0.032 16.01.2018 Mon 23:30 EURGBP -2.38 0.15 To start r

Pivot Bro teknik göstergesi , Pivot, Fibonacci, ATR ve ADR seviyelerini kullanarak düzeltme alanlarını belirlemek için tasarlanmış güçlü bir araçtır. Fiyat eylemine dayalı ters şamdan modellerini de tanıyarak bunun ötesine geçer. Ek olarak, Para Birimi Ölçer , büyük para birimlerinin gerçek gücünü değerlendirmek için değerli bir yol arkadaşıdır. 28 döviz çiftini analiz ederek ve güçlerini renk değişimleri ile grafik üzerinde göstererek, tüccarların giriş ve çıkış noktalarında b

Sign of victory is a new indicator based on three digital filters. The indicator plots three histograms in a separate window, and also draws an arrow on the price chart. Each histogram is a digital filter that converts quotes and decomposes them into trends: buy or sell. The examples of market entries using this indicator are shown on the screenshots using arrows. This indicator can help traders better assess the market situation.
Sign of victory features The indicator is perfect for scalping

I present you an Expert Advisor based on the Martingale system. The trading volume used for opening positions depends on the parameters Lot and Multiplier. Martingale system, which proportionally increases the trade volume according to set parameters, is applied when you open a trade. Please note that the EA features the ability to select the trading direction: Buy or Sell.
Recommendations: Currency pair: any; Timeframe: the EA is optimized for Н1, but any timeframe can be used. Other: the tra

This Supply & Demand indicator uses a unique price action detection to calculate and measures the supply & demand area. The indicator will ensure the area are fresh and have a significant low risk zone. Our Supply Demand indicator delivers functionality previously unavailable on any trading platform.
Trading idea You may set pending orders along the supply & demand area. You may enter a trade directly upon price hit the specific area (after a rejection confirmed).
Input parameters Signal - S
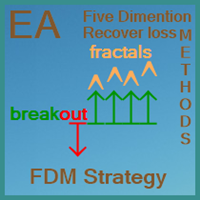
FDM Strategy is an Expert Advisor based on fractals and five dimension method. Five Dimensions expert system is developed based on a theory combining the Chaos Theory with the trading psychology and the effects that each has on the market movement. There is also an ADX (measuring trend strength with average directional movement index) used as a trading filter. Long and Short Trade Signals: If fractal to buy is above the Alligator's Teeth (red line), the pending Sell Stop order must be placed 1 p

IRobot Alligators is an Expert Advisor based on the chaos theory and the Alligator technical indicator. This expert advisor consists of three lines, overlaid on a price chart, that represent the jaw, the teeth and the lips of the Alligator. It was designed to help confirm that a trend is in effect and in what direction. As with all moving averages, the shortest one (green) moves first, followed by the middle (red) and then longer average (blue). If the three lines are entwined, then the Alligato
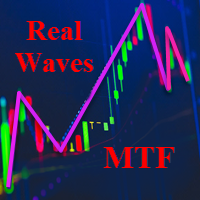
The indicator shows the real waves of four (selectable) timeframes on the current chart, displaying the wave structure of the market. The indicator is able to monitor the formation of waves in real time. It informs the trader when the wave of the current or higher timeframe is completely formed. It visualizes waves starting from the current timeframe and higher. Convenient and customizable visualization of the wave structure of the market. When using this indicator, there is no need to manually

This indicator shows main trend, entry zone and exit zone. This is a muti-timeframe indicator, so it is always repainting in the current period of the higher timeframe.
Features Colorful Histogram: it indicates the main trend, the tomato means the market is bearish,and the sky blue means the market is bullish. Inner Blue Bands: it is entry zone for entry market, the market is relatively safe for entry. Outer Yellow Bands: it is exit zone for exit market, the market is oversold or overbought.

Renko Chart — opens renko charts for MetaTrader 4. Renko charts can be created using this utility with all bars being in the form of Renko "bricks". All bars on the renko chart are the same size, which can be changed to get the desired chart. You can add indicators, EAs and scripts to the resulting chart. You get the completely operational chart which can be processed just like a regular one. The Renko Chart utility is not only history based, but also builds online. At the same time, the data is

Pin-Bar Trader is a fully automatic Expert Advisor designed for trading Price Action candlestick patterns - Pin bars.
Key advantages of the EA Simple and intuitive trading system. When you understand the way the EA works, you can easily monitor and customize it. Trading on the higher timeframes: the Pin bar trading strategy is intended for the timeframes H1, H4 and Daily. A strict use of Stop Loss orders to protect the capital from significant losses. The Expert Advisor does not use martingale

The Discrete wavelet transform indicator is an enhanced implementation of the numerical and functional analysis for MetaTrader 4, the discrete wavelet transform method (DWT). The specific feature of DWT is the way the wavelet is represented in the form of a discrete signal (sample). DWT is widely used for filtering and preliminary processing of data, for analyzing the state and making forecasts for the stock and currency markets, for recognizing patterns, processing and synthesizing various sign

This is an Expert Advisor with the elements of graphics trading. It performs trading operations using the "Rectangle" (or "Square") shape. The Expert Advisor automatically draws a square and opens a Buy or Sell orders when the price crosses its lower or upper bounds respectively. The shape can be drawn manually. For this purpose you should disable the auto drawing feature in the Expert Advisor settings. If the price moves in the wrong direction, the Expert Advisor sets up to four orders in accor

The indicator shows possible reversal points. It is based on several candlestick patterns + an oscillator. The indicator is easy to use: install it and watch arrows. Sell when a red arrow appears and buy when a blue arrow appears. If you set the Alert option in the indicator parameters to True, the indicator will show an alert window with information about the currency pair, on which the signal has formed. ALERT = True/False; Attention ! It is not the Holy Grail for trading, errors may happen.

The system applies Fibo levels. Apart from basic Fibo levels (23.6; 38.2; 50.0; 61.8; 100.0;), the EA features custom levels (34.0; 36.0; 64.0; 66.0;). You can decide the levels trading is to be performed from. Sample trade: when the market is bullish and the price rolls back to the levels (as we remember, we select the levels on our own), the EA opens buy orders. The opposite is true for sell orders. The EA can work in three modes. Each of the modes is a separate Fibo levels construction method

The StarBot utility works with open Sell and Buy orders, partially closes profit when the specified level is passed. There are three levels for partially closing the Sell and Buy orders. The utility also transfers Stop Loss to breakeven when the specified level is passed. It works on all currency pairs and timeframes. Demo version for testing can be downloaded at: https://www.mql5.com/en/market/product/27247
Input parameters Follow the orders - manage all orders, or select from Sell and Buy. A

DYJ Sharp advanced algorithm that detects new trends and current trend continuations for use as an entry and exit strategy. The strategy display the SHARP trend demarcation area. This SHARP area has high HighLine and low LowLine. Falling of high below HighLine of SHARP and then falling of close below LowLine of SHARP can be interpreted as a signal to sell. Rising of close above HighLine of SHARP and then rising of low above LowLine of SHARP can be interpreted as a signal to buy. The signal for e

Basic Pending Scalper is a basic system for easy use, you just have to place the system on your platform and load the .set files that we include in our signals. The system opens one or two pending orders, if the predefined conditions are appropriate, the orders will be canceled in case that in the predetermined time of the order is not activated, in case the orders are activated, the operations will be closed by the closing dynamic, Take Profit or Stop Loss. The system works when the volatility

This simple to use utility allows opening charts from the list of financial instruments by left clicking their names. The chart window is opened using the Default template. The template name can be changed to one of those stored in Charts-Templates section of the terminal. It is possible to customize the background colors of panels and their labels, and also to select the display type for a more comfortable working environment. This is all you need to know in order to see the result quickly.
P

The Expert Advisor has a signal filter consisting of two parameters, which evaluates the overbought and oversold states of a financial instrument. It is possible to configure all essential parameters for buy and sell trades separately or to disable one of the directions for a greater flexibility in trading. To complete the EA operation correctly, the "Stop EA" button is provided. Once pressed, it raises the flag to prevent opening orders on new signals. Averaging with certain limitations is used

This indicator shows the current market situation relative to the price volatility channel, its external and internal boundaries, displays the last direction of the price movement. The main purpose of the indicator is to identify the trend movement and its boundaries. With a wide channel, it can be used for determining the initial price movement waves. It works on any instrument and any time frame of the chart. It works in 2 different modes: The first mode shows any changes in the channel when t
MetaTrader Mağaza, geliştiricilerin ticaret uygulamalarını satabilecekleri basit ve kullanışlı bir sitedir.
Ürününüzü yayınlamanıza yardımcı olacağız ve size Mağaza için ürününüzün açıklamasını nasıl hazırlayacağınızı anlatacağız. Mağazadaki tüm uygulamalar şifreleme korumalıdır ve yalnızca alıcının bilgisayarında çalıştırılabilir. İllegal kopyalama yapılamaz.
Ticaret fırsatlarını kaçırıyorsunuz:
- Ücretsiz ticaret uygulamaları
- İşlem kopyalama için 8.000'den fazla sinyal
- Finansal piyasaları keşfetmek için ekonomik haberler
Kayıt
Giriş yap
Gizlilik ve Veri Koruma Politikasını ve MQL5.com Kullanım Şartlarını kabul edersiniz
Hesabınız yoksa, lütfen kaydolun
MQL5.com web sitesine giriş yapmak için çerezlerin kullanımına izin vermelisiniz.
Lütfen tarayıcınızda gerekli ayarı etkinleştirin, aksi takdirde giriş yapamazsınız.