 MetaTrader 5
 Uzmanlar
 Göstergeler
 Kütüphaneler
 Yardımcı programlar
 Widget'lar
 Kurallar
YouTube'dan Mağaza ile ilgili öğretici videoları izleyin
Bir alım-satım robotu veya gösterge nasıl satın alınır?
Uzman Danışmanınızı
sanal sunucuda çalıştırın
sanal sunucuda çalıştırın
Satın almadan önce göstergeyi/alım-satım robotunu test edin
Mağazada kazanç sağlamak ister misiniz?
Satış için bir ürün nasıl sunulur?
MetaTrader 4 için yeni Uzman Danışmanlar ve Göstergeler - 201
 Alım-satım robotları piyasalarda otomatik olarak işlem yapar, göstergeler ise fiyatları analiz etmek ve fiyat değişikliklerindeki kalıpları belirlemek için kullanılır.
Bu alım-satım uygulamalarıyla, MetaTrader 4'te daha bilinçli alım-satım işlemleri gerçekleştirecek ve daha fazla alım-satım fırsatı yakalayacaksınız.

Cryptosecurency - Kriptopara ticareti için tam otomatik trend danışmanıdır. Danışman, artan volatilite anlarında impulslu yönde işleme girer. Impuls, fiyatın belirli bir zaman diliminde yüzde değişimi veya Bollinger bantlarına dayalı yerleşik göstergelere göre belirlenebilir. Trendin gücünü ölçmek için ADX göstergesi kullanılabilir. İşlemler Stop Loss/Take Profit ile kapatılır. Yüksek spread ve komisyonlu brokerlerde danışman kullanılması önerilmez. Kullanım yöntemlerinden biri, MT5'te demo hesa
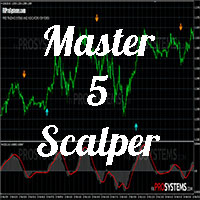
Merhaba tüccarlar, özellikle de yüzücüler bu sefer, 5 dakikalık bir zaman diliminde scalpers için özel bir gösterge tanıtıyorum
Bu göstergenin, anlaşılması kolay bir scalper göstergesi arama konusunda kafası karışmış yeni başlayanlar için yardımcı olması bekleniyor.
tamam devam et
Bu gösterge yalnızca 5 dakikalık bir zaman diliminde çalışır Bu gösterge ayrıca ticaret platformunuza MQID girerek tüccarlara mobil aracılığıyla bildirim sağlayabilir.
Bu gösterge, değiştirilmiş stokastik osilatör

MT5 Version MA Ribbon MT4 MA Ribbon is an enhanced indicator with 8 moving averages of increasing periods. MA Ribbon is useful to recognize trend direction, reversals and continuation points in the market as well as potential entry, partial take profit and exit points. Entry points for long and shorts position can be found when the price entries or leaves the Ribbon, at retest or a defined number of MA crossovers. It offers a good combination with mostly any volume or momentun indicators to f

The technical indicator, in real time, searches for candlesticks that exceed the size set in the settings and gives signals about them. As a rule, such abnormally large candles appear either at the beginning of strong impulses or at the end of a directional price movement. At the beginning of the pulse, the signal can serve as a basis for searching for an entry point, at the end of the movement, it is a sign of a climax and may indicate the near end of the trend. The reference size for filtering
FREE
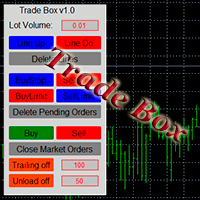
A small trading panel makes it easier for a trader to visually place pending orders, market, as well as trailing and unloading the grid of orders.
It is installed as a regular adviser. Parameters and description:
Lot Volume: 100 - in this field you can set, change the order volume at any time
Line UP - visual horizontal level for pending BuyStop and SellLimit orders
Line DN - visual horizontal level for BuyLimit and SellStop pending orders
Delete Lines - delete all lines from t
FREE

MT5 Version Most indicators draw lines.
This one draws the battlefield. If you ever bought an EA or indicator based on a perfect equity curve — and then watched it bleed out live — you’re not alone.
The problem? Static logic in a dynamic market. Fibonacci Bollinger Bands adapts.
It combines Bollinger structure with customizable Fibonacci levels to mark zones of control — where price reacts, pauses, or reverses. No magic. Just logic that follows volatility. Why this tool matters It shows yo
FREE

Odyssey is a global trend indicator. If you do not yet have your own trading strategy, you can use our ready-made trading strategy. This is a hybrid trend indicator, as it is based on the signals of several internal algorithms. The indicator also uses the oscillator algorithm in recalculations. The indicator also calculates the oversold and overbought levels of a trading instrument. Thus, having all the necessary information, the indicator generates signals when the trend changes.
Despite the

Anand is a forex trend arrow indicator for identifying potential entry points. I like it, first of all, because it has a simple mechanism of work, adaptation to all time periods and trading tactics. It indicates a short-term and long-term trend. operations. The simplest way to use the indicator is to open a trade in the direction of an existing trend. The indicator allows you to study the real and historical market trends in more detail!
Determining the market trend is an important task for tr

The main application of the Rwanda indicator is to generate buy and sell signals. Displays the Rwanda indicator signals on the price function chart using a mathematical approach. The indicator determines the long-term and short-term trend. The best result is given by the combination of the indicator with fundamental news, it can act as a news filter, that is, it can show how the market reacts to this or that news.
With this indicator, you can predict future values. The indicator is designed to

One of the main definitions for monitoring the currency market is a trend, which is why the Citizen indicator was created in order to display the trend in a visual form. You should use the indicator as an additional indicator, that is, you need to use this indicator for example to perfectly display price movements! Its signals are based on a reliable algorithm. When used simultaneously on multiple timeframes, this indicator truly "makes the trend your friend". With it, you can follow trends on m

The main purpose of the Deathly indicator is to evaluate the market. Red dots indicate that the priority should be to open SELL positions. The blue color indicates that it is time for BUY trades. Using the indicator is very convenient and easy. The indicator is universal. It is applied at any time intervals. You can use the indicator to trade different assets. The tool is perfect for Forex trading. It is actively used for trading in commodity, commodity and stock markets.
The indicator impleme

The Andhadhun trend step indicator will give you stability if you follow his signals. And you will be able to distinguish between work and the emotional component. It basically uses the process of identifying the rate of change in price growth and allows you to find entry and exit points from the market. Just look at the screenshots and you will determine the principles of working with the indicator yourself.
The indicator analyzes the state of the market, the phase of its movement and largely

A fundamental technical indicator that allows you to assess the current market situation in order to enter the market of the selected currency pair in a trend and with minimal risk.
Many beginners who first enter the market often have better luck than a professional who has spent years learning. The reason for this phenomenon is the unconscious entry of beginners into the trend, when even without any indicators it becomes clear where the market is moving.
The Apartment indicator basically us

The Man Exclusivet Expert Advisor can be run on any timeframe, on any currency pair, and on any broker's server. Unique trading system! The expert system works with ticks using sharp tick movements. For the internal algorithm, the elementary unit of analysis is a tick. It is recommended to work on liquid Forex pairs with a low spread and use VPS. You can start using it with $ 100 and 0.01 lot. It is also worth noting that with an acceptable spread level, the bot goes through any historical p

The intelligent algorithm of the Godfather indicator accurately determines the trend, filters out market noise and generates entry and exit levels. The indicator will help in finding entry points when analyzing the price chart. The program first receives a "snapshot" of the graph, then analyzes it. The results are reported to the trader in the form of signals. The main purpose of this indicator is to determine the moments of entries and exits from transactions, so the indicator displays only th

With the help of the Elephant Forex indicator algorithm, you can quickly understand what kind of trend is currently developing in the market. The indicator indicates on the chart the main trend at the current moment in the market. A change in direction, in terms of market fundamentals, means a shift in trading interest towards sellers or buyers.
If you do not take into account speculative throws, which as a result do not affect the overall trend, then the moment of a real “reversal” is always

The advantage of working on the Special Agent signal indicator is that the trader does not need to independently conduct a technical analysis of the chart. Determining the market trend is an important task for traders, and the tool gives ready-made signals in the form of directional arrows. This tool is an arrow (signal).
Special Agent is a trend indicator, a technical analysis tool that helps to determine the exact direction of the trend: either up or down price movement for a trading pair of

Indicator that shows you at any time the current number of closed deals as well as profit and loss totals of the closed deals of the account that you're logged into for a configurable period.
To do this, it is best to load "Complete history" in the account history in the terminal and then enter the desired period in the indicator (e.g. 2022.01.01-2023.01.01 would be for calendar year 2022).
Input options:
- Period (Attention: corresponding data must be loaded into the account history of the
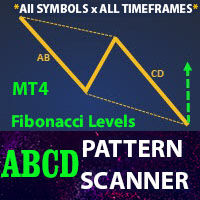
** All Symbols x All Timeframes scan just by pressing scanner button ** *** Contact me to send you instruction and add you in "ABCD scanner group" for sharing or seeing experiences with other users. Introduction This indicator scans AB=CD retracement patterns in all charts. The ABCD is the basic foundation for all harmonic patterns and highly repetitive with a high success rate . The ABCD Scanner indicator is a scanner reversal ABCD pattern that helps you identify when the price is about to ch

Features:
- Moving Average Slope for Max Past Bars - Slope Period - Slope Thresholds - Multiple Slope Type options - See slope visually as a histogram - Info Panel Show/Hide Slope Calculations and Types:
The slope value is calculated using the Slope Period. Suppose Period is 5, it will check the MA value for bar (x) and bar (x+5). And find the slope angle between them.
Read detailed description about Slope Types and Settings here: https://www.mql5.com/en/blogs/post/747651
FREE

Layering — Build Profit in Measured Steps
Layering helps you grow and protect a position by placing additional trades at equal, defined distances as the market moves. It's a structured layering approach designed to secure the account and bank profit as each take-profit is reached.
What it does for you Measured layering: trades are added at equal distances you define — no guesswork. Account protection built in: the layering logic is designed to secure your account as it works. Profit-locking: a
FREE

Gartley Hunter - An indicator for searching for harmonic patterns (Gartley patterns) and their projections. The indicator is equipped with a system of alerts and push notifications. Manual (Be sure to read before purchasing) | Version for MT5 Advantages
1. 12 harmonic patterns: 7 classical and 5 exotic. New patterns will be added as the indicator develops. 2. Constant automatic search for harmonic patterns. The indicator is capable of finding from the smallest to the largest patterns. 3. Automa

It will perfectly complement your working Expert Advisor or manual trading with up-to-date information.
There is a sound notification of exceeding the established profit and loss limits of open SELL and BUY orders.
Moreover, for each currency pair EURUSD, GBPUSD, XAUUSD, and others, various sound alerts are activated in English. Results are displayed on a special panel on the chart from the moment the indicator is activated: Elapsed time Fixed profit
Current profit SELL
Current profit BUY
Maximu

This strategy is best used for Scalping and Binary Options. Strategy: There are 3 EMAs: Faster, Medium and Slower. When Price is Trending, wait for Price to bounce an EMA and scalp at each bounce. Features: - Check if 3 MAs are Stacked - Check Price Bounce Off MAs (Faster, Medium, Slower) - Min Distance Between Faster and Medium MA Filter - Max Distance Between Entry Price and Faster MA Filter - High Volume Check - Heiken Trend Check - Volatility Check - Higher/Lower Timeframes MA Stacked check

The Bridge indicator displays potential entry points on the chart as signals (points of absolute trend reversal).
The Bridge forex indicator algorithm was created on the basis of the original indicators for searching for extremes, the indicator is well suited for determining a reversal or a large sharp jerk to one side, thanks to it you will know when this happens, it will notify you with the appearance of a blue dot to buy red to sell. The indicator, according to a certain algorithm, qualifie

Factor EA is a fully automated scalping strategy expert advisor that runs on the M1 timeframe. Advisor settings are based on a safe trading strategy, the essence of which is to close the transaction, upon reaching a positive dynamism of profitability of several points, which allows the user to reduce the cost of opening losing trades. The EA is multifunctional and does not require a certain type of account for normal functioning. The EA’s mechanism of work is arranged so that before opening a
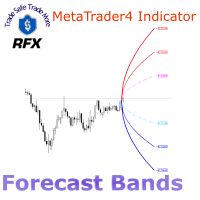
The RFX Forecast Bands indicator calculates the three significant confidence levels, 99%, 95% and 68% of price movement for a configurable number of bars in the future. The essence of calculations is based on statistical analysis of the asset's recent price changes. These levels can be used for many different purposes in trading systems. For example, one can use them for setting the target profit and stop loss levels effectively. The extreme upper and lower bands represent 99% confidence level,

Ilan Universal is an automatic advisor (trading robot) used for trading in all financial markets. It is in demand among beginners and experienced traders due to such advantages as the exact execution of the trading rules of the chosen strategy, the reduction in the number of subjective errors, and the release of the user's time. The recommended deposit is $10,000. The great value of this algorithm is the possibility of optimizing by opening prices and correctness after such optimization of w

The Qv² Halifax - Indicator developed through a complex series of calculations, which aims to easily identify buylng and selling signals.
Buy signal are indicated by up arrows.
Sell signal are indicated by down arrows.
An important detail: In order to make the indicator work, the timeframes M1, M5. M15. M30, H1 D1 must be all updated.
It can be used on all pairs (I use it on Gold).
it is a very good deal in the trending market
To learn more about my work click here

A smart, next-generation Analyst STD robot. Taking into account all imaginable pitfalls when testing and working in real mode. The bot can be optimized by opening prices, and work on all ticks without problems. The bot has two versions, it can successfully work both on mt4 and mt5, both on netting and hedging accounts. For those who bought one of the versions of the bot, the second one will be half price. The EA handles errors correctly and works reliably on the market. The EA uses the followin
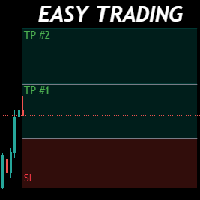
Money Management will help you to Easy Trade with One Click , instance and pending, set SL, and manage number of your TP . You can use this expert for different currency pairs, CFDs, cryptocurrency, and stocks .
The basic formula for calculating pip value and position size which has been used in this expert are:
Pipette Value = Position Size * (Exchange Rate (Base Currency) / Entry Price) * Contract Size * Digits Exp. Account Currency: USD Currency Pair: GBPJPY Position Size: 0.05 Lot = 5000
FREE
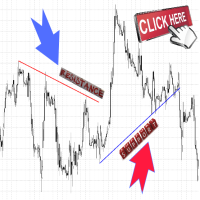
Готов продать исходный код, за подробностями обращайтесь в личные сообщения.
Индикатор чертит горизонтальные линии поддержки и сопротивления,наклонные линии поддержки и сопротивления,треугольники.Работает на любых инструментах и таймфреймах.
Данный индикатор можно использовать в торговле ориентируясь на отбой и пробой уровней, а так же для ориентиров выставления стоп лоссов.
Индикатор не удаляет уровни , они остаются на истории графика , что очень удобно для анализа его работы.
Для удобств

We are proud to present our newest expert advisor developed by our trading specialists and programmers who found the most probable price levels the istitutional firms , banks , hedge funds and other large companies place their orders . The expert advisor is preset to launch a grid order system at those special levels , using a built-in smart algorithm to detect those leveles . The expert can also be used when important news are about to come out , because it can pe programmed to launch the

NEW : integration with Ofir Signals to send personalized alerts Ofir Notify is a tool which send alerts on trades to Telegram Alert on any event concerning a position : Opening, Closing, modification (SL, TP) Send alerts to Chats, Groups and Channel Alert on Equity change Display Risk, Reward and progress of profit/lost for each position Customization of alerts Sending charts screenshots with alerts Send signals from your indicators or experts Multi-lingual NEW : version 2 brings integratio
FREE

NEW : integration with Ofir Signals to send personalized alerts Ofir Notify is a tool which send alerts on trades to Telegram Alert on any event concerning a position : Opening, Closing, modification (SL, TP) Send alerts to Chats, Groups and Channel Alert on Equity change Display Risk, Reward and progress of profit/lost for each position Customization of alerts Sending charts screenshots with alerts Send signals from your indicators or experts Daily, weekly and monthly summaries Reply mode:
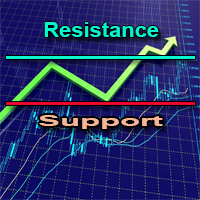
Индикатор уровней поддержки и сопротивления отлично показывает на графике все силовые уровни от всех таймфреймов. Рекомендую торговать уровни старших таймфреймов. Индикатор на текущем таймфрейме обновляться как только на графике появится новый сетап The indicator of support and resistance levels perfectly shows all power levels from all timeframes on the chart. I recommend trading higher timeframe levels. The indicator on the current timeframe is updated as soon as a new setup appears on the
FREE

If you like this project, leave a 5 star review. Often times we are using brokers that are outside of the GMT-0 timezone, this
not only complicates things, but, it can make seeing when a trading session starts
a bit more difficult than it should. This indicator allows you to set a timezone offset it will draw a vertical line for the: Day. Week. Month. Quarter. year.
FREE

Просдка и прибыль зависят от Greed_Size = от 1 до 1000 1% = самый безопасный, будет раньше выходить из позииции при 100% = расчет лота будет максимальный при 200% = максимальный удвоеный, выход из позиции также будет передерживать Символ XAUUSD (Gold (Spot)) Период 1 Минута (M1) 2022.01.10 01:05 - 2022.01.21 23:54 (2022.01.08 - 2022.01.24)
Баров в истории 9896 Смоделировано тиков 629527 Качество моделирования 25.00% Ошибки рассогласования графиков 0 Начальный депозит 10000.00 Спред 10 Чи

This expert advisor optimized especially for XAU USD or GOLD. You can also use it other currencies and insturments. Optimized parameters for M5 time frame in XAU USD, ecn broker, low spread and low commission. Other successful results can be found M15 , H1 and H4 timframes with different settings. I will add other timeframe settings later. * Before the strategy test, ensure that the data in your platform's history is reliable.
Индикатор Powerful trend indicator превосходно показывает текущую тенденцию. Индикатор Powerful trend indicator не перерисовывает не меняет свои значения. Советую пользоваться тремя периодами индикатора для фильтра сигналов. The Powerful trend indicator perfectly shows the current trend. The Powerful trend indicator does not redraw or change its values. I advise you to use three periods of the indicator to filter signals.

This strategy uses a slower RSI with period 14 to sell when the RSI increases over the value of 55 (or to buy when the value falls below 45), with the classic Bollinger Bands strategy to sell when the price is above the upper Bollinger Band and falls below it (and to buy when the price is below the lower band and rises above it). This strategy only triggers when both the RSI and the Bollinger Bands indicators are at the same time in the described overbought or oversold condition. In addition th

Индикатор превосходно показывает экстремумы цены. Для торговли по данному индикатору рекомендую торговать по сигналам старших таймфреймов. Индикатор не перерисовывается и не меняет значения в истории. The indicator perfectly shows price extremes. To trade on this indicator, I recommend trading on the signals of the higher timeframes. The indicator does not redraw and does not change the values in the history.

Индикатор уровней поддержки и сопротивления. Не перерисовывается и не меняет свои значения при переключении таймфреймов. С индикатором можно работать как на пробой уровней так и на отбой уровней поддержки и сопротивления Indicator of support and resistance levels. It does not redraw and does not change its values when switching timeframes. With the indicator, you can work both on the breakdown of levels and on the rebound of support and resistance levels

Индикатор Супер МА является трендовым индикатором и отлично справляется определением текущей тенденции. Ею можно пользоваться как для скальпинга так и для торговли внутри дня. Сигналы индикатора не перерисовываются и не меняют свои значения после закрытия бара The Super MA indicator is a trend indicator and does an excellent job of determining the current trend. It can be used both for scalping and for intraday trading. The indicator signals do not redraw and do not change their values after
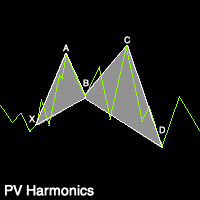
PV Harmonics - Paints harmonic triangles and patterns on live charts to show current live harmonic patterns. - Paints arrows on charts over the harmonic patterns to signal prime entry and exit points. - Extremely fast and versatile indicator. - Highly accurate. - Non repainting. (Does not repaint entry/exit signals) - Comes with numerous customization settings.
Индикатор объёмов отличный помощник в трейдинге. Индикатор не перерисовывается и не меняет значения при переключении таймфреймов. Индикатор объёмов MTF, показывает текущую тенденцию на графиках. Рекомендую торговать в сторону сигналов старших таймфреймов The volume indicator is a great assistant in trading. The indicator does not redraw and does not change values when switching timeframes. MTF volume indicator, shows the current trend on the charts. I recommend trading in the direction of highe

This is a new strategy for SUPPLY DEMAND areas It is based on a calculation using the tick volume to detect the big price action in market for both bear /bull actions this smart volume action candles are used to determine the supply and demand areas prices in between main supply and demand lines indicate sideway market up arrows will be shown when prices moves above the main supply and the secondary supply lines Down arrows will be shown when prices moves below the main demand and the secondary
ZigZag предназначается для анализа движений цен с заданной амплитудой. Индикатор изображает только самые важные развороты, что значительно облегчает оценку графиков. Стрелки показывают БАР, на котором последний Low/High полностью сформирован. ZigZag is designed to analyze price movements with a given amplitude. The indicator shows only the most important reversals, which greatly facilitates the evaluation of charts. The arrows show the BAR where the last Low/High is fully formed.
FxGold Marathon BreakOut is a simple but effective trading system based on breaking out price parttern. EA is a long term stable growth trading system with realistic result . EA designed for XAUUSD (GOLD) which is a volatile and highly liquid commodity Features: Account protection by acceptable consecutive loss. Auto MM Don't need fast VPS just laptop or pc and stable internet connection, you can shut down at the weekend then start it up before market opening like i'm doing. All opened positi

торговая система с риском 1% чем больше денег на счете тем больше лот но риск 1%
Начальный депозит 50.00 Спред 10 Чистая прибыль 6.71 Общая прибыль 51.97 Общий убыток -45.26 Прибыльность 1.15 Матожидание выигрыша 0.02 Абсолютная просадка 26.79 Максимальная просадка 29.21 (55.47%) Относительная просадка 55.47% (29.21) Всего сделок 427 Короткие позиции (% выигравших) 219 (72.60%) Длинные позиции (% выигравших) 208 (72.12%) Прибыльные сделки (% от всех) 309 (72.37%) Убыточные сделки (% от все

Торговый советник по пробойной стратегии с использованием мартингейла. Vik Plan B Like - это укороченная версия советника Vik Plan B, с минимальными настройками. Для входа в сделку использует свечной анализ. Входные параметры: StartHour - старт торговли StopHour - стоп торговли FixLot - фиксированный лот UseMartin_Mini - вкл/откл мартин Kol_ord - ограничение количества ордеров Step - шаг мартина MuitiLots - множитель лота для мартина MaxLot - ограничение лота для мартина UseCloseAllP

Индикатор Super Ma Arrows состоит из модифицированной средней скользящей и стрелок. Индикатор предназначен для скальпинга. Индикатор Super Ma Arrows не перерисовывает не меняет значения при переключении таймфреймов The Super Ma Arrows indicator consists of a modified moving average and arrows. The indicator is designed for scalping. The Super Ma Arrows indicator does not redraw does not change values when switching timeframes

Hello traders nice scalping tool
this indicator design for find best point to enter market in all time frame
indicator no repaint , no redraw , no lagging very accurate indicator just test it in strategy tester and see yourself !
you can use it for any pairs and indices CFD base of this indicator is cci so you can change period of it in input taps of indicator but default is optimized before ! good luck
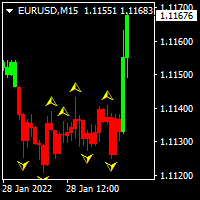
This indicator helps you to build position and profit when market turns in your favor. You will build your full position by trading many small position. If there is green colored candle on the chart, you could add long position. If there is red colored candle on the chart, you could add short position. I personally spread my full size position in to 5-10 small position. I use small target of 2-5 pips on eurusd pair.
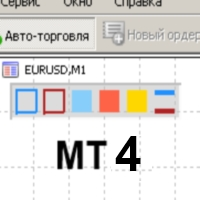
Color Levels - удобный инструмент для тех, кто использует технический анализ с использованием таких инструментов, как Трендовая линия и Прямоугольник. Имеется возможность настройки двух пустых прямоугольников, трех закрашенных и двух трендовых линий. Настройки индикатора крайне просты и делятся на пронумерованные блоки: С цифрами 1 и 2 вначале - настройки пустых прямоугольников (рамок); С цифрами 3, 4 и 5 - настройки закрашенных прямоугольников; С цифрами 6 и 7 - настройки трендовых линий. Объе

Этот индикатор имеет универсальный алгоритм торговли, который основан на импульсе цены . Все максимально упрощено - только сигналы на Buy и Sell . Есть оповещения, чтобы не пропустить открытие позиции.
Не требует оптимизации и дополнительных настроек!
Для любых типов инструментов: валюты, нефть, металлы, криптовалюты. Для любых таймфреймов: от M1 до D1 . Для любых стилей торговли: скальпинг, интрадэй, свинг, долгосрок . Если Вам необходима дополнительная информация или есть вопросы по
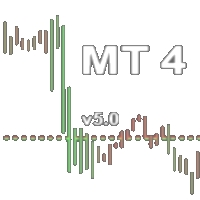
Индикатор закрашивает бары по цвету, выбор цвета ведется из расчета торгового объема валютного инструмента. вертикальную линию есть возможность перемещать для изучения на исторических данных горизонтальные линии отвечают за максимальный и минимальный бар зеленый большой объем красный маленький объем настройки: выбор ширины окраски бара выбор количество баров для расчета
Есть возможность доработать индивидуально: вывод звуковых сигналов вывод сообщения в телеграмм комбинировать с другим индикат

The indicator (Current Strength) is represented in a separate window by Blue and Pink histogram . The parameter NPeriod represents the number of bars on which we calculate the variation of forces, the recommended value is 5. The Blue histogram measures the buyers force , while the Pink histogram measures the sellers force . The change in color signifies the change in strength which leads t he price . Each drop (especially below 52.8) after touching levels 96.3 or 1.236 must be condidered

"Optopus GBPJPY is a great choice for hands-off investors who plan to do a long-term investment in GBPJPY"
#Non-Martingale #Always SL #Robust #Adaptive #Fully Automated #AI #GBPJPY
We are a team of experienced traders, software developers and data scientists.
Optopus GBPJPY is a non-martingale expert adviser generated from our AI-driven pipeline which learns diversified trading strategies from 10-years historical data of the GBPJPY market.
Optopus GBPJPY project aims to provide a robust ada
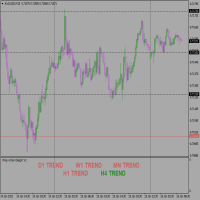
This is a price action traders delight, Too much of Indicators are bad on the chart so also to much of analysis can cause analysis paralysis. No need for Top down analysis, The EA does that for you based on Monthly, Weekly, Daily, And 4hrs trend readings on same window. Supports all time frame trading. Make your trading seem less and takes it to the next level. Its new and first of its kind with 5yrs development process. Just work with the colors ( Green for Bullish Market and Red for Bearish)
This indicator helps to trade in the right direction of the market, by knowing the bias of the market. If you are a swing trader this is the best indicator for you. You will just see the bias on the top right of your chart/screen. You can sometime wait for reversals then continue with the trend/bias. Indicator is based on moving averages and showing daily bias of the market. KEEP IN MIND THAT THE BIAS IS STRICTLY SHOWING THE DAILY TIMEFRAME TREND ONLY.
You can check the video attached.

Níveis de suporte ou resistência formados quando a ação do preço de um mercado reverte e muda de direção, deixando para trás um pico ou vale (ponto de oscilação) no mercado. Os níveis de suporte e resistência podem criar faixas de negociação. O indicador identifica High e Low com base no Período.
Características principais Um conceito chave da análise técnica é que quando um nível de resistência ou suporte é quebrado, seu papel é invertido. Se o preço cair abaixo de um nível de suporte, esse n

Fiyat Eylemi Ticaret Paneli MT4 , belirtilen (varsayılan olarak) geçmiş mumların saf fiyat eylemi verilerine dayalı olarak herhangi bir simgenin/enstrümanın alım/satım gücü seviyesi dengesini hesaplar. Bu, gösterge panelinde bulunan 32 sembol/aletin fiyat hareketini izleyerek size mümkün olan en yakın piyasa duyarlılığını verecektir. %60'ın üzerinde bir alım/satım gücü seviyesi, belirli bir sembolü satın almak/satmak için (varsayılan ayarları kullanarak) oldukça sağlam bir seviye sağlar. Fiyat
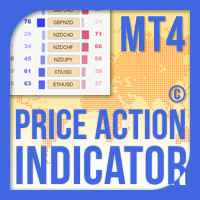
Fiyat Eylem Göstergesi MT4 , herhangi bir sembol/enstrümanın alım/satım gücü seviyesi dengesini, belirtilen (varsayılan olarak 8) geçmiş mumların saf fiyat eylemi verilerine dayanarak hesaplar. Bu, gösterge panelinde bulunan 32 sembol/aletin fiyat hareketini izleyerek size mümkün olan en yakın piyasa duyarlılığını verecektir. %60'ın üzerinde bir alım/satım gücü seviyesi, belirli bir sembolü satın almak/satmak için (varsayılan ayarları kullanarak) oldukça sağlam bir seviye sağlar. Fiyat Hareketi

Çalışma simgesi XAUUSD Çalışma zaman aralığı: M1 Minimum depozito: $100 Minimum kaldıraç 1:20 Özellikler:
Martingale, ızgara, hedge veya diğer tehlikeli para yönetimi yöntemleri kullanılmaz Stop loss çok sıkıdır ve kar maksimal uzun pip'lerle trailing stop ile, trailing stop henüz hazır değilse karı zamanlayıcı ile kapatır Broker koşullarına çok duyarlı değildir, ancak altın spreadi ne kadar düşük olursa o kadar iyidir Kurulumu kolaydır FIFO uyumlu FTMO için uygun Ayarlar:
Lot adımı - Otomati

İndirim robotu. Mevduattaki para sıfır civarında dönerken bir çok işlem yapılır ve bir indirim biriktirilir.Depozito yüklemez, zararı durdur kar al vardır ki bu da günlük grafikte açıkça trend olan bir durumdur. Uzun geri dönüşlerde robot kaybeder, ancak çok yavaş ve nispeten güvenli bir şekilde gerçekleşir, bu nedenle trendi günde en az bir kez izlemeniz ve günlük grafikte bir geri dönüş belirtileri varsa onu kapatmanız önerilir. Ticaretin yönünün bir göstergesi olarak, zarflar robota dikilir.
The Tick Indicator is a very powerful tool for scalping. It shows you the up and down movement in the market. That way you can identify the direction much faster. The indicator is very easy to install and can be used on all time frames and all pairs forex, bitcoin ..... Simply install the file in the indicator folder of your MT4 terminal, refresh or restart the terminal and drag it on to the chart you want to trade. The best way is to look out for crossovers and then enter.

Promo Discount 50 % From $ 499 to $ 250 , limited time offer, get yours copy right now! SouthEast is an expert advisor developed from my experience in manual trading that has been automated. SouthEast is specifically designed to generate maximum profits with small deposits by prioritizing the security of your funds. Why SouthEast?
SouthEast does not require complicated settings and is easy to use because user only need to upload a set file that is already available. Currently there are set fi
Volatility under control. The indicator shows the optimal depth for setting goals within the day and on the average trend. It also builds pivot zones for the estimated correction depth. As an accompaniment, the key levels of the structure are displayed for several timeframes. Classical volatility indicators ATR & ADX on fixed timeframes are used for calculation. The calculation takes into account the spread, and if the market is slightly volatile, you will see a warning about the risk. You can c
FREE
ABSOLUTELY DO NOT REPAINT, 100% GUARANTEED!!
With this indicator you will be able to identify the trend of the financial pairs in which it is loaded. By means of a graph of arrows that definitely do NOT repaint, this indicator shows you where the current trend is going.
It also has the plus that you can view the trend in the different time periods (as you can see in the screenshots) in a top bar where you can see the different time periods in green (bullish) or red (bearish) depending on the c
MetaTrader Mağazası, geliştiricilerin alım-satım uygulamalarını satabilecekleri basit ve kullanışlı bir sitedir.
Ürününüzü yayınlamanıza yardımcı olacağız ve size Mağaza için ürününüzün açıklamasını nasıl hazırlayacağınızı anlatacağız. Mağazadaki tüm uygulamalar şifreleme korumalıdır ve yalnızca alıcının bilgisayarında çalıştırılabilir. İllegal kopyalama yapılamaz.

Alım-satım fırsatlarını kaçırıyorsunuz:
- Ücretsiz alım-satım uygulamaları
- İşlem kopyalama için 8.000'den fazla sinyal
- Finansal piyasaları keşfetmek için ekonomik haberler
Kayıt
Giriş yap
Web sitesi politikasını ve kullanım şartlarını kabul edersiniz
Hesabınız yoksa, lütfen kaydolun