YouTube'dan Mağaza ile ilgili eğitici videoları izleyin
Bir alım-satım robotu veya gösterge nasıl satın alınır?
Uzman Danışmanınızı
sanal sunucuda çalıştırın
sanal sunucuda çalıştırın
Satın almadan önce göstergeyi/alım-satım robotunu test edin
Mağazada kazanç sağlamak ister misiniz?
Satış için bir ürün nasıl sunulur?
MetaTrader 4 için yeni teknik göstergeler - 72

Non-repaint indicator to identify trade opportunities in swing action as prices move within an upper and lower band. Inspired by the Keltner Channel, the most popular channel Indicator introduced by Chester Keltner. It is different with a Bollinger Bands. It represents volatility using the high and low prices, while Bollinger's studies rely on the standard deviation. Customized by adding the trends exactly in the middle line, arrows when price cross over the outer lines and Fibonacci Levels L
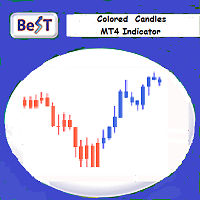
BeST_Colored Candles is an MT4 FREE indicator that can change the color of the Candlesticks based on the MACD, SAR or RSI values and levels. It is a Composite indicator that by selection uses the values each one of these 3 indicators and their critical levels in order to create numerical relationships that when satisfied cause their corresponding candlesticks coloration.
Input parameters
== Basic Settings
-- Please Select Indicator - for selecting which one of the above 3 indicators
FREE
According to the law of nature which states that everything is a vibration, I have built this measurement model and which detects the best frequencies in the movement of the price, so just adjust the frequency in the input parameter of the candlestick watcher how are they arranged on the level lines (support/resistance). Lists of good frequencies : 236, 369,417,528, 618,741,963,1236,1484.
You can also search for the frequency that suits your asset! just use the parameter: frequency
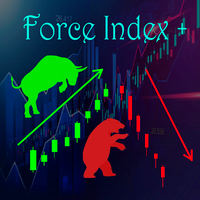
Данный помощник в торговле основан на индикаторе Force Index, хороший осцилятор для скальпинга в периоде H1, входы в сделки указаны стрелками, выходы соответственно можете определять самостоятельно, к примеру можете воспользоваться стандартным индикатором Stochastic. Данный индикатор работает только в периоде H1! В настройках при желании можете изменить цвета и период. На основе этого индикатора пишется робот, желающему пишите в лс.
Ortalama Günlük Aralık, belirli sayıda periyot üzerinden ölçülen bir Forex çiftinin ortalama pip aralığını gösterir. Yatırımcılar, ortalama günlük hareketin dışındaki potansiyel fiyat hareketini görselleştirmek için ADR'yi kullanabilir. ADR ortalamanın üzerinde olduğunda, günlük oynaklığın normalden daha yüksek olduğu anlamına gelir, bu da döviz çiftinin normunun ötesine geçebileceği anlamına gelir.
ADR Analizörümüz 5 ana özellikten oluşmaktadır: Aralık ( ADR ) Screener: Çoklu para birimi ADR

HERKES İÇİN BİR GÖSTERGE Pip Scalper è per le tendenze dello scalping. Rimani nelle tendenze più a lungo con questo indicatore. Funziona su tutti i tempi e le risorse. Raccogli pip giornalieri con questo strumento. Usa la media mobile 200 per filtrare le operazioni. Si consigliano tempi più brevi. Utilizzare per il day trading.
Informazioni e modalità di utilizzo:
Pips Scalper si basa sul trend trading a lungo termine. Acquista in blu Vendi su Rosso Usa 200 medie mobili come filtro e fai tr

A trend indicator showing the strength of bulls and bears in a trading range.
Consists of two lines:
The green line is a balanced overbought/oversold condition. The red line is the direction of trading activity. Does not redraw calculations.
Can be used on all Symbols/Instruments/Time Frames.
Easy to use and set up.
How to use the indicator and what it determines.
The basic rule is to follow the direction of the red line:
if it crosses the green line from the bottom up, the market is dominat
FREE

Reversal Point Detector (RPD) is an advanced indicator that is obtained from a combination of advanced mathematical functions, especially price action, which is able to detect price reversal points, or in other words, invisible market supports or resistances without the use of any tools.
This indicator can identify the appropriate trading opportunities on its own and each person can trade by setting the appropriate SL and TP according to their trading strategy and risk management.
This advance

PullbackMatrix provides the key information of the trading transactions when it finds the right market moment based on its built-in logic algorithm. The high accuracy signals including Trading Symbol, Entry Price, Entry Time, TakeProfit, Stoploss, and more. And that's all will be available instantly in your chart panel, drawing the position lines and also sending signal notification to email, mobile phone, and screen popup. More important is that also saves signals into a .csv file which is usef
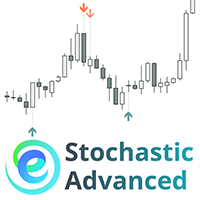
The " Stochastic Advanced " indicator displays the signals of the 'Stochastic" indicator directly on the chart without the presence of the indicator itself at the bottom of the screen. The indicator signals can be displayed not only on the current timeframe, but also on a timeframe one level higher. In addition, we have implemented a filter system based on the Moving Average indicator.
Manual (Be sure to read before purchasing) | Version for MT5 Advantages
1. Displaying the signals of the "Stoch

Description of ZiqScalping The ZiqScalping indicator is designed to trade both currencies with high volatility and trend-oriented currencies.
Recommended time frame for scalping: М5, М15, М30.
Recommended timeframe for intraday trading and above: H1, D1.
Works on all pairs!
Settings : See screenshots.
Decision principle!
The indicator is based on 2MA, MACDI,OSMA. Arrows with trend directions and 2MA lines are shown graphically.
Calculations of volumes by positions are entered into the fo
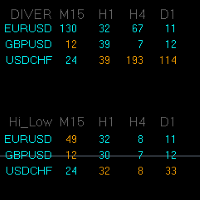
The logical continuation of the divergence indicator is the Divergence HiLo Dashboard indicator - a divergence scanner immediately for three currency pairs. In the indicator menu, select which currency pairs we will analyze. The analysis is carried out on the timeframes M15, H1, H4, D1. In addition to divergences, tops and bottoms are analyzed. All data is entered into tables Alerts are provided in the indicator. According to the logic of the indicator, the signal appears after the end of 3 bars
Trade with super Support and Resistance Breakout system.
are you looking for the most sophisticated tools for your daily trading ? this tools are perfect for you, it has a most comprehensive breakout identification spot on all market (Forex, CFD, indice, etc)
Limited offer : 10 copy for 30$
Indicator parameter: Depth: to arrange how deep to calculates the support and resistance zone Deviation Back-step
the demonstration result you can see on the media file below.

RaysFX Supertrend + Alert RaysFX Supertrend è un indicatore di tendenza superiore progettato per i trader che desiderano avere un vantaggio nel mercato. Questo indicatore utilizza una combinazione di CCI (Commodity Channel Index) e ATR (Average True Range) per identificare le tendenze del mercato e fornire segnali di trading accurati. Caratteristiche principali Indicatori CCI e ATR: Utilizza due degli indicatori più popolari e affidabili per identificare le tendenze del mercato e generare segnal
FREE
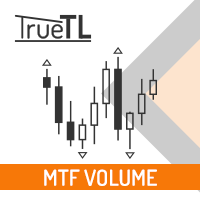
Highly configurable Volume indicator.
Features: Highly customizable alert functions (at levels, crosses, direction changes via email, push, sound, popup) Multi timeframe ability Color customization (at levels, crosses, direction changes) Linear interpolation and histogram mode options Works on strategy tester in multi timeframe mode (at weekend without ticks also) Parameters:
Volume Timeframe: You can set the lower/higher timeframes for Volume. Volume Bar Shift: you can set the offset of the l
FREE
This is a key indicator and guideline for institutions and pension plans that look to take large positions and need to know whether they are getting in at a good price or not. It also allows them to get into positions without disrupting the market or elevating prices unnaturally with their large orders, resulting in unfavorable entry prices for them. The VWAP is a major level of importance that a lot of big traders and institutions monitor and is why you should be paying attention to it too. Ba
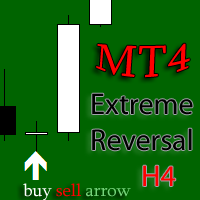
Версия индикатора под Meta Trader 4 ! Этот стрелочный индикатор ищет возможные развороты рынка и коррекционные движения на таймфреймах H4 и D1 . Основан на закономерностях рынка FOREX, точных определениях текущего экстремума и нахождения свечных моделей на вершинах/низах рынка. Универсальный алгоритм помогает определить точки разворота указывая стрелками где осуществить вход в рынок. Настройка индикатора очень проста! Переместите на график выбранной валютной пары и следите за появлением сигн

Trade Assistant MetaTrader indicator — a multi-timeframe indicator that is based on three standard indicators: Stochastic oscillator , RSI (Relative Strength Index), and CCI (Commodity Channel Index). It displays current trend directions for M1, M5, M15, M30, H1, H4, D1, W1, and MN1 timeframes. When you follow such an indicator you have a clear picture of the trends across all important timeframes. It doesn't matter which timeframe you attach this indicator to. The indicator can be d

Watch how indicator works here; https://www.youtube.com/watch?v=3rfwzWgU6Rk CURRENTLY 50% OFF !! will only be available for first 10 DROP A COMMENT WHEN YOU PURCHASE THE INDICATOR SO I CAN ADD YOU TO THE TELGRAM GROUP Best Solution for any Newbie or Expert Trader! This indicator have been made affordable and easy to interact with, it is precise and direct to use. IT IS NONE REPAINT INDICATOR THAT CAN SEND NOTIFICATION TO YOUR PHONE
PLEASE IF YOU PURCHASE THIS INDICATOR YOU WILL BE ADDED TO A TE

Supertrend indicator uses a combination of a moving average and average true range to detect the trend of a trading instrument.
Supertrend indicator for MetaTrader 5 easily shows the trend as a line following the price.
USAGE THIS INDICATOR If the closing prices are above Supertrend Line, there is a Bullish sentiment at that moment. The opposite is a Bearish sentiment. Three green lines - Strong Bullish sentiment. Three red lines - Bearish sentiment.
For BUY : - Three green lines and price

Heiken Ashi candle chart is an improved version of The Japanese candle chart, which can effectively filter the market "noise" of the Japanese candle chart. It is favored by many traders for its simplicity and intuition. For trend traders, the HA candle chart is a magic tool. Unlike the traditional Japanese candle chart, Heikenashi does not reflect the opening price, high price, low price and closing price of the market. Instead, Heikenashi calculates the value of a single K line in the dominant

Piyasanın iki temel ilkesine dayanan bir gün içi stratejisi. Algoritma, ek filtreler kullanarak hacimlerin ve fiyat dalgalarının analizine dayanmaktadır. Göstergenin akıllı algoritması, yalnızca iki piyasa faktörü bir araya geldiğinde bir sinyal verir. Gösterge, daha yüksek zaman çerçevesinin verilerini kullanarak M1 grafiğinde belirli bir aralıktaki dalgaları hesaplar. Ve dalgayı doğrulamak için gösterge, hacme göre analizi kullanır. Bu gösterge hazır bir ticaret sistemidir. Bir tüccarın ihtiya
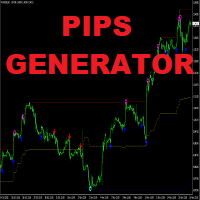
Apollo Pips Generator , trend yönünde sinyaller veren göstergedir. Gösterge, birden fazla giriş noktası sağlar, böylece her zaman kâr etmek için bir ticaret fırsatı bulabilirsiniz. Ekran görüntülerine dikkat edin. Ekran görüntüleri, Pips Generator aracını, kanal tarafından üstleri ve altları gösteren yıldız sinyalleriyle temsil edilen diğer aracımla birlikte gösterir. Bu kombinasyon, sistemi nasıl uygulayabileceğiniz konusunda size birçok yol sunar. Satın aldıktan sonra İKİNCİ GÖSTERGEMİ ÜCRETSİ

Dünyada üç ana döviz piyasası vardır:
New York (Amerika seansı), Londra (Avrupa seansı) ve Tokyo (Asya seansı).
Forex piyasasında işlem yapmak için en iyi zaman, ana işlem piyasasının çakıştığı zamandır. Tipik olarak, çoğu tüccar bu ticaret oturumlarına katılır, bu da daha yüksek likiditeye ve yatırımcıların ticaret yaptığı döviz çiftleri arasındaki farkın daha az olmasına yol açar. Bu zaman dilimlerini seçin. ticaret ve para kazanmak daha kolaydır.
Piyasaların ne zaman çakıştığını anlamanız

Lehmer ortalaması, ağırlık katsayıları hesaplamada kullanılan değişkenlerin değerlerine bağlı olan bir pencere işlevi olarak düşünülebilir. Bu ortalama doğrusal değildir, çünkü hesaplamasında üs alma kullanılır. Göstergenin özellikleri iki parametreye bağlıdır: iPeriod - gösterge dönemi, geçerli değer 2'ye eşit veya daha büyük; iPower - gösterge değerleri hesaplanırken kullanılan üs. Geçerli aralık: -32768 - 32767
iPower = 0 ile harmonik ortalamayı elde ederiz, iPower = 1 ile - aritmetik ortal

KT Higher High Lower Low, aşağıdaki salınım noktalarını ve bunlara karşılık gelen destek/direnç seviyelerini işaretler: Higher High: Önceki yüksek seviyeden daha yüksek bir salınım tepe noktası. Lower High: Önceki yüksek seviyeden daha düşük bir salınım tepe noktası. Lower Low: Önceki düşük seviyeden daha düşük bir salınım dip noktası. Higher Low: Önceki düşük seviyeden daha yüksek bir salınım dip noktası.
Özellikler Salınım yüksekliği ve düşüklüğünün yoğunluğu, sol ve sağ çubuk sayısı değiş
[ MT5 Version ]
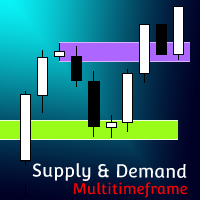
Supply and Demand Multitimeframe Supply and Demand Multitimeframe is the first indicator in the market that combines multiple aspects like trading volume, price structure and momentum to identify Supply and Demand zones for every asset. The Supply and Demand indicator analyzes simultaneously up to 4 different TFs and represents their information in the current graph. Its interactive UI highlights everytime the price enters a Supply or Demand zone even if the zones are not visibl

Full automatic. Does not require technical settings.
Works on all currency pairs. The indicator has a built-in zigzag filter that limits repetitions of unidirectional signals (i.e. after a buy signal, the next one will be a sell signal, and vice versa).
For the convenience of displaying, the indicator provides settings for the type of icons, their color and size: Size Arrow Code Arrow Buy Color Arrow Buy Code Arrow Sell Color Arrow Sell Indicator signals are not redrawn.

Def ault settings are just for visu alis ation, it c an not be profit able with it.
Get a Free EA as a Bonus when you Purchase the Indicator! Plus, Receive 4 Interesting Additional Indicators. Recommended set files for backtesting the indicator on recommended pairs are available in the comments section (last page). Please note that this product is exclusively sold on the MQL5 market. Any other sources offering it are scams, and the author bears no responsibility. To receive the bonus gifts,
Become a constantly profitable 5-star forex trader!
We offer a few indicators to support you understand and analyse the market! With our strategies you will improve your trading system and bacome an expert...
We have indicators for trend direction, market direction and others.. for multi-time frames and that covers all majors or your favorite trading symbols! Some of them offer a customizable calculation parameters... or Graph features!
See how powerful they are! The are also easy-to-use tr
FREE
Become a constantly profitable 5-star forex trader!
We offer a few indicators to support you understand and analyse the market! With our strategies you will improve your trading system and bacome an expert...
We have indicators for trend direction, market direction and others.. for multi-time frames and that covers all majors or your favorite trading symbols! Some of them offer a customizable calculation parameters... or Graph features!
See how powerful they are! The are also easy-to-use tr
Become a constantly profitable 5-star forex trader!
We offer a few indicators to support you understand and analyse the market! With our strategies you will improve your trading system and bacome an expert...
We have indicators for trend direction, market direction and others.. for multi-time frames and that covers all majors or your favorite trading symbols! Some of them offer a customizable calculation parameters... or Graph features!
See how powerful they are! The are also easy-to-use t
Become a constantly profitable 5-star forex trader!
We offer a few indicators to support you understand and analyse the market! With our strategies you will improve your trading system and bacome an expert...
We have indicators for trend direction, market direction and others.. for multi-time frames and that covers all majors or your favorite trading symbols! Some of them offer a customizable calculation parameters... or Graph features!
See how powerful they are! The are also easy-to-use tr

Round Numbers Levels indicator for MT4 Round Numbers indicator is a simple but useful indicator to draw 00 and 50 price levels in your chart.
These levels act as supports and resistances, and therefore should be taken into account when trading.
These levels can be used as profit targets or entry points.
Inputs of the indicator are:
TGridColor00: color to be used for xx00 levels GridStyle00: line style to be used for xx00 levels GridWidth00: line width to be used for xx00 levels GridColor50:
FREE
This indicator is a powerful assistant that shows bullish/bearish zones on the chart and the candlestick patterns that happen on any timeframe. It shows zones based on changes in price and 25 defined patterns which are shown as bullish or bearish on the chart after close of the candle, so there is no repaint. Also, you can select other timeframes in order to see the patterns happening on them. Patterns There are 25 defined patterns in this indicator. Eight patterns can be bullish or bearish, 8 p
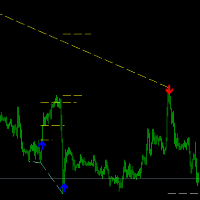
Stock! Now there is a special price for the first 10 buyers. Hurry up. Divergence HiLo is an indicator that identifies highs and lows prices (High end Low) . Based on a special algorithm, the indicator determines the value of divergence or convergence. In addition to divergence or convergence values, the indicator determines the expected take levels profit. The price chart shows divergence lines, possible profit levels and arrows that indicate the formed signal of the indicator in buy or sell.

Hareket kolaylığı, bir varlığın fiyatındaki değişim oranı ile hacmi arasındaki ilişkiyi gösteren bir momentum göstergesidir. Günlük grafik ve daha büyük zaman dilimleri için tasarlanmıştır.
Adından da anlaşılacağı gibi, göstergenin büyüklüğü ne kadar büyükse - fiyattaki hareket ne kadar "kolaysa" - eğilimin o kadar sağlam olduğuna inanılır.
Daha büyük bir pozitif değer, orantısız bir şekilde düşük hacimde fiyatın yukarı doğru hareket ettiğini gösterir. Tersine, daha büyük bir negatif değer, o
Candlestick Patterns Finder is an indicator designed to automate and simplify chart analysis. It is perfect for both beginners who want to learn about the market and its mechanics, as well as advanced users who want to automate certain processes. It searches for both current and past formations, additionally notifying the user about the pattern found through three available methods, e.g. alerts (great for multiple charts running). Recognizes 24 patterns divided into bullish, bearish and neutral
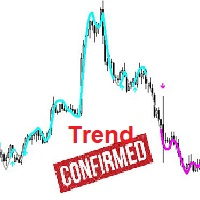
Introducing the Trend Confirmation Indicator: Your Gateway to Confident Forex Trading.
The Trend Confirmation Indicator is a powerful MetaTrader 4 tool meticulously designed to simplify trend identification and streamline entry point selection in the forex market. Built upon customized Moving Average principles, this intuitive indicator offers traders an unparalleled advantage in navigating currency trading with precision and confidence.
Key Features: 1. Customized Moving Average: The Trend Co
This indicator gives entry signals in trend direction and also trend direction there is tow mode of signals for tow type of trading 1 - swing trading 2- scalping On scalping mode signals have small stop loss and big R/R On swing mode can be waited more for TP or SL . Non-Repaint Indicator suitable for all currency and all time frame Detect UpTrend , DownTrend and SideTrend (Possibility of Changing Trend) There is tow mode for signals (Scalp Mode , Swing Mode) Pop up alert , email , Push not

its not just an Indicator. its a trading system I'm working on for 3 years and also would be updated you don't need any thing else to trade because its a price action indicator that shows all static and dynamic support and resistance this indicator contains 7 lines that gives us dynamic static support and resistance also when main lines (white ones) become flat for 26-52 periods they show strong levels. you can find consolidating areas, strong downtrend(in Green channel) and strong uptrend(in

** All Symbols x All Time frames scan just by pressing scanner button ** *** Contact me to send you instruction and add you in "Divergence group" for sharing or seeing experiences with other users. Introduction MACD divergence is a main technique used to determine trend reversing when it’s time to sell or buy because prices are likely to drop or pick in the charts. The MACD Divergence indicator can help you locate the top and bottom of the market. This indicator finds Regular divergence for pul
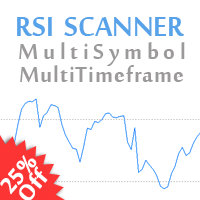
25% off. Original price: $40 RSI Scanner is a multi symbol multi timeframe RSI dashboard that monitors Relative Strength Index indicator for price entering and exiting overbought and oversold in up to 28 symbols and 9 timeframes.
Download Demo here (Scans only M1 and M5) Settings description here MT5 version here
RSI Scanner features: Signals RSI entering and exiting the overbought and oversold zones. Monitors 28 customizable instruments and 9 timeframes at the same time. You can choose

Trend easy простой трендовый индикатор в виде гистограмы. окно индикатора разделено на две части верхняя гистограма движение в бай, нижняя гистограма движениие в сел. Кроме гистограмы, сигнал индикатора дублируется на графике стрелками. В меню индикатора имеется количество баров в истории индикатора
значения периода для определения тренда разрешение рисования стрелок на графике код и цвета стрелок алерты и отступ стрелок
FREE
Your attention is invited to the indicator Price Action Indicators. It doesn't need settings. And also it is not tied to more than one indicator, which makes it not vulnerable to different accounts or brokers.
Add one setting PERIOD
Regards, Mikhail
Вашему вниманию предлагается индикатор Price Action Indicators. Ему не нужны настройки. А также он не привязан не к одному индикатору, что делает его не уязвимым перед разными счетами или брокерами.
С Уважением Михаил
FREE
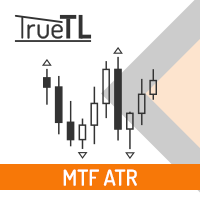
Highly configurable Average True Range (ATR) indicator.
Features: Highly customizable alert functions (at levels, crosses, direction changes via email, push, sound, popup) Multi timeframe ability Color customization (at levels, crosses, direction changes) Linear interpolation and histogram mode options Works on strategy tester in multi timeframe mode (at weekend without ticks also) Adjustable Levels Parameters:
ATR Timeframe: You can set the lower/higher timeframes for ATR. ATR Bar Shift: you
FREE
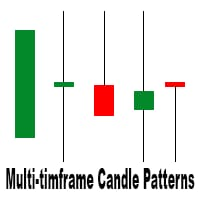
This is a multi-timeframe candle patterns indicator. It scans the chart for Hammer , Engulfing candle , Doji candle and Three white soldiers / black crows setups.
FEATURES: Main panel showing timeframe s from M5 - W1, last signal and last signal time of the selected candle pattern. You can switch between the timeframes by clicking on them. A panel with buttons to switch from one candle pattern to another on the main panel. Arrows to help you locate the candle pattern. A scale showing you what ca

The Awesome Oscillator (AO) is one of the most popular indicators that are used to measure momentum in the stock and commodity markets. It was developed by Bill Williams, a famous charting enthusiast and technical analyst who approached the markets on a psychological level. In this article, we will detail the calculations used to compile the Awesome Oscillator to then move on to applying the indicator in practice. We are also going to look at how the AO is different from other oscillators, as we
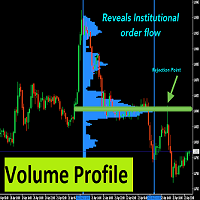
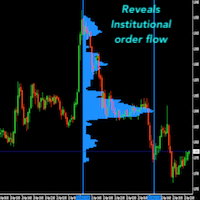
With Fixed Range Volume Profile,The traces left by the big players will not go unnoticed by you.
Professional Volume Profile Indicator reveals Institutional order flow. This advanced market indicator will teach you to spot the buying and selling. Dont want to say more because its well known by most professionals trader. This Indicator : - Quickly Identify the Strongest Institutional S/R Zones. - W orks with all Trading Instruments (Forex, Futures, Indexes, Commodities, Stocks, Cryptocur

Ortalama geri dönüş ticareti için profesyonel ve nicel bir yaklaşım uygulayan benzersiz gösterge. Fiyatın tahmin edilebilir ve ölçülebilir bir şekilde ortalamaya döndüğü ve yön değiştirdiği gerçeğinden yararlanır, bu da nicel olmayan ticaret stratejilerinden büyük ölçüde daha iyi performans gösteren net giriş ve çıkış kurallarına izin verir. [ Installation Guide | Update Guide | Troubleshooting | FAQ | All Products ]
Ticaret sinyallerini temizle Ticaret yapmak inanılmaz derecede kolay Özelleşt

Kolmogorov-Zhurbenko filtresi, spektral sızıntıyı ortadan kaldırmak için tasarlanmış özel bir pencere işlevi olarak düşünülebilir. Bu filtre, stokastik (finansal dahil) zaman serilerini yumuşatmak için idealdir. Bu filtreye dayalı gösterge aşağıdaki parametreleri içerir: iLength - filtreyi oluşturmak için kullanılan orijinal dikdörtgen pencerenin süresi. Geçerli değer 2 - 255'tir. iDegree - filtre sırası. iDegree=0 ise, basit bir hareketli ortalama elde edilecektir. iDegree=1 ise, üçgen hareket

İkili GURU, ikili opsiyon ticareti ve 18:02 PM'de (+3 GMT) gün içi ticaret için %75+ doğruluğa sahip bir göstergedir. Gösterge yeniden çizilmez ve okumalarını değiştirmez. İkili GURU, fiyatın geri dönüş yapacağı yerleri belirlemek için tasarlanmıştır. Gösterge, kullanım verimliliğini artırmanıza olanak tanıyan hem trend dönüşlerini hem de geri dönüşleri yakalar. Göstergeyi kullanırken, analiz olanakları önemli ölçüde genişletilir, yalnızca düzeltme ve geri dönüş yerleri grafikte açıkça görülmekl

Yeni bir trendin başlangıcının ERKEN belirlenmesinin göstergesi.
Ek olarak, gösterge, trendin küresel yönünü nokta sayısına göre belirler: daha fazla yeşil nokta varsa (parametre küresel trendin hesaplanması) - trend yukarı; daha fazla kırmızı nokta varsa, trend aşağıdır. Gösterge ilk mumda yeniden çizilmez.
Gösterge, bağımsız bir ticaret sistemi olarak ve diğer herhangi bir ticaret sistemine ek olarak kullanılabilir.
Gösterge, herhangi bir ticaret enstrümanında ve herhangi bir zaman dilimin

The "Easy Ichimoku Wave Meter" indicator is a basic tool to automatically determine Waves according to Ichimoku!
The indicator gives the possibility to simultaneously apply the Wave Theory, Time Theory and Target Price Theory according to the "Little Ichimoku" strategy developed by Sense Hosoda on the MT4 platform. The use of this tool allows not only novice traders to instantly (fully automatic) determine the waves and their rapid interpretation, it also allows to automatically measure the pr
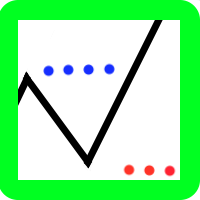
The indicator is a polyline (ZigZag segment) that tracks and connects the extreme points of the chart price that are at least a specified size apart from each other in points on the price scale.
The one and only setting is the minimum size (in points) of a ZigZag segment. The indicator displays levels to determine a possible trend reversal:
level "LevelForUp" - the breaking of this level determines the possible reversal of the trend up (to buy);
level " LevelForDown " - the breaking o

OCTO TACK TREND INDICATOR
Summary/Description: Trend indicator showing signals to execute orders in favor of the current trend Get ready to have the best trend indicator you've ever tried. No repainting in any way, guaranteed It generates clear signals and always in favor of the trend (see screenshots) You just have to wait for the alert to indicate it and earn pip Are you tired of indicators that never work? Here we have the solution, try the free version and if you want to have more signals
FREE

OCTO TACK TREND PRO INDICATOR Summary/Description: Trend indicator Shows signals that tell you the current market trend Shows different signals to execute orders in favor of the current trend
Get ready to have the best trend indicator you've ever tried. It does not repaint in any way, once a signal has been captured, it remains there until it is finalized. It generates clear signals and always in favor of the trend (see screenshots) Just be attentive and wait for the alert to tell you when a ne

The Strategy Tester product is an indicator where you can both test and run strategies. There are 64 strategies in total in this indicator. It uses 3 indicators. You can test tens of thousands of strategies by changing the parameter settings of these indicators. You can run 6 strategies at the same time. With this product, you will now create your own signals.
Recommendations and Features Used indicators: Macd, Bulls power, Bears power It works on all time frame Recommended time fram
The Strategy Tester product is an indicator where you can both test and run strategies. There are 64 strategies in total in this indicator. It uses 3 indicators. You can test tens of thousands of strategies by changing the parameter settings of these indicators. You can run 6 strategies at the same time. With this product, you will now create your own signals.
Recommendations and Features Used indicators: Osma, Money Flow index, Stochastic It works on all time frame Recommended time

The Strategy Tester product is an indicator where you can both test and run strategies. There are 64 strategies in total in this indicator. It uses 3 indicators. You can test tens of thousands of strategies by changing the parameter settings of these indicators. You can run 6 strategies at the same time. With this product, you will now create your own signals.
Recommendations and Features Used indicators: Rsi, Bears power, Stochastic It works on all time frame Recommended time frame

The Strategy Tester product is an indicator where you can both test and run strategies. There are 64 strategies in total in this indicator. It uses 3 indicators. You can test tens of thousands of strategies by changing the parameter settings of these indicators. You can run 6 strategies at the same time. With this product, you will now create your own signals.
Recommendations and Features Used indicators: Rsi, Osma, DeMarker It works on all time frame Recommended time frame H1 You

The Strategy Tester product is an indicator where you can both test and run strategies. There are 64 strategies in total in this indicator. It uses 3 indicators. You can test tens of thousands of strategies by changing the parameter settings of these indicators. You can run 6 strategies at the same time. With this product, you will now create your own signals.
Recommendations and Features Used indicators: Stochastic, Macd, Williams Percent Range It works on all time frame Recommended time fr
MetaTrader mağazası, MetaTrader platformu için uygulama satın almak adına rahat ve güvenli bir ortam sunar. Strateji Sınayıcıda test etmek için Uzman Danışmanların ve göstergelerin ücretsiz demo sürümlerini doğrudan terminalinizden indirin.
Performanslarını izlemek için uygulamaları farklı modlarda test edin ve MQL5.community ödeme sistemini kullanarak istediğiniz ürün için ödeme yapın.
Alım-satım fırsatlarını kaçırıyorsunuz:
- Ücretsiz alım-satım uygulamaları
- İşlem kopyalama için 8.000'den fazla sinyal
- Finansal piyasaları keşfetmek için ekonomik haberler
Kayıt
Giriş yap
Gizlilik ve Veri Koruma Politikasını ve MQL5.com Kullanım Şartlarını kabul edersiniz
Hesabınız yoksa, lütfen kaydolun
MQL5.com web sitesine giriş yapmak için çerezlerin kullanımına izin vermelisiniz.
Lütfen tarayıcınızda gerekli ayarı etkinleştirin, aksi takdirde giriş yapamazsınız.