Indicatore
"Jordan Correlation Inverse"
sfondo
L'indicatore mira a identificare due intervalli divergenti su due mercati correlati che sono collegati tra loro tramite l'indicatore OverlayChart.
Le due gamme devono avere direzioni opposte con la stessa dimensione in termini di Pip, con una percentuale di tolleranza da stabilire nell'indicatore (20-30%). Il range sarà definito in base al numero di candele chiuse previste dall'indicatore (indicativamente 10). Le due variabili le considero necessarie per stimare statisticamente in quali condizioni le operazioni siano più performanti.
Sempre a fini statistici sarebbe opportuno evidenziare l'entità del range in Pip.
Il segnale long / sell che l'indicatore fornirà, sarà costituito dalle ultime due candele che si sono formate sui due mercati con direzioni opposte.
Le ultime due candele possono formare 3 situazioni distinte sui due mercati correlati:
- 2 candele rialziste - 2 candele ribassiste;
- 1 candela alta e 1 candela bassa - 1 candela bassa e 1 candela alta;
- 1 candela giù e 1 candela su - 1 candela su e 1 candela giù;
Rappresentazione grafica
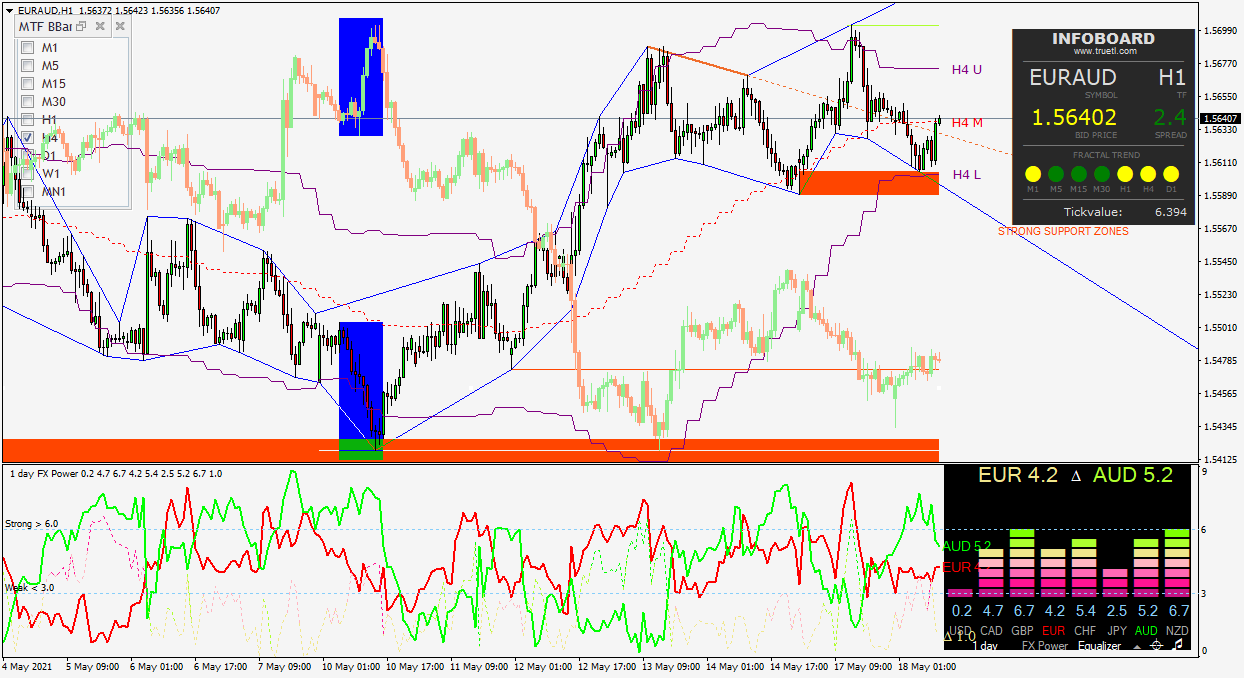
Quando l'indicatore identifica i due intervalli opposti, forma due rettangoli sui due grafici. La base è costituita dal minimo e dal massimo della gamma mentre i lati sono costituiti dalle ultime 10 candele chiuse, esclusa quella attuale. A destra è necessario aggiungere uno spazio maggiore per evitare che la barra laterale del rettangolo renda illeggibili il massimo e il minimo della candela in corso.
Ad ogni nuova candela chiusa il rettangolo si aggiorna in base ai nuovi livelli di prezzo.
Il rettangolo scompare se le dimensioni dei due rettangoli non sono le stesse inclusa la tolleranza.
Rettangolo in alto
Sopra il rettangolo formato sugli alti, sul lato sinistro, è necessario indicare: "Divergent Range" - il mercato relativo e l'altezza del range in Pip.
Es: Gamma divergente EURAUD - Pip 20,00
Il rettangolo sarà rosso (senza colorazione interna)
Rettangolo sui minimi
Sotto il rettangolo che si forma sui minimi, sul lato sinistro, si deve indicare: "Divergent Range" - il mercato correlato e l'altezza del range in Pip.
Ad esempio: Gamma divergente AUDCAD - Pip 23,00
Il rettangolo sarà colorato Lime (senza colorazione interna)
Allerta sulla formazione di rettangoli divergenti.
Suono con descrizione: Gamma divergente: EURAUD - AUDCAD
Solo sulla sua formazione.
Segnale lungo e breve
Solo dopo che si saranno formati i range divergenti, il segnale lungo e corto sarà formato dalla formazione delle due candele invertite consecutive sui due mercati (vedi sopra).
Avviso sulla formazione delle due candele inverse:
Suono con descrizione: Vendi su gamma divergente: EURAUD
Lunga gamma divergente: AUDCAD
Allegato:
Grafico EURAUD con grafico correlato;
Indicatore OverLayCart.
Benzer siparişler
PROJECT: Automatic Gold and Forex Trading Robot for MetaTrader 5 (MQL5) I want a fully automated Expert Advisor (EA) for MetaTrader 5 that can analyze the market and automatically open, manage and close trades on Gold and selected Forex currency pairs. TRADING INSTRUMENTS Gold: XAUUSD Forex: EURUSD, GBPUSD and USDJPY, subject to broker availability. Allow the user to enable or disable each trading symbol. Support
I need a robot that will grow small accounts to bigger amounts like this one in this link, https://youtu.be/d38pMbJihew?si=3NeIOVyrlwDr4X_o. Please click the link and watch how this EA grow small accounts. Then create a robot like that. I will test it on demo first then if it does what i want, i will take it. Please it must be simply to use. It must set targets, for example, once it reaches $500 profit, it must
Here is a professional, detailed requirements specification draft for your MQL5 freelance order based on your prompt: Strategy Objective: Develop an automated Expert Advisor (EA) featuring a 1:3 Risk-to-Reward ratio optimized for a small starting budget. Core Trading Logic: Execute automatic Buy and Sell trades using high-probability entry signals. Target a strict 90% theoretical win-rate structure through
i want to fix my gold martingale bot MT5. RSI 14 ENTRY 30 BUY 70 SELL Lot 0.02 0.04 0.07 TP 150 for all SL 90 30 30 once total daily profit is 200$ stop trading stop trading once 2 consecutives total losses stop trading if spread exceeded 30 and between hour 15 & 17 PM Move SL to breakeven point once the profit exceeded 50 from from breakeven thanks
MarketMind Breakout Pro XAUUSD H1 — Donchian Breakout EA Project type: Personal EA development and backtesting Platform: MetaTrader 5 Instrument: XAUUSD Timeframe: H1 Strategy: Donchian Channel breakout with EMA 200 Project overview This project evaluates a Donchian breakout trading strategy for XAUUSD on the H1 timeframe. The system uses channel-based breakout conditions and an EMA 200 trend filter. Historical
The purpose of this order is ONLY to test and implement my H1 POI (Point of Interest) identification logic correctly. I am not requesting the complete EA at this stage. I will provide the exact rules for identifying the H1 POI after selecting the developer. The developer must convert those rules into clear, deterministic MQL5 logic. Requirements: Analyze H1 candles according to the rules I provide. Identify and mark
Title: Fully Automatic MT5 Trading Bot (Expert Advisor) with Risk Management I want a fully automated trading robot (Expert Advisor) for MetaTrader 5, written in MQL5. The bot must automatically analyse market data, identify trading opportunities, execute BUY and SELL orders, manage open positions, and close trades according to predefined rules without requiring manual confirmation for each trade. Requirements
Hello, I’m looking for an experienced developer to research, build, test, and install a fully automated MetaTrader 5 trading bot for gold, XAUUSD. My total development and installation budget is $300, including all agreed work and fees. My goal is to pass a $100,000 FTMO US Two-Step Standard evaluation and sustainably maintain the funded account. I need a day-trading strategy that can buy in bullish markets and sell
I have three indicators that operate independently. I want to combine them into one indicator with custom expert programming that automatically enters trades when a signal is generated by one of the indicators. I will pay for this service Thanks you
Existing EA: NEW_CORE_ORB_M5_v021 | MT5 | XAUUSD M5 Early-stage research prototype, not a new EA from scratch. Need an experienced MQL5 developer to audit, complete, repair, improve and test BOTH independent strategies equally: Opening Range Breakout (ORB) and Scalp. Keep code lightweight and preserve an untouched baseline. No unnecessary rewrite or complex filters. 1. ORB Strategy Verify opening-range construction
 Tüm siparişler
 Kurallar