Indicatore
"Jordan Correlation Inverse"
sfondo
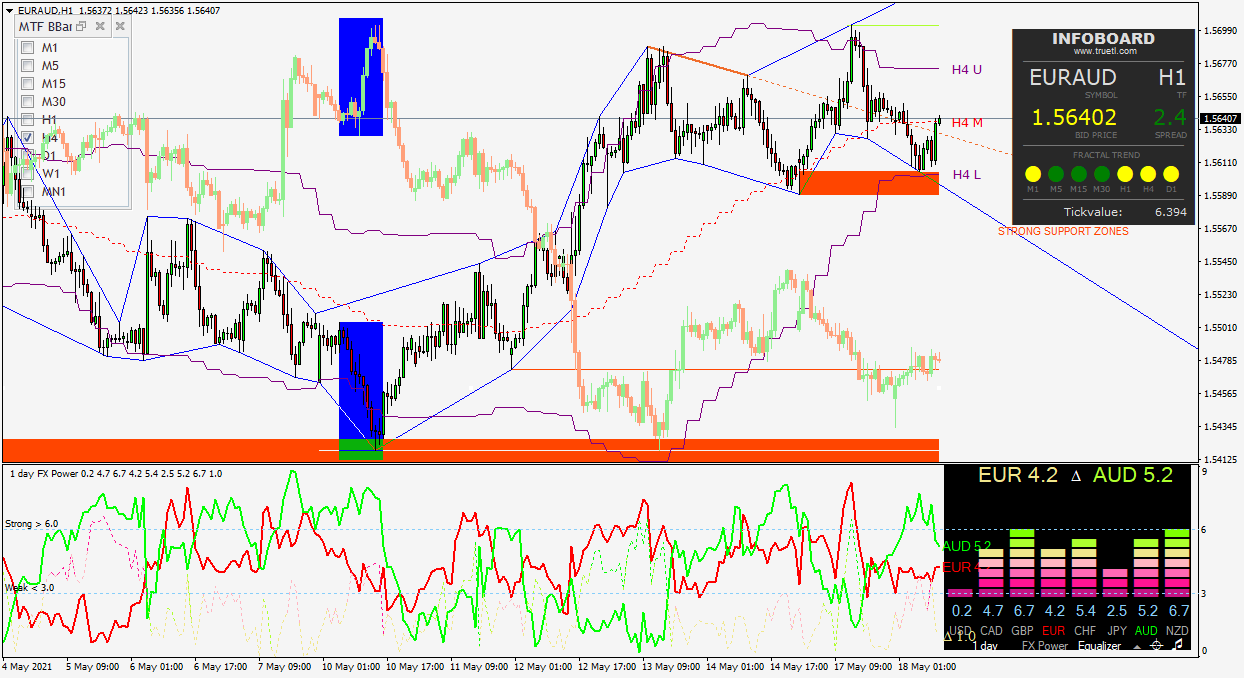
L'indicatore mira a identificare due intervalli divergenti su due mercati correlati che sono collegati tra loro tramite l'indicatore OverlayChart.
Le due gamme devono avere direzioni opposte con la stessa dimensione in termini di Pip, con una percentuale di tolleranza da stabilire nell'indicatore (20-30%). Il range sarà definito in base al numero di candele chiuse previste dall'indicatore (indicativamente 10). Le due variabili le considero necessarie per stimare statisticamente in quali condizioni le operazioni siano più performanti.
Sempre a fini statistici sarebbe opportuno evidenziare l'entità del range in Pip.
Il segnale long / sell che l'indicatore fornirà, sarà costituito dalle ultime due candele che si sono formate sui due mercati con direzioni opposte.
Le ultime due candele possono formare 3 situazioni distinte sui due mercati correlati:
- 2 candele rialziste - 2 candele ribassiste;
- 1 candela alta e 1 candela bassa - 1 candela bassa e 1 candela alta;
- 1 candela giù e 1 candela su - 1 candela su e 1 candela giù;
Rappresentazione grafica
Quando l'indicatore identifica i due intervalli opposti, forma due rettangoli sui due grafici. La base è costituita dal minimo e dal massimo della gamma mentre i lati sono costituiti dalle ultime 10 candele chiuse, esclusa quella attuale. A destra è necessario aggiungere uno spazio maggiore per evitare che la barra laterale del rettangolo renda illeggibili il massimo e il minimo della candela in corso.
Ad ogni nuova candela chiusa il rettangolo si aggiorna in base ai nuovi livelli di prezzo.
Il rettangolo scompare se le dimensioni dei due rettangoli non sono le stesse inclusa la tolleranza.
Rettangolo in alto
Sopra il rettangolo formato sugli alti, sul lato sinistro, è necessario indicare: "Divergent Range" - il mercato relativo e l'altezza del range in Pip.
Es: Gamma divergente EURAUD - Pip 20,00
Il rettangolo sarà rosso (senza colorazione interna)
Rettangolo sui minimi
Sotto il rettangolo che si forma sui minimi, sul lato sinistro, si deve indicare: "Divergent Range" - il mercato correlato e l'altezza del range in Pip.
Ad esempio: Gamma divergente AUDCAD - Pip 23,00
Il rettangolo sarà colorato Lime (senza colorazione interna)
Allerta sulla formazione di rettangoli divergenti.
Suono con descrizione: Gamma divergente: EURAUD - AUDCAD
Solo sulla sua formazione.
Segnale lungo e breve
Solo dopo che si saranno formati i range divergenti, il segnale lungo e corto sarà formato dalla formazione delle due candele invertite consecutive sui due mercati (vedi sopra).
Avviso sulla formazione delle due candele inverse:
Suono con descrizione: Vendi su gamma divergente: EURAUD
Lunga gamma divergente: AUDCAD
Allegato:
Grafico EURAUD con grafico correlato;
Indicatore OverLayCart.
Similar orders
Hello I need to purchase the source code of an already built profitable mt5 EA with proven track recordIf you have something similar and you are open to selling the source code please apply to this post Please note I am not looking for a dev to build the product from scratch , but need something that is already built and have at least one year worth of track record
I need an Expert Advisor for MT5 on XAUUSD 1min timeframe using SMC concepts. STRATEGY RULES: SELL: 1. Identify previous day High/Low as liquidity 2. Entry only during London-NY session: 15:00-19:00 GMT+3 or broker clock. 3. If price sweeps previous day High and closes back below it 4. Check for bearish 1min FVG below sweep candle 5. Wait for BOS - lower low 6. Entry: Sell/buy at 50% of the FVG 7. SL: 10 pips above
Code An Loss Rate 90-100% MT5 EA , that can blow a 100 USD account a day ,with fixed TP of 3000 points and SL of 3000 For better Rate Calculations get an strategy that can lead to so
I am looking for an experienced MQL4/MQL5 HFT developer to build or optimize a High-Frequency Trading (HFT) Expert Advisor that can successfully pass proprietary trading firm challenges and perform consistently under live trading conditions with brokers such as 8cap or BlackBull Markets . The developer should have proven experience with HFT execution, ultra-low-latency trading, broker execution, slippage, spreads
I need a professional MT5 Expert Advisor (MQL5) for XAU/USD (Gold) only. Requirements: - Symbol: XAU/USD only - Timeframe: H1 trend, M5 entry - Smart Money Concept (SMC) - Liquidity Sweep - Break of Structure (BOS) - Order Block Retest - Confirmation Candle (Engulfing or Pin Bar) - ATR-based Stop Loss - Risk:Reward = 1:3 (adjustable) - Auto Lot (1% risk) - Break Even - Trailing Stop - Maximum 2 trades per day - One
Hello, I am looking for an existing, fully backtestable MT5 Expert Advisor or EA portfolio designed specifically for passing an FTMO-style prop-firm evaluation. I am not looking for unrealistic profit claims or a visually perfect backtest. My priority is a statistically defensible probability of passing the challenge while respecting all risk limits. Primary objective The system should be designed for the current
I have a High-Frequency Trading (HFT) Expert Advisor for both MT4 and MT5 designed primarily for US30 (Dow Jones Index) . The EA performs consistently and profitably on demo accounts, but when I run it on an IC Markets Raw or Standard live account, it starts generating losses under what appear to be the same trading conditions. At this time, I cannot provide the source code (.mq4/.mq5). I can only provide the
I need an Expert Advisor for MT5 on XAUUSD 1min timeframe using SMC concepts. STRATEGY RULES: SELL: 1. Identify previous day High/Low as liquidity 2. Entry only during London-NY session: 15:00-19:00 GMT+3 3. If price sweeps previous day High and closes back below it 4. Check for bearish 1min FVG below sweep candle 5. Wait for BOS - lower low 6. Entry: Sell at 50% of the FVG 7. SL: 10 pips above sweep wick 8. TP: 2R
Hello looking for someone to convert an indicator from tradingview to Thinkorswim I have attached the codes from trading view Also, I like make it trigger (alert) a one-time alert when the trend changes, and can also create a custom watchlist column that flags symbols currently in a new trend so you can scan multiple stocks easily. And like the watchlist to show only fresh trend changes or the current trend direction
Version document : 1.0 Plateforme : TradingView Langage : Pine Script v6 Type : Indicateur d'analyse et d'aide à la décision (non-exécutant) 1. Présentation du projet Nom du produit ONYX SR V2 — Intelligent Support & Resistance Scalping System Objectif Créer un indicateur TradingView capable d'identifier automatiquement des opportunités de scalping basées sur : supports et résistances dynamiques ; action du prix ;