Fan sayfamıza katılın
Öyleyse bir link gönderin -
başkalarının da faydalanmasını sağlayın
- Görüntülemeler:
- 125
- Derecelendirme:
- Yayınlandı:
-
Bu koda dayalı bir robota veya göstergeye mi ihtiyacınız var? Freelance üzerinden sipariş edin Freelance'e git
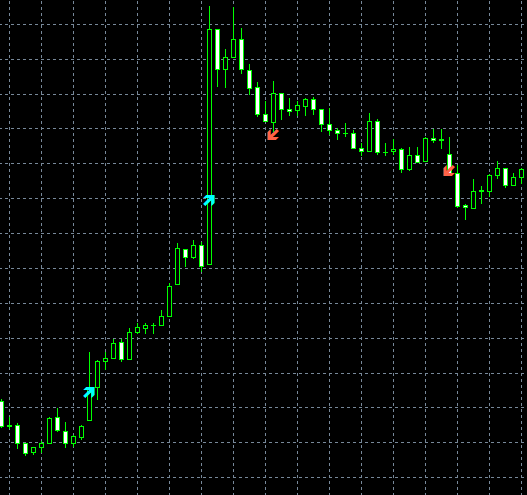
Bu komut dosyası, Strateji Test Cihazından kaydedilen Strateji raporunu bir grafikte görüntülemek için geliştirilmiştir.
Aşağıdaki adımları izleyin:
- report_into_chart.mql5 dosyasını ¨\MQL5\Scripts" klasörüne koyun.
- report_into_chart.mql5 dosyasını derleyin ve report_into_chart .ex5 dosyasını alın .
- StrategyTester.zip dosyasını açın ve StrategyTester.html dosyasını ¨\MQL5\Files" klasörüne koyun.
- Metatrader 5'inizi yenileyin.
- Metatrader'dan report_into_chart komut dosyasını çalıştırın ve tüm anlaşmalar seçilen grafikte mavi (alış pozisyonları) veya kırmızı (satış pozisyonları) oklar olarak görüntülenecektir.
-

- Daha sonra StrategyTester.html dosyasını Strateji Test Cihazından seçtiğiniz * .html raporu ile değiştirebilirsiniz.
MetaQuotes Ltd tarafından İngilizceden çevrilmiştir.
Orijinal kod: https://www.mql5.com/en/code/54706
 Candle Replay Magnifier
Candle Replay Magnifier, karşılaştırmalı analiz için geçmiş mumları mevcut grafik alanı üzerinde görsel olarak tekrarlar. Bu gösterge, seçilen bir tarihteki geçmiş fiyat çubuklarını canlı grafiğin üzerine yerleştirerek yatırımcıların mum kalıplarını, oynaklığı ve yapıyı gerçek zamanlı olarak incelemelerine olanak tanır. Dinamik aralık vurgulama ve her tekrar mum için açık, yüksek, düşük, kapanış, aralık, yön, zaman ve hacmi gösteren ayrıntılı araç ipuçları içerir.
 MACD_Histogram
Gösterge, finansal varlık ve MACD histogramının grafiklerindeki farklılıkları tespit eder.
 Renkle düzeltilmiş Momentum göstergesi
Mevcut trend durumunun renk göstergesi ile daha yumuşak Momentum.
 Trend gücü ve yön göstergesi
Bu gösterge, trendin gücüne ve yönüne bağlı olarak mumları farklı renklerde boyar.
