• Обзор
  • Отзывы
  • Обсуждение (14)
  • Что нового

Namiri Trade Engine

Namiri Trade Engine is an ALL in ONE trading system that combines price structure, volume pressure, market condition & risk management to give you the BEST opportunities for A+ trade setups with auto lot size

WAIT FOR YOUR A+ SETUP || ONLY TAKE YOUR A+ TRADE || RINSE REPEAT YOUR A+ MOVE

Chart Features

  • Panel - Shows the asset, market, price, pip, account, trade & profit|loss information
  • Structure - Shows areas of support & resistance
  • Risk Management - Shows risk analysis period of 100 bars, buy | sell entry zone as well as stop loss & take profit levels for a {1:2 risk:reward}
  • Volume - Shows volume pressure bars of bulls & bears at the bottom of your chart

Panel Features

  • Asset Info - Shows current time-frame, pair, contract is a buy|sell, leverage & lot size
  • Market Info - Shows the current market condition
  • Price Info - Shows bid|ask, entry, stop & target prices
  • Pip Info - Shows range, spread, risk & reward in pips
  • Account Info - Shows account balance, equity, free margin & active margin
  • Trade Info - Shows the amounts of commission, swap, stop loss & take profits
  • Profit | Loss - Shows the profit | loss on the active trade on that specific pair

Parameters

  • Trade Risk - Default: percent risk at 0.25%
  • Trade Setups - Bounce | Breach | Burrow
  • Color Theme - Bullish | Neutral | Bearish | Buy Zone | Sell Zone

Trade Setups

STOP BEHIND STRONG STRUCTURE || STRONG IMPULSE MOVE WITH STRONG ANCHOR LEGS || VOLUME PRESSURE CONFIRMATION
  • BUY Contract - Trade when a BUY ALERT is triggered for a bounce | breach | burrow trade setups, ASK price MUST close inside the LONG entry zone based on BULLISH market info, entry confirmed by STRONG bullish volume pressure clusters on the LONG impulse move than other bullish & bearish volume pressure clusters both inside & outside the risk management tool
  • SELL Contract - Trade when a SELL ALERT is triggered for a bounce | breach | burrow trade setups, BID price MUST close inside the SHORT entry zone based on BEARISH market info, entry confirmed by STRONG  bearish volume pressure clusters on the SHORT impulse move than other bearish & bullish volume pressure clusters both inside & outside the risk management tool

Things To Note

WHEN THE BULLS & BEARS FIGHT STAY OUT OR YOU WILL GET HURT

  • Inside the risk management tool is the first 100 bars; Outside the risk management tool is the next 100 bar; Trade alert minimum risk is set to 10 pips
  • Depending on the risk percentage, spread & leverage, the lot size is some cases are rounded up or down therefore your actual trade amounts may differ slightly; a strong barrier is the one that is formed & tested and begins from the current price period all the way out past the risk analysis period {the longer & tested the structure the stronger the barrier}
  • The stop loss & take profit dollar amounts shown under trade info are based on risk percentage plus hard stops and targets, therefore your actual trade amounts may differ slightly depending on your actual entry price, slippage, spreads & rounded lot size
  • Please DO NOT just take each & every trade setup alert, MOST are low quality trade setup alerts because of NO structure & NO volume pressure confirmations. First, pick one asset, one setup. Secondly, ensure its an A+ setup that has been confirmed by structure & volume pressure. TEST it, PROVE it & TRADE it on a demo account BEFORE a live account. Lastly, just rinse & repeat those A+ trade setups; Ignore all trade setup alerts during red news for they are most likely false positives mainly the M1 & M5 timeframes

TEST IT || PROVE IT || TRADE IT

Share comments & reviews

DO NOT PURCHASE THIS PRODUCT UNTIL YOU HAVE THOROUGHLY BACK TESTED FOR YOURSELF USING THE FREE DEMO


Рекомендуем также
Технический индикатор Smooth Price (Гладкая цена) используется для построения гладкой линии максимально приближенной к цене торгового инструмента и служит для устранения ее шумовых составляющих. Индикатор является частью торговой системы Monarch, но здесь он представлен как самостоятельный инструмент технического анализа. Основой индикатора служит кластерный цифровой фильтр , который, в отличии от проекта ClusterSMA , применяется непосредственно к ценовой таймсерии. Smooth Price не перерисовывае
Alpha Trend sign - это мой давний и очень популярный торговый инструмент, который проверяет нашу торговую систему и четко сигнализирует о транзакциях, которые не дрейфуют.   Основные функции:   • В зависимости от того, показывает ли рынок активную область, показатели могут быть очень интуитивными, чтобы определить, является ли текущая конъюнктура трендовой или шоковой.   И в соответствии с индикатором стрелка врезается на рынок, зеленая стрела подсказывает купить, красная стрела подсказывает
Turn Every Market Reversal Into a Money-Making Opportunity With the U-turn Detector Indicator! Imagine having a tool that visually reveals the exact moment price is about to flip — before the crowd catches on. The U-turn Detector isn’t just another indicator... it's your edge in spotting clean, confident entries and exits in forex. If you've ever been frustrated by fake breakouts, late signals, or messy charts — you're about to fall in love with this tool. URGENT REMINDER: PRICE MAY DOUBLE
Индикатор поддержки и сопротивления для бинарных опционов Этот индикатор разработан специально для торговли бинарными опционами и отлично показывает откаты от уровней поддержки и сопротивления. Сигналы появляются на текущей свече. Красная стрелка, направленная вниз, указывает на потенциальную возможность продажи, а синяя стрелка, направленная вверх, предлагает возможности для покупки. Все, что вам нужно настроить, это цвет сигнальных стрелок. Рекомендуется использовать его на таймфреймах M1-M5,
FX Flow   indicator can be used as an anticipator of the next trend, preferably confirmed by Price Action or another oscillator (RSi, Stochastic ..). It takes the money flows of the major currencies USD EUR GBP AUD NZD CAD CHF JPY into account, and processes them. Excellent tool for indices, but also for correlations between currencies. Works on each timeframes.  Blue line: Bull market Yellow line: Bear market Note : if the indicator opens the window, but does not draw lines, load the historie
Индикатор Crypto_Forex "Auto FIBO Pro" - отличный вспомогательный инструмент в торговле! - Индикатор автоматически рассчитывает и размещает на графике уровни Фибоначчи и локальные линии тренда (красного цвета). - Уровни Фибоначчи указывают ключевые области, где цена может развернуться. - Наиболее важными уровнями являются 23,6%, 38,2%, 50% и 61,8%. - Вы можете использовать его для скальпинга на разворот или для торговли по зональной сетке. - Существует множество возможностей улучшить вашу теку
Анализ распределения Галактического Объема (VSA) - это индикатор, предназначенный для визуализации Объема и доли, в которой он влияет на волатильность разброса различных пар. Стратегия состоит из следующего: Bull Trend: Всегда в пользу тренда, открывайте покупки на минимумах тренда, при условии, что он совпадает с большим объемом, показанным индикатором Galactic VSA. Нисходящий тренд: Всегда в пользу тренда, открывайте торговые операции на максимумах тренда, при условии, что он совпадает с бо
Данный индикатор находит и отрисовывает зоны , так сказать места силы, где цена будет разворачиваться. Индикатор может работать на любом графике, любом инструменте, любом таймфрейме. Индикатор имеет два режима. Индикатор оснащен панелью управления с кнопками для удобства и разбит на два режима. Ручной и авто. Ручной режим: Для работы с ручным режимом необходимо нажать кнопку NEW, появится отрезок. Данный отрезок натягиваете на движение и нажимаете кнопку LVL. Отрисовывается уровень. Авто режим:
Welcome to the world of SMC (Smart Money Concepts) Trading, where we empower traders with the tools and knowledge to make smarter trading decisions. Our latest addition to our suite of trading tools is the SMC Trading Pro indicator, version 1.0. Key Features: Major Market Structure Identification with BODY break. Order Block must be in Major Swing ( not Small Swing ). Order Block with Fair Value Gap Detection. Order Block in Discount | Premium zone. Filter for only Bullish, Bearish or All Order
Introduction It is common practice for professional trades to hide their stop loss / take profit from their brokers. Either from keeping their strategy to the themselves or from the fear that their broker works against them. Using this indicator, the stop loss / take profit points will be drawn on the product chart using the bid price. So, you can see exactly when the price is hit and close it manually.  Usage Once attached to the chart, the indicator scans the open orders to attach lines for t
Limitless MT4    - это универсальный индикатор который подойдет каждому как начинающему так и опытному трейдеру работает на всех валютных парах криптовалютах сыре акциях Limitless MT4 - уже настроен и не требует дополнительной настройки   А теперь главное Почему    Limitless MT4 ? 1 полное отсутствие перерисовки  2 два года тестирования лучшими специалистами в трейдинге 3 точность правильных сигналов превышает 80% 4 хорошо показал себя в торговле во время выхода новостей Правила торговли  1 сигн
Last 50 Pips
Martin Alejandro Bamonte
Индикатор Last 50 Pips разработан для быстрого определения возможностей покупки и продажи на основе недавнего поведения цен. Он измеряет изменение цены в последних свечах, чтобы выделить желтым моменты, когда цена может менять направление. Сигнал на покупку: Следует открыть позицию ПОКУПКИ , когда индикатор меняется с КРАСНОГО на ЖЕЛТЫЙ , что указывает на изменение от нисходящего тренда к восходящему. Пожалуйста, смотрите изображения, чтобы увидеть, как это просто. Сигнал на продажу: Следует о
Индикатор определяет и отображает на графике гармоничный паттерн Акула согласно схеме, приведенной на скриншоте. Выделение паттерна производится по вершинам индикатора ZigZag (включен в ресурсы, не требует дополнительной установки). В момент распознавания паттерна выводится сообщение во всплывающем окне, отправляются оповещения на мобильное устройство и электронный почтовый ящик. Индикатор выделяет не только завершенную фигуру, но и момент ее формирования. На этапе формирования фигура отображает
PABT Pattern Indicator - это классическая реализация одного из сигнальных паттернов.  Логика индикатора заключается в том, что он определяет ситуации в которых максимум и минимум сигнального бара находится в пределах максимума и минимума предыдущего бара, тем самым показывает разворот тренда. Для сигнала на покупку сигнальный бар закрывается выше цены открытия, для сигнала на продажу сигнальный бар закрывается ниже цены открытия, предыдущий бар соответственно противоположного сигнальному типа. В
BSA indicator is a ZigZag based indicator. This indicator is used to find the reversal level of the price. You can use the existing risk ratio and calculation timeframe in the entries by optimizing them according to your usage preference.  In lower time frames, the indicator can repaint. For healthier results, you can detect the least repainting by observing for a while according to the graphic you will apply.
EARLY REMINDER: The Starting price is 65 price will rise soon up to 365$ and then 750$ after first 10 copies of sales. Grab this offer now! Introduction Hello, traders! Welcome to the demonstration of the Forex Beast Indicator , a comprehensive tool designed to assist aspiring traders in navigating the complexities of the forex market. This indicator incorporates seven essential components to provide a well-rounded trading experience: Moving Averages Colored Zones Support and Resistance Levels
Индикатор показывает потенциальный направление тренда по циклично-волновой зависимости. Таким образом, все лучи пересечения будут оптимальными лучами, в направлении которых ожидается движение цены с учетом периода индикатора. Лучи можно использовать как направление потенциального движения рынка. Но не надо забывать, что подход должен быть комплексным, сигналы индикатора требуют дополнительной информации для входа в рынок.
Towers -  Индикатор тренда, показывает сигналы, можно использовать с оптимальным коэффициентом риска. В расчетах использует надежные алгоритмы. Показывает благоприятные моменты для входа в рынок стрелками, то есть использовать индикатор достаточно просто. Он сочетает в себе несколько фильтров, отображая на графике стрелки входа в рынок. Учитывая это обстоятельство, спекулянт может изучить историю сигналов инструмента и оценить его эффективность. Как видите торговать с таким индикатором легко. До
ПРЕДЛОЖЕНИЕ! ПРЕДЛОЖЕНИЕ! С 22 по 27 сентября скидка 70% на всю стоимость аренды. НЕ ПРОПУСТИТЕ ЭТО ПРЕДЛОЖЕНИЕ. СЛЕДУЮЩАЯ Цена будет 650$. Уважаемые трейдеры, я так рад представить вам еще один мой торговый инструмент или индикатор под названием Super Powers Indicator. Цель этого торгового инструмента - помочь серьезным трейдерам, которые хотят сделать торговлю одним из своих основных источников дохода. Я знаю, что трейдинг — непростая задача, но если у вас есть правильные инструменты, знания и
Next level of trend trading here. Possibility 75%, the indicator analyzes the current market to determine short (small dot), middle (circle with a dot inside) and long (cross with a circle and a dot inside) trends.  Wingdings characters of  Aqua color represents the beginning of the UP trend. Wingdings characters of  Orange color represents the beginning of the DOWN trend. Possibility 75% Indicator will improve your trading in the world of forex, commodities, cryptocurrencies and indices.
Gioteen Volatility Index (GVI)   - your ultimate solution to overcoming market unpredictability and maximizing trading opportunities. This revolutionary indicator helps you in lowering your losing trades due to choppy market movements. The GVI is designed to measure market volatility, providing you with valuable insights to identify the most favorable trading prospects. Its intuitive interface consists of a dynamic red line representing the volatility index, accompanied by blue line that indicat
This is the complete REX package. It consists of the lite, pro and ULTRA version.  Perfect for beginners and intermediates. REX complete is 100% non repaint. The strategy is based on a mix of different strategies, statistics, including pivot points, oscillators and patterns.  As the trading idea consists of a variety of some classic indicators like Momentum, Williams Percent Range, CCI, Force Index, WPR, DeMarker, CCI, RSI and Stochastic, it is clear that the fundamental indicators have being u
This indicator works on MT4 and is very easy to use. When you receive a signal from it, you wait for that candle with the signal to close and you enter your trade at the beginning of the next new candle . A red arrow means sell and a green arrow means buy. All arrows comes with Alert  like for easy identification of trade signal. Are you okay with that? 1 minute candle 1 minute expire
LDS Scalper
Justice Chinemelum Clement
PLEASE LEAVE US A 5-STAR REVIEW   LDS Scalper User Manual+ Extra LDS CSDIF INDICATOR + Training Videos   ABOUT LDS SCALPER INDICATOR STRATEGY Built on  15+ years of trading experience. LDS Scalper is a very powerful  trading indicator for scalping strategy, returns very high accuracy rate in forex, futures, cryptocurrencies, stocks and indices. This indicator displays arrow signals based on price action information with high accuracy. The LDS Scalper Indicator strategy when applied can turn a ne
Highly configurable MFI indicator. Features: Highly customizable alert functions (at levels, crosses, direction changes via email, push, sound, popup) Multi timeframe ability Color customization (at levels, crosses, direction changes) Linear interpolation and histogram mode options Works on strategy tester in multi timeframe mode (at weekend without ticks also) Adjustable Levels Parameters: MFI Timeframe:  You can set the current or a higher timeframes for MFI. MFI Bar Shift:   you can set the
FREE
Ловец трендов: Стратегия Ловец трендов с индикатором оповещения - это универсальный инструмент технического анализа, который помогает трейдерам определять рыночные тренды и потенциальные точки входа и выхода. Он представляет собой динамичную стратегию Ловец трендов, адаптирующуюся к рыночным условиям для четкого визуального представления направления тренда. Трейдеры могут настраивать параметры в соответствии со своими предпочтениями и уровнем риска. Индикатор помогает в идентификации тренда, с
FREE
Belladonna — это усовершенствованный пользовательский технический индикатор для MetaTrader 4, основанный на Hull Moving Average (HMA) . Он визуализирует направление тренда при помощи цветных линий и стрелок на графике. Индикатор оптимизирован для минимизации запаздывания и устранения рыночного шума, что делает его особенно полезным для краткосрочной и среднесрочной торговли. Функции и особенности: Тип скользящей средней: Hull Moving Average (на базе двух EMA/SMA линий). Методы расчета: Поддержк
Professional Cumulative Delta & Volume Median Indicator Track   real buying/selling pressure   with this powerful volume analysis tool. The   Volume Compare Indicator   combines   Cumulative Delta   and   Volume Medians   to help you identify institutional activity, imbalances, and potential reversals. Key Features:   Cumulative Delta Histogram   – Visualizes net buying vs. selling volume in real-time.   Buy/Sell Volume Medians   – Horizontal lines showing average buy & sell volume lev
Trend Flasher Trend is your friend is the age old saying quote in trading arena, there are though many ways to gauge the trend and its direction, more scientific measure and logically meaningful will be an ATR break outs to identify and spot the trend and its acceleration, so we created this easy to use trend identification panel and optimized super trend based multi time frame panel entry system to aid and help the traders to make their trading decision. Unique Features of Trend Flasher 1. H
"Dynamic Scalping Oscillator" - это продвинутый пользовательский индикатор Crypto_Forex - эффективный торговый инструмент для MT4! - Новое поколение осцилляторов - см. изображения, чтобы узнать, как им пользоваться. - Dynamic Scalping Oscillator имеет адаптивные зоны перепроданности/перекупленности. - Осциллятор - это вспомогательный инструмент для поиска точных точек входа из динамических зон перепроданности/перекупленности. - Значения перепроданности: ниже зеленой линии, значения перекупленн
С этим продуктом покупают
BinaryIndicator - высокоточный индикатор для торговли бинарными опционами. Отличные результаты показывает при скальпинге. Основу данного индикатора составляет многофакторный анализ трендовых индикаторов, а также подтверждающих осцилляторов, что в итоге дает повышенную точность сигналов. Преимущества индикатора Повышенная точность сигналов; Показывает отличные результаты при торговле бинарными опционами с временем экспирации от M30 до M1 ; Работает на любых временных интервалах; Работает с любым
The indicator of a Professional Trader - это стрелочный индикатор для прогнозирования направления движения цены. Над этим индикатором я работаю с 2014 года.  Вы можете использовать этот индикатор в качестве основного, использовать его сигналы для входа и использовать его в качестве единственного индикатора для поиска точек входа. О продукте: Рекомендуемый TF [H4-D1-W1] . Индикатор предсказывает направление движения следующей свечи.  Подходят множество инструментов; Гибкость в настройках под ра
Торговая система для ручной торговли The [GRAFF] III основана на многочисленных индикаторах MetaTrader (MT4). Собранные вместе, эти индикаторы представляют собой эффективный торговый инструмент. Система включает в себя более 20 различных пользовательских индикаторов, которые были тщательно отобраны и протестированы на длительном историческом периоде. Каждый конкретный индикатор основан на той или иной формуле расчета. Таким образом вся система настроена таким образом, чтобы отсеивать ложные сигн
Pan PrizMA CD Phase аналог индикатора из МetaТrader 5 , является опцией построенной на базе индикатора Pan PrizMA . Подробнее . Усреднение полиномом второй-четвертой степени повышает гладкость линий, добавляет инерцию и соответственно ритмичность. Экстраполяция функцией синусоиды около константы позволяет регулировать запаздывание или опережение. Значение фазы - параметра состояния волны (близко по смыслу тригонометрической фазе или углу поворота радиус-вектора в тригонометрической плоскости) по
Green Wall Arrows достигает большого количества TP, изменяя идею о неиспользовании SL как чего-то плохого. Вместо этого применяется небольшой TP, большой размер свободных средств и терпение. Для торговли при помощи этого индикатора на Форекс используйте микор-TP и большой размер свободных средств. Возможно его применение и на бинарных опционах. Эта стратегия предназначена для торговли в ручном режиме. Этот индикатор работает на открытии бара, стрелки будут удаляться, если цена пойдет против них.
Golden Monowave - индикатор моноволн. Теория моноволн - это один из подходов волновой теории Эллиотта, и один из наиболее сложных и точных методов. Golden Monowave может сократить много крупных шагов для определения и описания моноволны. Он работает на любом таймфрейме и с любым торговым инструментом, включая валюты, индексы, фьючерсы и так далее. Входные параметры initial_Bars - начальное количество баров для вычисления. wave_color - цвет волны. label_color - цвет меток. temp_label_color - цве
Индикатор отображает в отдельном окне разность между количеством пунктов, которые увеличили цену, и количеством пунктов, которые уменьшили цену за заданный в настройках интервал времени. Временной интервал, за который проводится расчет, выражается в количестве баров графика, на который индикатор прикреплен. Данный подход позволяет оценить в какую сторону (рост или падение) движется цена инструмента, силу движения и величину движения в пунктах. В работе индикатор использует только тики поступающи
NostradamusMT4
Andrey Spiridonov
1 (1)
NostradamusMT4 - мощный индикатор из набора профессионального трейдера. В основе индикатора лежит авторский метод Андрея Спиридонова расчета цены (ESTIMATED PRICE) для текущей цены свечи. Преимущества Индикатор не перерисовывается; Работает на любых временных интервалах; Работает с любыми торговыми инструментами; Отлично подходит для скальпинга и торговли бинарными опционами. Параметры Color - цвет линии ESTIMATED PRICE FUTURE . Порядок работы с индикатором Индикатор формирует расчетную цену
BinaryScalping - профессиональный индикатор для торговли бинарными опционами и скальпинга. Алгоритм работы индикатора основан на расчете опорных точек ( Pivot) для каждого временного периода отдельно, анализируется расположение цены торгового инструмента относительно опорных точек и вычисляется вероятность совершения торговой операции. В индикатор встроен фильтр торговых сигналов по глобальному тренду. Индикатор устанавливается обычным образом и работает с любым торговым инструментом. На графике
This is the FXTraderariel PowerTrend . It compute a trendfollowing system based on it own algorithm. It gives you a buy or sell signal based on the trend. It based on the Supertrend, but our Version is not repainting. Furthermoore we added some Improvements and you can get an Arrow, Push or Alert when the trend changes. Depending on the settings it and trading style, it can be used for scalping or long-term trading . The indicator can be used on every time frame , but we advise to use it on H1
BinaryUniversal - сигнальный индикатор для бинарных опционов и форекс. В своей работе индикатор использует сложный алгоритм генерации сигналов. Прежде чем сформировать сигнал, индикатор анализирует волатильность, свечные модели, важные уровни поддержки и сопротивления. В индикаторе есть возможность настроить точность сигналов, что дает возможность применить данный индикатор как для агрессивной, так и для консервативной торговли. Индикатор устанавливается обычным образом, работает на любом времен
The arrows are calculated with: -     2 Parabolic  parameters -     2 ADX parameters -     4 Stochastic parameters We recommend to combine it with Parabolic, ZigZag or Elliot waves indicator. Always trade the trend! If you make sure to draw your trend lines and support/resistance zones you will just have to wait for the signal to appear. Take the trade. For Binary Options it is advisable to set the expiry time to 5-15 min in M1 chart. THIS INDICATOR IS ZERO REPAINT Best assets to trade: - EUR
Let´s try to make some real money! Call me profit addicted. I thought why not try to make THE dream come reality. With discipline, a clear strategy and this indicator I focus on entering the perfect trades. This indicator is very easy to use as you will get perfect entry points for Put or Call trades. The arrows are calculated with: -     Momentum  parameters -     Candle stick patterns -     Fundamental Price action We recommend to combine it with Parabolic, ZigZag or Elliot waves indicator
SystemPro - профессиональный индикатор, представляет собой полноценную, самодостаточную авторскую стратегию работы на рынке Forex. Уникальный алгоритм работы анализа валютного рынка основан на расчете опорных точек на трех разный временных периодах. Таким образом, индикатор одновременно анализирует долгосрочное, среднесрочное и краткосрочное поведение цены перед тем как выдать сигнал. Индикатор устанавливается обычным образом и работает с любыми торговыми символами. Преимущества индикатора явля
1. Что такое Floating Nest? Данный индикатор предназначен для автоматизации построения зон принятия решения (могут выступать в качестве уровней поддержки-сопротивления) по стратегии "Плавающее гнездо". Так же индикатор позволяет существенно сократить время при анализе поведения цены в зонах принятия решения на исторических данных. Работает на любых валютных парах. Таймфрейм: M1-H1. Торговая система"NEST" (Гнездо) , отличается своей простотой и эффективностью при торговле на биржевых рынках вал
Pisces TheProfitZone "Pisces TheProfitZone MT4 Indicator Powered byFxGangster" This indicator will calculate new support and resistant zone everyday, and that give us a trading zone such as thats telling us TP and SL, So it still telling us for where should the price will go reach? Fore Example. Uptrend : If Price can stay upper a Line and price close higher above a Line, then the price will continue go up to reach next Line. Downtrend : If Price can't pass to stay upper a Line and the price
Golden Chip provides Basic Market Structure, Fibonacci, supply and Demand Zones. Letting you identify when a sell off point is approaching or whne a buy opportunity is arriving. The awesome thing about Golden Chip is that, you will see rejection levels or continuation before ANYBODY ! This indicator moves directly with price and lines up perfectly with the Chart. Some indicators would lag but NOT this one ! Golden Chip is amazing for Clean chart (Naked Chart). GOLDEN CHIP IS ONLY ON METATRADER (
A scalping indicator based on mathematical patterns, which on average gives signals with relatively small SL, and also occasionally helps to catch big moves in the markets (more information in the video) This indicator has three main types of notifications: The first type warns of a possible/upcoming signal on the next bar The second type indicates the presence of a ready signal to enter the market/open a position The third type is for SL and TP levels - you will be notified every time price re
the best indicator to put your own fingerprint on your products, put your signature and protect your rights easily and simply. You can customize any program (indicator, Expert or script) by choosing your own signature and your favorite color, adjust the indicator properties to suit your needs, and change your signature at any moment you want with this wonderful indicator.
Garuda Empire
Ellan Dirgantara Tholkhah
The Garuda Empire - Binary Options Experience the epitome of trading synthesis where the time-honored Ichimoku methodology seamlessly intertwines with revered Western indicators. It's a harmonious blend—Europe shaking hands with Japan, a true testament to the power of global financial collaboration. With years of dedicated observation and analysis, I've come to one conclusion: Mastery is achieved through specialization. My journey with the EURJPY has been transformative, leading to the birth of
Seconds timeframe generator for MT4  (S1, S5, S10, S15, S20, S30). Features  1. Indicator generates timeframes in real time, with each new tick on the spot. 2. Indicator is also measuring point distance from extreme to extreme when hovered "This additionally shows us how strong movements are". Advantages 1. Easy to spot best entry and exit points. 2. You can easily trade news releases where market is very volatile. 3. You can also easily trade very slow market conditions and spot tre
PROMOÇÃO LIMITADA, NA COMPRA DE 1 INDICADOR VOCÊ LEVA CLUBINARIAS 6.0 , 5.1 e DonForex DE BRINDE!! ATÉ FINAL DO MÊS! -NA HORA DA COMPRA SELECIONAR COMBINAR COM O VENDEDOR OU BUSCAR PESSOALMENTE, A ENTREGA É DIGITAL EM POUCOS SEGUNDOS ==> VEJA O VIDEO PARA TIRAR AS SUAS DUVIDAS <== ==> VÍDEO OPERANDO NO YOUTUBE ROBÔ FEITO COM MUITO ESFORÇO E CARINHO E QUE ESTA TRAZENDO ÓTIMOS LUCROS APESAR DE EXISTIREM PESSOAS QUE APENAS VENDEM ROBÔS FAKES DE OPERAÇÕES , ACREDITO QUE SERIA MUITO BOM DA MI
BPS Panel Breakout Pro Scalper Solution Panel This indicator is part of the   RPTrade Pro Solutions  systems. BPS Panel   is a daily trend indicator using Price Action, Dynamic Support and Resistances. It's designed to be used by anyone, even the absolute beginner in trading can use it. NEVER repaints . Indications are given   from close to close . Designed to   be used alone , no other indicators are required. Gives you the trend and potential Take Profit at the beginning of the day. How doe
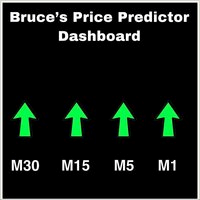
This is a Dashboard Indicator based on Bruce's Price Predictor Indicator . This Dashboard will Give you a visual to see the trend direction without having to flip through timeframes, so you can always be trading in direction of the trend, with little effort.  I Recommend   www.CoinexxBroker.com  as a great broker and the one I personally use *Non-Repainting Dashboard Arrows *For Desktop MT4 Only *Great For Scalping *Great For Swing Trading *Dashboard Arrow Entry Alerts *Dashboard Arrow Signals
ReboltP
David Theodore Caro-greene
Rebalance Overlay Technology (Rebolt) enables the trader to visualize the flow of money from one chart to another chart. Rebolt Probability indicates the probability that money has flowed from one chart to another chart for a specified length of time over a number of intervals specified by the user. When Rebolt reads Cyan or Blue these are buying signs good for the length of time specified by the user or until a conflicting signal arises. When Rebolt reads Violet or Red there are selling signs g
ReboltDelta
David Theodore Caro-greene
Rebalance Overlay Technology (Rebolt) enables the trader to visualize the flow of money from one chart to another chart. Rebolt Delta (ReboltDelta) indicates the probable price change that will occur in the target chart based on changes in the source chart. ReboltDelta is designed for use in cooperation with Rebolt Probability. La tecnología de superposición de reequilibrio (Rebolt) permite al operador visualizar el flujo de dinero de un gráfico a otro gráfico. Rebolt Delta (ReboltDelta) indica
Ежедневный скальпер тренда (DTS) Этот индикатор является частью систем RPTrade Pro Solutions. DTS — это индикатор дневного тренда, использующий ценовое действие, динамическую поддержку и сопротивление. Он предназначен для использования любым, даже абсолютный новичок в торговле может использовать его. НИКОГДА не перекрашивает. Показания даны от близкого к близкому. Предназначен для использования в одиночку, никаких других индикаторов не требуется. Дает вам тренд и потенциальный Take Profit в на
Индикатор помощник при торговле на валютных рынках.Работает на любых таймфреймах и любых валютных парах.Стоит его установить на любое открытое окно,чтобы получить текущую информацию по счету.Для более детальной информации нужно зайти в историю терминала и выбрать конкретный период торговли.Это может быть один день,последние три дня,неделя,месяц или вся торговля по данному счету.Индикатор учитывает все протаргованные сделки доступные в истории за выбранный период времени и по все торгуемым инстру
The use of indicators is extremely simple and does not contain future functions. The use of indicators is divided into the following simple parts: 1. The indicator is blue (upward trend) -> only buy orders 2. The indicator is pink (downtrend) -> only sell orders 3. The indicator is white (consolidation trend) -> only wait and see without send orders 4. The price is above the indicator -> Only buy orders can be made 5. The price is below the indicator -> only sell orders To sum up: 1.
After Purchase, Please Contact  t.me/hakimsann These Indicator are Mixed on All Logical Value Such As Trend Support and Resistance Candle Pattern Price Action we Combine 2 Bollinger Band  6 Zigzag Periods 4 Relative Strength Index Period 1 MACD Trend Support and Resistance Price Action Pattern Candle Avoiding Doji On Market Can Be Applied On Every Market  24-7 Maksimum Martingale lv 5. First stake 0.4% Balance
Другие продукты этого автора
Prometheus Smart Money — это индикатор, сочетающий в себе цену и объем, с расчетами на основе других пользовательских индикаторов, "умных" и розничных объемов. Благодаря этому, данный опережающий индикатор показывает высоковероятностные движения цены, чтобы помочь вам определить, что с наибольшей вероятностью будет происходить на рынке. Преимущества Можно использовать индикатор на любых видах/типах активов или инструментов и на всех финансовых рынках, включая бинарные опционы. Его можно использ
Индикатор Centaurus Trend Engine использует пользовательские индикаторы с мульти-таймфреймовым подходом к трейдингу. Зона значений Это прямоугольник на графике, основанный на максимумах и минимумах 100 простых скользящих средниз структурах Анализ Отображает бычью/медвежью скользящую среднюю Сила Отображает сильный/слабый индекс относительной силы Тренд Отображает бычье/боковое/медвежье движение индикатора Average Directional Movement Index Состояние входа Отображает лучшее время входа в сделки
Primus Smart Money is an indicator that shows the average of bulls and bears on an asset. Used as a confirmation indicator for bullish and bearish control to assist in predicting future price moves Advantages Used in ALL financial markets including binary options on ALL asset classes or instruments. To be used as a confirmation tool with other indicators Parameters Period - default set to 9 (Recommended) Entry requirements Focus on the clusters on the indicator - the height or depth of the bars
Primus Trading Engine is a trading system that combines price action,ratio based indicators & custom indicators to create this leading indicator with a multi-timeframe approach to give you high probability trade setups for forex,CFD cash/futures,metals & binary option to assist in making predictions on what is MOST likely to happen in the market Main Chart Features Price Action Signal-Arrow displayed on a specific bar;NOT buy/sell arrow;DOES NOT repaint;Bullish arrow on a bullish bar,price is l
Prometheus Trade Engine is an indicator that combines price action, ratio based indicator with custom indicators& other lagging indicators to create this leading indicator that has a multi-timeframe approach to trading so that you are able to see what other timeframes are doing all in one chart and give you high probability trade setups to assist you to make a prediction on what is MOST likely to happen in the market going foward Chart Features 1. Reversal Zone It is the rectangular box on you
Фильтр:
Нет отзывов
Ответ на отзыв
Версия 21.4 2025.06.19
Trade alert minimum risk set to 10 pips
Версия 21.3 2025.05.06
Improvements to market info & structure code
Версия 21.2 2025.04.24
Improvements to market info code
Improvements to volume pressure code
Версия 21.1 2025.04.16
Fixed issues of structure display on chart
Версия 21.0 2025.04.13
Updated volume pressure code
Версия 20.9 2025.02.04
Fixed an issue with namiri breach entry criteria
Версия 20.8 2025.02.04
Added a filter to the entry criteria on all namiri trade setups
Версия 20.7 2025.01.31
Improvements to support & resistance code
Версия 20.6 2025.01.22
Adjustment to the volume pressure period
Версия 20.5 2025.01.18
Improvements to volume pressure calculations
Версия 20.4 2025.01.17
Improvements to volume pressure calculations
Версия 20.3 2025.01.07
Fixed issues with structure display (support & resistance)
Minimum of 1000 bars is required on your chart
Версия 20.2 2025.01.06
No trade focus, No structure displayed
Версия 20.1 2025.01.04
Fixed the error in the namiri burrow trade alert
Версия 20.0 2025.01.03
Renamed the namiri buddle trade setup to namiri burrow trade setup
Версия 19.9 2024.12.12
Changes to the volume pressure code
Версия 19.8 2024.12.11
Added a filter to the entry criteria on all setups
Версия 19.7 2024.12.09
Improvements to volume pressure code
Версия 19.6 2024.12.05
Improvements to the market info & volume pressure code
Версия 19.5 2024.11.27
Rectified the error in namiri buddle entry criteria
Версия 19.4 2024.11.26
Improvements to market info code
Версия 19.3 2024.11.21
Fixed the issue with namiri bounce setup
Версия 19.2 2024.11.21
Fixed an issue with the namiri breach entry criteria
Версия 19.1 2024.11.20
Fixed the error in namiri buddle setup
Версия 19.0 2024.11.19
Modified entry criteria for namiri bounce, breach & buddle setups
Версия 18.9 2024.11.14
Fixed the issue with volume pressure reading
Версия 18.8 2024.11.14
Improvements to volume pressure calculations
Версия 18.7 2024.11.01
Removed inside & outside the wire markers
Версия 18.6 2024.10.31
Added inside & outside the wire labels & markers to highlight the analysis limit (ONLY focus on volume pressure within the inside & outside the wire)
Версия 18.5 2024.10.31
Improvements to market info & structure code
Версия 18.4 2024.10.29
Improvements to structure & volume pressure code
Версия 18.3 2024.10.28
Removed version number from the title
Improvements to volume & structure code
Версия 18.2 2024.10.25
Improvements to structure & volume pressure codes
Modified entry criteria for namiri bounce, breach & buddle setups
Версия 18.1 2024.10.15
Improvements to volume pressure code
Версия 18.0 2024.10.15
Improvements to structure & volume pressure codes
Версия 17.9 2024.10.07
Improvements to volume pressure code
Версия 17.8 2024.10.02
Improvements to structure code
Версия 17.7 2024.10.02
Improvements to structure code
Версия 17.6 2024.09.24
Updated namiri breach setup entry criteria
Версия 17.5 2024.09.20
Updated risk management tool
Updated volume pressure code
Updated structure code
Версия 17.4 2024.09.02
Changes to entry zone on the risk management tool
Changes to entry criteria on all namiri trade setups
Changes to structure & volume pressure calculations
Версия 17.3 2024.07.10
Adjusted the risk analysis period to 100
Adjusted the entry criteria to namiri breach setup
Версия 17.2 2024.07.02
Adjusted the risk analysis period to 200
Improvements to structure code
Improvements to volume pressure calculations
Версия 17.0 2024.06.11
Improvements to volume pressure code
Версия 16.9 2024.06.08
Modified structure code
Simplified entry criteria for namiri bounce | breach | defense | strike setups
Версия 16.8 2024.05.23
Added an adjustable maximum pip risk per trade parameter
Improvements to volume pressure code & re-added namiri defense setup
Версия 16.7 2024.05.05
Removed namiri defense setup
Simplified entry criteria for namiri bounce, breach & strike setups
Improvements to structure to include broken support & resistance
Improvements to volume pressure calculations
Версия 16.6 2024.03.19
Fixed a critical error on structure support & resistance code
Версия 16.5 2024.03.19
Removed volume analysis limit
Версия 16.4 2024.03.16
Improvements to volume pressure calculations
Версия 16.3 2024.03.14
Improvements to structure to show broken support & resistance
Версия 16.2 2024.03.12
Adjustments to the volume pressure period
Версия 16.1 2024.03.07
Set market info & volume info analysis limit to 200 bars
The first 100 volume pressure bars represents "inside the wire"
The last 100 volume pressure bars represents "outside the wire"
Версия 16.0 2024.02.28
Modified market info calculations
Modified volume pressure calculations
Added a filter to the entry criteria for all namiri trade setups
Версия 15.9 2024.02.12
Modified entry criteria for namiri breach setup
Improvements to volume pressure calculations
Версия 15.8 2024.01.29
Modified entry criteria for namiri defense setup
Improvements to volume pressure calculations
Версия 15.7 2024.01.25
Modified entry criteria for namiri strike setup
Modified volume pressure calculations
Версия 15.6 2024.01.25
Modified volume info calculations
Modified structure code
Версия 15.5 2024.01.18
Modified entry criteria for namiri strike setup
Modified volume info calculations
Версия 15.4 2023.12.01
Re-added namiri strike trade setup
Modified market info calculations
Modified entry criteria for all namiri trade setups
Версия 15.3 2023.11.09
Modified volume pressure calculations
Версия 15.2 2023.10.30
Removed strike trade setup
Modified entry criteria for breach & defense trade setups
Версия 15.1 2023.10.23
Modified volume pressure calculations
Версия 15.0 2023.10.18
Modified volume pressure calculations
Modified alerts on all trade setups
Версия 14.9 2023.09.23
Added namiri strike trade setup
Improvements to support & resistance structure calculations
Added trade setup parameter options
Changed parameter options display
Версия 14.8 2023.09.15
Modified analysis period
Modified namiri bounce setup
Версия 14.7 2023.08.28
Modified namiri breach & namiri defense entry setups
Версия 14.6 2023.08.25
Modified namiri bounce, namiri breach & namiri defense setups
Версия 14.5 2023.08.02
Improvements to support & resistance code
Версия 14.4 2023.07.24
Modifications to namiri breach & namiri defense entry setups
Версия 14.3 2023.07.14
Fixed trade info -- commission, swap & stop loss display errors
Версия 14.2 2023.07.12
Improvements to support & resistance code
Версия 14.1 2023.07.11
Improvements to volume pressure calculations
Версия 14.0 2023.07.10
Modified market info calculations
Modified volume pressure calculations
Added entry criteria for 3 entry setups (namiri bounce, namiri breach & namiri defense)
Версия 13.9 2023.06.02
Modified market info calculations
Modified volume pressure calculations
Modified entry criteria
Версия 13.8 2023.05.25
Updated entry criteria
Версия 13.7 2023.05.19
Fixed issues in structure code
Modifications to volume pressure code
Версия 13.6 2023.05.11
Modified entry criteria
Modified focus hooks
Версия 13.5 2023.04.27
Improvements to market info to include fast market response
Improvements to volume info to include a longer analysis period
Improvements to structure calculations to include a longer analysis period
Версия 13.4 2023.04.12
Improvements to volume pressure code
Версия 13.3 2023.04.05
Added a filter to the entry criteria
Improvements to the volume pressure code
Версия 13.2 2023.03.28
Removed momentum tag
Версия 13.1 2023.03.22
Improvements to volume pressure code
Added momentum tag
Версия 13.0 2023.03.21
Improvements to volume pressure code
Версия 12.9 2023.03.16
Improvements to volume pressure code
Версия 12.8 2023.03.15
Improvements to structure code
Версия 12.7 2023.03.09
Changes to focus hooks on market info
Версия 12.6 2023.03.09
Increased analysis period range to improve on chart analysis
Modification to display of focus hooks on market info
Версия 12.5 2023.02.28
Removed volume pressure threshold levels
Версия 12.4 2023.02.23
Improvements to structure calculations to only show verified levels
Версия 12.3 2023.02.22
Modifications to market info & volume info
Replaced volume pressure threshold level 30 with level 15
Версия 12.2 2023.02.21
Modifications to volume pressure
Версия 12.1 2023.02.20
Removed volume pressure threshold level
Modification to market info focus hooks
Версия 12.0 2023.02.17
Added volume pressure threshold level 30
Added the minimum 10 pip risk to entry criteria
Версия 11.9 2023.02.16
Removed volume pressure threshold level
Removed the10 pip minimum risk entry criteria
Версия 11.8 2023.01.26
Changed structure from dynamic to static
Removed daily, weekly, monthly dynamic structure
Removed daily, weekly, monthly market info direction bias
Removed momentum tag
Added focus hooks on market info
Added volume pressure threshold of level 30 to assist in monitoring the bull & bear fight
Версия 11.7 2022.12.07
Modifications to structure to include daily, weekly & monthly structure as well as their open (depending on which time frame you are on)
Modifications to volume pressure calculations to confirm if you have a valid setup
Modifications to market info to give you direction bias based on structure & daily, weekly or monthly open (depending on which time frame you are on)
Версия 11.6 2022.11.11
Changed structure from fixed to dynamic
Added momentum tag to identify whether price is oscillating bullish | bearish
Версия 11.5 2022.10.26
Modifications to analysis period
Modifications to market info calculations
Modifications to volume pressure calculations
Modifications to potential entry alert criteria
Версия 11.4 2022.10.06
Modifications to volume info range
Modifications to entry alert criteria
Версия 11.3 2022.09.29
Modifications to volume pressure calculations
Modifications to trade entry alert criteria
Reduced the default risk to 0.5%
Версия 11.2 2022.09.27
Modifications to market info calculations
Modifications to volume info calculations
Modifications to structure calculations
Версия 11.1 2022.09.14
Modifications to analysis period
Modifications to market info calculations
Doubled volume pressure analysis range
Версия 11.0 2022.08.26
Modifications to entry criteria
Modifications to structure calculations
Modifications to market info calculations
Modifications to volume pressure calculations
Removed volume level threshold
Версия 10.9 2022.08.19
Modifications to entry criteria
Modifications to market info calculations
Modifications to volume info calculations
Modification of volume level threshold from 15 to 100
Версия 10.8 2022.08.09
Removed trend stripes
Modifications to entry criteria
Modifications to market info calculations
Modifications to volume info calculations
Added volume level 15 threshold
Версия 10.7 2022.08.03
Removed average tag
Added trend stripes to market info to highlight overall market focus
Modifications to analysis period
Modifications to market info calculations
Modifications to structure calculations
Modifications to entry criteria
Версия 10.6 2022.08.01
Added the average tag
Modifications to market info calculations
Modifications to volume pressure calculations
Modifications to entry criteria
Версия 10.5 2022.07.30
Modifications to volume pressure calculations
Removed threshold level
Removed maximum volume level
Версия 10.4 2022.07.27
Modifications to volume pressure calculations
Changed the volume pressure threshold from 25 to 30
Set the fixed maximum volume pressure to 60
Версия 10.3 2022.07.26
Modifications to market info calculations
Added 25 level volume pressure threshold
Версия 10.2 2022.07.24
Modifications to volume pressure calculations
Версия 10.1 2022.07.22
Removed psychological structure
Removed moving average tag
Modifications to entry criteria
Версия 10.0 2022.07.18
Changed from dynamic structure to fixed psychological structure levels
Removed bullish, bearish & neutral color change option
Default percent risk set to 1.0
Версия 9.9 2022.06.21
Modifications to market info calculations
Changes in entry criteria
Версия 9.8 2022.05.17
Changed banner to highlight trade risk relative to structure range
Версия 9.7 2022.05.17
Added more structure levels
Added a banner to highlight no trading with narrow structure range
Версия 9.6 2022.05.13
Added structure level to the entry criteria
Removed "pending" market info
Версия 9.5 2022.05.06
Added a 200 MA close level tag on the chart
Added the MA to the entry criteria
Версия 9.4 2022.05.05
Reduced the number of structure levels
Renamed the structure levels
Removed "pending" market info condition
Changes to entry criteria
Версия 9.3 2022.05.04
Changed labels on levels to include overall structure focus
Changed structure level period as well as period visibility
Changed market info calculations
Included "pending" market condition to market info meaning "no trade zone"
Changed risk management period
Changed entry criteria parameters
Версия 9.2 2022.04.28
Changed structure period
Included structure labels
Версия 9.1 2022.04.27
Changed dynamic structure period
Changed structure zones to structure levels
Версия 9.0 2022.04.26
Fixed structure code label issue
Fixed entry criteria errors
Версия 8.9 2022.04.26
Removed some dynamic structure levels
Changed from structure level to structure zone
Change structure period
Changed market info calculations
Changed volume info period
Changed risk management period
Версия 8.8 2022.04.21
Changed structure levels to structure zones
Changed analysis period, volume info & structure periods
Changed entry criteria
Версия 8.7 2022.04.20
Changed structure from static to dynamic
Changed volume info calculations
Версия 8.6 2022.04.14
Changed from dynamic structure to fixed structure
Версия 8.5 2022.04.13
Renamed structure levels
Changed volume period
Версия 8.4 2022.04.08
Added structure labels to know where price is on the chart
Modified entry criteria
Changed trade range to structure range
Версия 8.3 2022.04.06
Changed period to volume info calculations
Added a filter to entry criteria
Версия 8.2 2022.04.04
Complete structure overhaul from static to dynamic
Improvements to market info calculations
Minor adjustment to the entry criteria
Removed redundant code
Версия 8.1 2022.03.30
Cleaned up the overall code by removing outdated code
Improvements to structure calculations for a slightly more high probability structure zones
Версия 8.0 2022.03.30
Modified period to market info calculations
Adjustments to risk management tool
Modified period to volume info calculations
Modified period to structure calculations
Версия 7.9 2022.03.25
Improvements to market info & volume info calculations
Версия 7.8 2022.03.22
Improvements to volume info calculations
Версия 7.7 2022.03.21
Improvements to market info calculations
Версия 7.6 2022.03.16
Removed probability factor to buy & sell contract
Modifications to volume info
Версия 7.5 2022.03.16
Modifications to volume info
Added a probability factor to buy & sell contracts
Версия 7.4 2022.03.15
Improvements to market info calculations & risk management tool
Версия 7.3 2022.03.14
Modifications to risk management tool
Версия 7.2 2022.03.12
Modifications to risk management & volume info
Версия 7.1 2022.03.11
Improvements to market info calculations
Версия 7.0 2022.03.04
Fixed entry alert criteria
Improvements to market info calculations
Версия 6.9 2022.03.04
Restructured the risk management tool for high probability trade setups
Версия 6.8 2022.03.01
Improvements to volume info calculations
Версия 6.7 2022.02.26
Revert from dynamic structure to fixed structure
Версия 6.6 2022.02.23
Changes to structure naming
Extended structure period
Версия 6.5 2022.02.22
Complete structure overhaul from static to dynamic
Improvements to market info & volume info calculations
Minor adjustment to the entry criteria
Версия 6.4 2022.02.18
Improvements to market info calculations
Версия 6.3 2022.02.18
Added a filter on the entry criteria
Версия 6.2 2022.02.11
Improvements to structure calculations
Версия 6.1 2022.02.10
Improvements to volume calculations
Modifications to entry criteria
Версия 6.0 2022.01.31
Modified structure calculations
Changed volume pressure chart presentation
Версия 5.9 2022.01.17
Minor adjustments to volume info calculations
Версия 5.8 2022.01.17
Modifications to volume info calculations
Версия 5.7 2022.01.04
Modification to market info calculations
Версия 5.6 2021.12.23
Adjustments to analysis period
Modifications to market info
Версия 5.5 2021.12.17
Modified time delay between alerts
Improvements to market info calculations
Версия 5.4 2021.12.14
Modifications to market info calculations
Версия 5.3 2021.12.13
Improvements to structure code
Modified trade entry criteria
Версия 5.2 2021.12.11
Improvements to structure calculations
Modified entry criteria
Bug fixes
Версия 5.1 2021.12.06
Improvements to structure calculations
Modifications to volume calculations
Версия 5.0 2021.12.01
Improvements to market info calculations
Modifications to structure code
Added levels to volume info
Версия 4.9 2021.11.26
Removed adjustable analysis period
Версия 4.8 2021.11.26
Complete change to volume pressure calculations
Improvements to market info calculations
Версия 4.7 2021.11.02
Modified entry criteria
Changed default color theme
Volume bar width set to 3
Версия 4.6 2021.10.26
Fixed minor bug
Версия 4.5 2021.10.22
Improvements to market info calculations
Stretched the volume info mapping to twice the analysis range
Версия 4.4 2021.10.18
Modified market info, volume info & entry alert criteria
Версия 4.3 2021.10.15
Modifications to market info calculations
Maximum analysis period allowed set to 200
Версия 4.2 2021.10.14
Slight modification to structure calculations
Версия 4.1 2021.10.13
Modified volume info calculations
Modified structure calculations
Maximum analysis period allowed in 300
Версия 4.0 2021.09.29
Low severity bug fixed
Default analysis period set is 100
Minimum analysis period allowed is 20
Maximum analysis period allowed is 500
Версия 3.9 2021.09.17
Removed average tag on chart
Modified entry criteria to include average tag as an additional filter
Версия 3.8 2021.09.16
Set default analysis period to 180
Set the volume bars width to 2
Версия 3.7 2021.09.13
Added a tag to show the moving average on your chart
Версия 3.6 2021.08.18
Changes to volume calculations
Default analysis period set to 100
Версия 3.5 2021.08.06
Adjustable analysis period
Analysis period default set to 200
Версия 3.4 2021.08.06
Analysis period set to 50
Версия 3.3 2021.06.25
Restored static structure
Removed dynamic structure
Removed long & short trading zones
Версия 3.2 2021.06.24
Replaced dynamic structure with dynamic long & short trading zones
Changed line style on both the chart & the left hand panel
Версия 3.1 2021.06.15
Volume info modifications
Версия 3.0 2021.06.07
Modified volume calculations
Версия 2.9 2021.06.04
Changed structure labels
Версия 2.8 2021.05.27
Changes to line style for better visuals
Версия 2.7 2021.05.26
Changed market info response from static to dynamic
Версия 2.6 2021.05.25
Modification to market info calculations
Modification to entry criteria
Modification to structure period & levels
Версия 2.5 2021.05.21
Complete overhaul of the entire structure system from static to dynamic
Removed analysis & volume period parameter changes - all are now pre-coded
Improvements of volume calculations
Changes to chart labels
Версия 2.4 2021.05.07
Rectified volume info calculations
Версия 2.3 2021.05.06
Modified volume info calculations
Версия 2.2 2021.05.06
Modified entry criteria
Версия 2.1 2021.05.04
Improvements to structure calculations
Версия 2.0 2021.04.27
Improvements to volume info calculations
Added labels to risk management levels [take profit, entry zone & stop loss]
Версия 1.9 2021.04.20
Adjustable volume period
Версия 1.8 2021.04.20
Corrections to structure analysis
Adjustable analysis period with default set to 50 bars
Версия 1.7 2021.04.17
Modified structure calculations
Версия 1.6 2021.04.16
Analysis period & trade signal is set to non-adjustable
Версия 1.5 2021.04.15
Adjustments to volume info calculations
Analysis period default set to 100 bars
Версия 1.4 2021.04.14
Analysis period default set to 200 bars
Версия 1.3 2021.04.07
Added volume info bars
Structure is now set to always show on chart
Версия 1.2 2021.03.27
Modified Alert Parameters
Версия 1.1 2021.03.24
Adjusted Market Info Calculations