• 미리보기
  • 리뷰
  • 코멘트 (14)
  • 새 소식

Namiri Trade Engine

Namiri Trade Engine is an ALL in ONE trading system that combines price structure, volume pressure, market condition & risk management to give you the BEST opportunities for A+ trade setups with auto lot size

WAIT FOR YOUR A+ SETUP || ONLY TAKE YOUR A+ TRADE || RINSE REPEAT YOUR A+ MOVE

Chart Features

  • Panel - Shows the asset, market, price, pip, account, trade & profit|loss information
  • Structure - Shows areas of support & resistance
  • Risk Management - Shows risk analysis period of 100 bars, buy | sell entry zone as well as stop loss & take profit levels for a {1:2 risk:reward}
  • Volume - Shows volume pressure bars of bulls & bears at the bottom of your chart

Panel Features

  • Asset Info - Shows current time-frame, pair, contract is a buy|sell, leverage & lot size
  • Market Info - Shows the current market condition
  • Price Info - Shows bid|ask, entry, stop & target prices
  • Pip Info - Shows range, spread, risk & reward in pips
  • Account Info - Shows account balance, equity, free margin & active margin
  • Trade Info - Shows the amounts of commission, swap, stop loss & take profits
  • Profit | Loss - Shows the profit | loss on the active trade on that specific pair

Parameters

  • Trade Risk - Default: percent risk at 0.25%
  • Trade Setups - Bounce | Breach | Burrow
  • Color Theme - Bullish | Neutral | Bearish | Buy Zone | Sell Zone

Trade Setups

STOP BEHIND STRONG STRUCTURE || STRONG IMPULSE MOVE WITH STRONG ANCHOR LEGS || VOLUME PRESSURE CONFIRMATION
  • BUY Contract - Trade when a BUY ALERT is triggered for a bounce | breach | burrow trade setups, ASK price MUST close inside the LONG entry zone based on BULLISH market info, entry confirmed by STRONG bullish volume pressure clusters on the LONG impulse move than other bullish & bearish volume pressure clusters both inside & outside the risk management tool
  • SELL Contract - Trade when a SELL ALERT is triggered for a bounce | breach | burrow trade setups, BID price MUST close inside the SHORT entry zone based on BEARISH market info, entry confirmed by STRONG  bearish volume pressure clusters on the SHORT impulse move than other bearish & bullish volume pressure clusters both inside & outside the risk management tool

Things To Note

WHEN THE BULLS & BEARS FIGHT STAY OUT OR YOU WILL GET HURT

  • Inside the risk management tool is the first 100 bars; Outside the risk management tool is the next 100 bar
  • Depending on the risk percentage, spread & leverage, the lot size is some cases are rounded up or down therefore your actual trade amounts may differ slightly; a strong barrier is the one that is formed & tested and begins from the current price period all the way out past the risk analysis period {the longer & tested the structure the stronger the barrier}
  • The stop loss & take profit dollar amounts shown under trade info are based on risk percentage plus hard stops and targets, therefore your actual trade amounts may differ slightly depending on your actual entry price, slippage, spreads & rounded lot size
  • Please DO NOT just take each & every trade setup alert, MOST are low quality trade setup alerts because of NO structure & NO volume pressure confirmations. First, pick one asset, one setup. Secondly, ensure its an A+ setup that has been confirmed by structure & volume pressure. TEST it, PROVE it & TRADE it on a demo account BEFORE a live account. Lastly, just rinse & repeat those A+ trade setups; Ignore all trade setup alerts during red news for they are most likely false positives mainly the M1 & M5 timeframes

TEST IT || PROVE IT || TRADE IT

Share comments & reviews

DO NOT PURCHASE THIS PRODUCT UNTIL YOU HAVE THOROUGHLY BACK TESTED FOR YOURSELF USING THE FREE DEMO


추천 제품
Last 50 Pips
Martin Alejandro Bamonte
Last 50 Pips 지표는 최근 가격 움직임을 기반으로 매수 및 매도 기회를 빠르게 식별하도록 설계되었습니다. 최근 캔들의 가격 변화를 측정하여 가격이 방향을 바꿀 수 있는 순간을 노란색으로 강조 표시합니다. 매수 신호: 지표가 빨간색 에서 노란색 으로 변경될 때 매수 포지션을 열어야 합니다. 이는 하락세에서 상승세로의 전환을 암시합니다. 얼마나 쉬운지 확인하려면 이미지를 참조하세요. 매도 신호: 지표가 녹색 에서 노란색 으로 변경될 때 매도 포지션을 열어야 합니다. 이는 상승세에서 하락세로의 전환 가능성을 나타냅니다. 알림: 이 지표는 또한 사용자에게 모든 기기에서 차트의 새로운 신호에 신속하게 반응할 수 있도록 소리, 이메일 또는 푸시 알림을 통한 실시간 알림을 받을 수 있는 옵션을 제공합니다. 질문이 있으면 언제든지 저에게 연락하세요 :)
Auto Fibo Pro m
DMITRII GRIDASOV
"Auto FIBO Pro" Crypto_Forex 지표 - 거래에 유용한 보조 도구입니다! - 지표는 자동으로 Fibo 수준과 로컬 추세선(빨간색)을 계산하여 차트에 배치합니다. - Fibonacci 수준은 가격이 반전될 수 있는 주요 영역을 나타냅니다. - 가장 중요한 수준은 23.6%, 38.2%, 50%, 61.8%입니다. - 역전 스캘핑이나 존 그리드 거래에 사용할 수 있습니다. - Auto FIBO Pro 지표를 사용하여 현재 시스템을 개선할 수 있는 기회도 많습니다. - Info Spread Swap Display가 있습니다. 현재 Spread와 Swap이 부착된 외환 쌍을 표시합니다. - 디스플레이에는 계정 잔액, 자본 및 마진도 표시됩니다. - 차트의 어느 모서리에서나 Info Spread Swap Display를 찾을 수 있습니다. 0 - 왼쪽 상단 모서리, 1 - 오른쪽 상단, 2 - 왼쪽 하단, 3 - 오른쪽 하단. // 훌륭한 트레이딩 로봇과 지표는 여기
Market Steps MT4
Mahdi Ebrahimzadeh
5 (2)
시장 단계 표시기는 Gann 시간/가격 상관 관계를 기반으로 설계 및 구축되었으며 Forex 시장에 대한 가격 조치 특정 규칙에 따라 최적화됩니다. 시장 주문 흐름 개념을 사용하여 대량 주문에 대한 잠재적 가격 영역을 예측합니다. 지표 수준은 거래 자체에 사용하거나 다른 전략/지표의 잘못된 신호를 필터링하기 위한 조합으로 사용할 수 있습니다. 모든 거래자는 차트에 다중 시간 프레임(TF) 영역과 가격 변동 가능성을 함께 표시할 수 있는 강력한 도구가 필요합니다. 테스터 모드에서 파워를 테스트하여 레벨이 차트보다 어떻게 가격을 책정하는지 확인할 수 있습니다. 표시기 장점: 두 개의 서로 다른 영역이 있는 마킹 차트는 서로 다른 TF에 대한 추세 및 범위 시장을 지정합니다. Price Action 거래자는 이를 사용하여 다른 TF/가격 구역의 주문 흐름을 식별하거나 FTR(Fail To Return)/FTC(Fail To Continue)를 확인할 수 있습니다. 시장의 휘발성 및
FX Flow
Eva Stella Conti
FX Flow   indicator can be used as an anticipator of the next trend, preferably confirmed by Price Action or another oscillator (RSi, Stochastic ..). It takes the money flows of the major currencies USD EUR GBP AUD NZD CAD CHF JPY into account, and processes them. Excellent tool for indices, but also for correlations between currencies. Works on each timeframes.  Blue line: Bull market Yellow line: Bear market Note : if the indicator opens the window, but does not draw lines, load the historie
Signal From Level
Yaroslav Varankin
Binary Options Support Resistance Indicator This indicator is designed for binary options trading and effectively shows retracements from support and resistance levels. Signals appear on the current candle. A red arrow pointing downwards indicates a potential selling opportunity, while a blue arrow pointing upwards suggests buying opportunities. All that needs adjustment is the color of the signal arrows. It is recommended to use it on the M1-M5 timeframes as signals are frequent on these timef
FiboZag
Andriy Sydoruk
Indicator FiboZag - transfer the indicator to the chart and the Fibonacci levels will be built automatically on the last ZigZag turn. The main advantage lies in the correct construction of Fibonacci levels and markup of price levels. Simple, visual and effective use. The indicator is not redrawn and does not lag. Works on all currency pairs and on all timeframes.
The indicator detects and displays Shark harmonic pattern (see the screenshot). The pattern is plotted by the extreme values of the ZigZag indicator (included in the resources, no need to install). After detecting the pattern, the indicator notifies of that by a pop-up window, a mobile notification and an email. The indicator highlights the process of the pattern formation and not just the complete pattern. In the former case, it is displayed in the contour triangles. After the pattern is comple
Alpha Trend sign has been a very popular trading tool in our company for a long time. It can verify our trading system and clearly indicate trading signals, and the signals will not drift. Main functions: Based on the market display of active areas, indicators can be used to intuitively determine whether the current market trend belongs to a trend market or a volatile market. And enter the market according to the indicator arrows, with green arrows indicating buy and red arrows indicating se
EARLY REMINDER: The Starting price is 65 price will rise soon up to 365$ and then 750$ after first 10 copies of sales. Grab this offer now! Introduction Hello, traders! Welcome to the demonstration of the Forex Beast Indicator , a comprehensive tool designed to assist aspiring traders in navigating the complexities of the forex market. This indicator incorporates seven essential components to provide a well-rounded trading experience: Moving Averages Colored Zones Support and Resistance Levels
Gioteen Volatility Index (GVI)   - your ultimate solution to overcoming market unpredictability and maximizing trading opportunities. This revolutionary indicator helps you in lowering your losing trades due to choppy market movements. The GVI is designed to measure market volatility, providing you with valuable insights to identify the most favorable trading prospects. Its intuitive interface consists of a dynamic red line representing the volatility index, accompanied by blue line that indicat
BoxChart MT4
Evgeny Shevtsov
4.4 (5)
The market is unfair if only because 10% of participants manage 90% of funds. An ordinary trader has slim changes to stand against these "vultures". This problem can be solved. You just need to be among these 10%, learn to predict their intentions and move with them. Volume is the only preemptive factor that faultlessly works on any timeframe and symbol. First, the volume appears and is accumulated, and only then the price moves. The price moves from one volume to another. Areas of volume accumu
This indicator works on MT4 and is very easy to use. When you receive a signal from it, you wait for that candle with the signal to close and you enter your trade at the beginning of the next new candle . A red arrow means sell and a green arrow means buy. All arrows comes with Alert  like for easy identification of trade signal. Are you okay with that? 1 minute candle 1 minute expire
The indicator detects and displays 3 Drives harmonic pattern (see the screenshot). The pattern is plotted by the extreme values of the ZigZag indicator (included in the resources, no need to install). After detecting the pattern, the indicator notifies of that by a pop-up window, a mobile notification and an email. The indicator highlights the process of the pattern formation and not just the complete pattern. In the former case, it is displayed in the contour triangles. After the pattern is com
Troopers
Oleksii Ferbei
All the points of intersection of the Troopers indicator will be points at which the trend direction changes. Sharp price fluctuations are ignored as well as noise around average prices. Signal points, where the color changes, can be used as potential market reversal points. The indicator tracks the market trend with very high reliability. This development can be used both for long-term trading and for pipsing on small periods. The indicator algorithm implements a kind of technical analysis base
Highly configurable MFI indicator. Features: Highly customizable alert functions (at levels, crosses, direction changes via email, push, sound, popup) Multi timeframe ability Color customization (at levels, crosses, direction changes) Linear interpolation and histogram mode options Works on strategy tester in multi timeframe mode (at weekend without ticks also) Adjustable Levels Parameters: MFI Timeframe:  You can set the current or a higher timeframes for MFI. MFI Bar Shift:   you can set the
FREE
The Hurricane Cave Indicator shows different trade areas based on price action. It looks in the past and works out patterns that can enforce support and resistance as targets. When price breaks out of a trade area you can target just inside the next trade area. If you can't see the target just go to a slower time frame, it means the price hasn't been there for a long time. The Hurricane Cave Indicator is designed to be an add on to The Hurricane Forex Indicator also available in the Meta Trader
FREE
Power Renko MT4
Pierce Vallieres
Power Renko is an indicator which plots Renko bricks underneath the chart using a histogram. You can select the brick size and the timeframe of the Renko bricks as well as whether or not to use the close price or the high/low price of the candles. Renko bricks are based on price alone, not time, therefor the Renko bricks will not be aligned with the chart's time. They are extremely useful for trend trading and many different strategies can be formed from them. Buffers are provided allowing you t
ADX Shark Scalper
Maxwell Ndzoyiya
ADX Shark Scalper – The Ultimate Hybrid Indicator for Precision Scalping Dive into the markets with the ADX Shark Scalper , a powerful and versatile tool designed for traders who seek precision in every trade. This cutting-edge indicator seamlessly combines multiple advanced technical signals into one streamlined system, allowing you to spot good buy and sell opportunities with ease. At its core, the ADX Shark Scalper leverages the power of trend and momentum detection through the integration of
Binary Scalper 6 – MT4용 강력한 바이너리 옵션 지표 Binary Scalper 6은 MetaTrader 4 (MT4) 용 고급 트렌드 분석 및 바이너리 옵션 거래 도구입니다. 모든 수준의 트레이더에게 적합하며, 명확한 신호와 통계를 제공합니다. 주요 특징: 트렌드 탐지 : 트렌드 시장을 정확하게 식별. 모든 통화쌍 지원 : 선호 시장에서 유연한 거래 가능. 모든 시간 프레임에서 작동 : 1분에서 월간 차트까지. 1 캔들 만료 신호 : 빠르고 명확한 거래 기회 제공. 내장 통계 : 시장 성과에 대한 귀중한 데이터 제공. 버퍼 화살표 : 정확한 진입 신호 제공. 설치 방법: MQL5 폴더를 다운로드하여 MetaTrader 4 디렉토리에 이동하세요. 여기에서 다운로드 。.........
Good Signal
Yaroslav Varankin
The indicator is designed for binary options and short-term transactions on Forex To enter a trade when a signal appears blue up arrow buy red down arrow sell signal For Forex enter on a signal exit on the opposite signal or take profit For binary options Enter on 1 candle, if the deal goes negative, set a catch on the next candle Works on all timeframes If you apply a filter like Rsi, you will get a good reliable strategy.. The algorithm is at the stage of improvement and will be further develo
Trend Oscillator mw
DMITRII GRIDASOV
Trend Oscillator - 고급 맞춤형 Crypto_Forex 지표, 효율적인 거래 도구입니다! - 고급 새로운 계산 방법 사용 - 매개변수 "계산 가격"에 대한 20가지 옵션. - 지금까지 개발된 가장 매끄러운 오실레이터. - 상승 추세는 녹색, 하락 추세는 빨간색. - 과매도 값: 5 미만, 과매도 값: 95 이상. - 이 지표로 표준 전략도 업그레이드할 수 있는 기회가 많습니다. - PC 및 모바일 알림. ................................................................................................................................................ // 뛰어난 트레이딩 로봇과 지표는 여기에서 확인할 수 있습니다: https://www.mql5.com/en/users/def1380/seller 이 MQL5 웹사이트에서만 제공되는 오리지널 제품입니다.
支点交易 : 1.pp 支点 2. r1 r2 r3 , s1 s2  s3 交易实用必备工具指标 波浪自动计算指标,通道趋势交易 完美的趋势-波浪自动计算通道计算 , MT4版本 完美的趋势-波浪自动计算通道计算 , MT5版本 本地跟单复制交易 Easy And Fast Copy , MT4版本 Easy And Fast Copy , MT5版本 本地跟单复制交易 模拟试用 Easy And Fast Copy , MT4 模拟账号运行 Easy And Fast Copy , MT5 模拟账号运行 支点( pivot points) 作为一种交易策略已经很长时间了,最初是场内交易员使用这种方法。使用这种方法通过几个简单的计算就可以了解市场在一天中的去向。 支点法中的支点是一天中市场方向的转向点,通过简单地计算前日的高点、低点和收盘价,可以得到一系列点位。这些点位可能形成关键的支撑和阻力线。支点位,支撑和阻力位被统称为支点水位。 你所看到的市场每天都有开盘价、高价、低价及收盘价(有一些市场是 24 小时开盘,比如外汇市场,通常用 5pm EST 作为开盘和收盘时间)。这些信息
Great Entry System
Muhammed Emin Ugur
This   Great Entry System  indicator is designed for signal trading. This indicator generates trend signals. It uses many algorithms and indicators to generate this signal. It tries to generate signals from the points with the highest trend potential. This indicator is a complete trading product. This indicator does not need any additional indicators. The indicator is never repainted. The point at which the signal is given does not change. When the signal comes the arrows are put back one ca
"다이나믹 스캘핑 오실레이터"는 MT4를 위한 고급 맞춤형 암호화폐/외환 지표이자 효율적인 트레이딩 도구입니다! - 차세대 오실레이터 - 사용 방법은 그림을 참조하세요. - 다이나믹 스캘핑 오실레이터는 적응형 과매도/과매수 영역을 제공합니다. - 오실레이터는 동적인 과매도/과매수 영역에서 정확한 진입 시점을 찾는 보조 도구입니다. - 과매도 값: 녹색선 아래, 과매수 값: 주황색선 위. - 이 지표는 가격 변동 패턴과도 결합하기 좋습니다. - 일반 오실레이터보다 훨씬 정확합니다. 적합한 시간대: M30, H1, H4, D1, W1. - PC 및 모바일 알림 기능 제공. // 훌륭한 트레이딩 로봇과 지표는 다음 링크에서 확인하실 수 있습니다: https://www.mql5.com/en/users/def1380/seller MQL5 웹사이트에서만 제공되는 오리지널 제품입니다.
PABT Pattern Indicator - it's classical system one of the signal patterns. Indicator logic - the Hi & Lo of the bar is fully within the range of the preceding bar, look to trade them as pullback in trend. In the way if indicator found PABT pattern it's drawing two lines and arrow what showing trend way.  - First line - it's entry point and drawing at: 1. On the high of signal bar or on middle of the signal bar (depending from indicator mode) for buy; 2. On the low of signal bar or on middle of t
Real Trend Zigzag PRO   shows the real trend of a market, u nlike the default Zigzag indicator. It calculates the trend in real time and shows green lines for upwards trends, red lines for downward trends and blue lines for no trends.  Regarding the old slogan "the trend is your friend" it helps you to decide if should open a buy or sell position. The PRO version is a multi timeframe zigzag (MTF). Means, it shows the trend of the current timeframe as well as the trend of a higher or lower time.
Happy Scalping Indicator
Leandro Bernardez Camero
이 지표는 공격적인 스캘핑 과 바이너리 옵션에서 빠른 진입 을 위해 설계되었습니다 , 각 캔들 마다 신호를 생성하여 언제든지 무엇이 일어나고 있는지 정확히 알 수 있습니다. Happy Scalping 채널에 가입하세요: MQL5 재작성 없음 : 현재 캔들의 신호는 실시간 으로 생성됩니다. 이는 캔들이 아직 형성 중일 때 가격이 이전 캔들의 종가에 비해 상승하거나 하락하는지에 따라 신호가 변경될 수 있음을 의미합니다. 그러나 캔들이 닫히면 , 신호의 색상은 완전히 고정됩니다 . 변경되지 않으며, 사라지지 않고, 이동하지 않습니다. 보이는 그대로 남습니다. 왜 이렇게 설계되었나요? 많은 스캘퍼들은 특히 가격의 돌파나 급격한 움직임 이 있을 때 즉시 신호를 받는 것을 선호합니다. 이를 통해 그런 빠른 피프스를 바로잡을 수 있습니다. 반면, 일부 트레이더는 닫힌 캔들로 확인을 기다리는 것 을 선호하며, 이 지표는 그들도 완벽하게 사용할 수 있습니다. 두 가지 접근 방식 모두 유효합니
Adjustable Consecutive Fractals  looks for 2 or more fractals in one direction and sends out a on screen alert, sound alert and push notification, for strong reversal points . Adjustable Consecutive Fractals, shows the fractals on chart along with a color changing text for buy and sell signals when one or more fractals appear on one side of price. Adjustable Consecutive Fractals is based Bill Williams Fractals . The standard Bill Williams fractals are set at a non adjustable 5 bars, BUT withe th
New, more accurate version of the Xmaster indicator. More than 200 traders from around the world have conducted more than 15,000 tests of different combinations of this indicator on their PCs in order to get the most effective and accurate formula. And here we present to you the "Xmaster formula indicator forex no repaint" indicator, which shows accurate signals and does not repaint. This indicator also sends signals to the trader by email and push. With the arrival of each new tick, it constan
Crosskalp1
Mikhail Bilan
Добрый День уважаемые трейдеры!  Вашему вниманию индикатор созданный и работающий на базе трендовика ADX,  для торговли на смене направления движения который учитывает коррекцию и даёт возможность на ней заработать.  Применяю этот индикатор для скальпинга. Рекомендую таймфреймы от 15 ти минутного(М15) до часового (Н1) периодов.  Красный кружок сигнал на продажу- Sell) Зелёный кружок  сигнал на покупку Buy) Чем меньше ваш таймфрейм тем меньше пунктов вы зарабатываете.   Важно выставлять стопы! !В
이 제품의 구매자들이 또한 구매함
The indicator displays the probable ( Support and resistance ) levels. The indicator draws horizontal and trend levels of support and resistance. The indicator settings: Trends - the mode for displaying trend lines or horizontal lines of support and resistance Yes - display trend lines only No - display horizontal lines only UseResource - use the resources built into the indicator. Yes - use the ZigZag indicator from the resources of the product. No - use a custom ZigZag indicator. HistoryBar -
The indicator of a Professional Trader is an arrow indicator for predicting the direction of price movement. I have been working on this indicator since 2014. You can use this indicator as your main indicator, use its entry signals, and use it as your only indicator to find entry points. About the product: Recommended TF [H4-D1-W1]   . The indicator predicts the direction of the next candle. Fits a variety of tools; Flexibility in settings for different instruments and intervals through the MO
THE GRAFF III
Antonin Skaryd
The [GRAFF] III manual trading system is based on multiple MetaTrader (MT4) indicators. Together, the entire PACK of GRAFF III indicators makes an advanced trading tool. The system consists of over 20 different custom-built indicators which have been carefully selected and tested in the long term to produce strong and efficient trading signals. The particular indicators are based on different mathematical formulas, so the entire system is calibrated to remove false signals from its own indicator
Sweet Waffle
Christophe Godart
The arrows are calculated with: -     2 Parabolic  parameters -     2 ADX parameters -     4 Stochastic parameters We recommend to combine it with Parabolic, ZigZag or Elliot waves indicator. Always trade the trend! If you make sure to draw your trend lines and support/resistance zones you will just have to wait for the signal to appear. Take the trade. For Binary Options it is advisable to set the expiry time to 5-15 min in M1 chart. THIS INDICATOR IS ZERO REPAINT Best assets to trade: - EUR
Let´s try to make some real money! Call me profit addicted. I thought why not try to make THE dream come reality. With discipline, a clear strategy and this indicator I focus on entering the perfect trades. This indicator is very easy to use as you will get perfect entry points for Put or Call trades. The arrows are calculated with: -     Momentum  parameters -     Candle stick patterns -     Fundamental Price action We recommend to combine it with Parabolic, ZigZag or Elliot waves indicator
Golden Chip
Daishon Cotman
Golden Chip provides Basic Market Structure, Fibonacci, supply and Demand Zones. Letting you identify when a sell off point is approaching or whne a buy opportunity is arriving. The awesome thing about Golden Chip is that, you will see rejection levels or continuation before ANYBODY ! This indicator moves directly with price and lines up perfectly with the Chart. Some indicators would lag but NOT this one ! Golden Chip is amazing for Clean chart (Naked Chart). GOLDEN CHIP IS ONLY ON METATRADER (
Quants Forex Zones
Ferhat Mutlu
5 (1)
일단 mql5를 통해 저에게 연락을 구입하십시오. 따라서 귀하의 플랫폼에서 대시보드가 ​​올바르게 작동하는지 확인할 수 있습니다. 중첩 Forex 영역은 바운스 및 브레이크아웃 영역을 찾기 위해 하나의 차트에서 모든 주요 레벨을 가져오도록 설계되었습니다. 당신이 상상할 수 있는 모든 것은 중첩된 합류 및 공급 수요 영역을 찾기 위해 여러 시간 프레임에서 하나의 대시보드로 가져와집니다. 대시보드가 ​​높은 점수를 나타내면 해당 영역에서 반응을 얻을 가능성이 높은 지지와 저항 및 가격의 명확한 식별입니다. 명확한 이해를 위해 더 많은 예를 확인하거나 메시지를 보내주십시오. 무엇을 계산합니까?     지원 저항     공급 수요     숫자 반올림     도형     볼린저     편차 영역     과매수 및 과매도 영역     모멘텀 지표     방향 표시기     이동 평균     RSI     스토치     일일 평균     주간 평균     월평균     더블 탑스   
Indicador MTXPRO
Matheus Silva De Castro
PROMOÇÃO LIMITADA, NA COMPRA DE 1 INDICADOR VOCÊ LEVA CLUBINARIAS 6.0 , 5.1 e DonForex DE BRINDE!! ATÉ FINAL DO MÊS! -NA HORA DA COMPRA SELECIONAR COMBINAR COM O VENDEDOR OU BUSCAR PESSOALMENTE, A ENTREGA É DIGITAL EM POUCOS SEGUNDOS ==> VEJA O VIDEO PARA TIRAR AS SUAS DUVIDAS <== ==> VÍDEO OPERANDO NO YOUTUBE ROBÔ FEITO COM MUITO ESFORÇO E CARINHO E QUE ESTA TRAZENDO ÓTIMOS LUCROS APESAR DE EXISTIREM PESSOAS QUE APENAS VENDEM ROBÔS FAKES DE OPERAÇÕES , ACREDITO QUE SERIA MUITO BOM DA MI
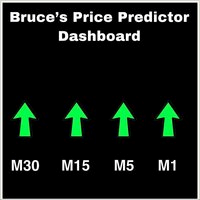
This is a Dashboard Indicator based on Bruce's Price Predictor Indicator . This Dashboard will Give you a visual to see the trend direction without having to flip through timeframes, so you can always be trading in direction of the trend, with little effort.  I Recommend   www.CoinexxBroker.com  as a great broker and the one I personally use *Non-Repainting Dashboard Arrows *For Desktop MT4 Only *Great For Scalping *Great For Swing Trading *Dashboard Arrow Entry Alerts *Dashboard Arrow Signals
데일리 트렌드 스캘퍼(DTS) 이 표시기는 RPTrade Pro 솔루션 시스템의 일부입니다. DTS는 가격 조치, 동적 지원 및 저항을 사용하는 일일 추세 지표입니다. 누구나 사용할 수 있도록 설계되었으며 거래의 절대 초보자도 사용할 수 있습니다. 다시 칠하지 마십시오. 표시는 닫기에서 닫기로 제공됩니다. 단독으로 사용하도록 설계되어 다른 표시기가 필요하지 않습니다. 당신에게 하루의 시작에 추세와 잠재적인 이익실현을 제공합니다. 어떻게 작동합니까 DTS는 가격 조치 및 동적 지원 및 저항과 결합된 돌파 전략을 사용하고 있습니다. 야간 추세와 변동성은 다음날에 사용할 것으로 분석됩니다. 이 분석에서 브레이크아웃 한계(파란색 및 진한 주황색 선)와 이익실현(Take Profit)이 결정됩니다. 이력 데이터 덕분에 전략 및 설정의 "성공"을 즉시 확인할 수 있습니다. 역사적인 부분을 통해 전략에 "구멍"이 있는지 즉시 확인하고 더 잘 맞는 다른 TimeFrame 또는 Symbol을
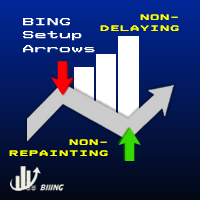
***** The REAL , ORIGINAL, Non-Repainting, Non-Delaying, Arrow Trade Entry indicator for Very Low-Risk market execution ***** ***This is the Golden standard in arrow indicators for MT4.*** BING Setup Arrows Indicator(BSA) will show easy-to-read High Probability trading situations with Non-Repainting , Non-Delaying , Up or Down arrows on the graph.  So simple, it's brilliant. Always shows very good trading setups, no flashy colors, confusing configurations, hard-to-read dashboards, etc.  Perfec
****** Easy to understand, correct Trade direction indicator, quick and easy to visualize******* BING Proper Path Indicator(BPP) will show BUY/SELL signals on-screen in an easy-to-understand 'Traffic Light' format. Provides a final 'reassurance' and 'peace of mind' for taking an educated, high probability, low-risk, trade decision. In the same way, you use a rearview mirror for instantaneous information while taking a driving decision, the same way BING Proper Path Indicator(BPP) will help you
Risk Reward ratio indicator for MT4  BING Risk Reward indicator is a powerful, basic, very needed tool for every trader. Clearly visualize Open Price , Stop Loss , and Top Profit levels on your graphs with easy-to-see colors and trendlines. Does BING Risk Reward show alerts? Of course! BING Risk Reward Indicator offers all Alerts available for the MT4 platform(Email, Popups, Sound, and Push). It shows alerts on Open Price , Stop Loss , and Top Profit. That way, besides easily seeing what is go
Evaluator
Kingsley Chukwuebuka Nwanesi
evaluator consistently checks for price targets in spreads. it can operate in any timeframe. if you have purchased the product please contact me personally for help to further understand the system and get update on upcomings. creates a single chart in a single window based on the price action of each currency in relation to all other currencies and period are totally edittable.
The channels
Mansour Rahkhofteh
Counter trade type indicator. Jcounter can capture the timing of the trend collapse phase. There are signs of a trend collapse. It is the world standard to confirm the sign with LSMA adopted by Jcounter. The numerical setting of LSMA is very important, but after many years of verification, the numerical value was identified and completed. When the trend starts, the rising market moves like a support, and the falling market moves like a resistance. Gradually overtake the candlestick and
Axebagsh
Batsukh Sumchin Khuyagbaatar
Only work on Crude Oil H1  time frame  Swing follow trend.  do not trade against trends Specifies the first destination and entry and exit points For 16 years, I only traded on CrudeOil. Crude oil is one of the most extreme combinations in the world and it is safe to say that such a good indicator has never been made before.   This indicator will save you a lot of money because it introduces a new type of approach, Good luck
Forex Signal Generator is a cutting edge technology for Trend Trading, and filtering all inbuilt in one tool. The Signal Generator  analysis the market like a Pro  by using its smart algorithms to detect  the trend, filter out market noise  and display on  your chart with the : ENTRY, STOPLOSS AND TARGET PROFIT Advantages You Get     Access to the proven reliable trend indicator based     Easy and  effective trend detection.     Gives you the ability to filter  out  'NOISE' from the market  
Ferox Breakout
Tat Dat Nguyen
The breakout algorithm is a technique based on price, price features, to shape a breakout strategy. The strategy in this indicator will not be redrawn (none-repaint indicator), it is suitable for short or long term traders In the screenshot is the EURUSD pair, these currency pairs, commodities or stocks, it have similar strength *Non-Repainting (not redrawn) *For Metatrader4 Only *Great For Scalping *Great For Swing Trading *Arrow Entry, Green is Long, Red is Short *Works On Any Timeframe *Work
Premium support and resistance - the best combination of different indicators allowed us to create the best product on the market! And that's Premium support and resistance! A convenient and flexible tool that will help you in trading! Shows where the price will go from the support and resistance levels! The arrows Blue buy Red sell will help you with this! Alert is already built into the indicator for your convenience! Alert in order not to miss the "Own" signal! It is already configure
Caution!   This indicator is mainly for investors and medium term traders,  Day-trading is not possible! This is because correlation is a medium to long term thing.   Ideal use of this indicator is for currency Option sellers, where they can deploy sure fire profiable Option selling over few days to several weeks out. We provide further advice on this plus an optional hedge strategy idea and indicator on long time rentals*. This indicator keeps performing very well,  in all market conditions, 
MMM Gold Sniper
Gilang Wardhana Purnama Putra
Indicator is based on Market Maker Strategy. NO REPAINT. MM's are traders and their objective is to make money.  This includes strategies to trade against retails traders.  The major difference between them and other traders is that they have the ability, through access to massive volumes, to move price at their will.  So to make money, they aim to buy at a lower price and then sell at a higher price. They achieve this by:  1. Inducing traders to take positions. This is achieved by using a rang
IconTrade
Vadim Gorodetskii
Place the indicator on the chart, preferably with a timeframe of H1 or H4. If you are trading in the daily range or, conversely, on lower timeframes, you will need to adjust the RSI and ATR levels accordingly.  The blue arrows of the indicator will be a signal to open a long position, the red arrows will be a signal to open a short position: 1) Blue arrow for longs (growth) and red arrow for shorts (decline). 2) Two horizontal lines for current positions (one for entry and one for stop).  3
WARNING!! THIS SWORD IS TOO SHARP!    ONLY 10 COPIES LEFT FOR THE NEXT PRICE TO BE 8,000$ FOR UNLIMITED PLAN. Dear traders I am very glad once again to introduce to you my other tool called "Forex Sword Indicator". In short this tool is meant to give you an edge over the market that you have been waiting for  so long. Now, here it is. It is a very very simple tool but yet a dangerous sword. I call it a  Holy grail indicator!. I will not talk a lot about this tool. Just let the tool speak by itse
Dear Trader It is my pleasure to introduce to you my tool called the " Forex Sniper Indicator" . The major aim of this tool is to help serious traders and investors in all type of Financial Markets to catch price next movement right at the moment the price direction is about to change. This tool can be used to snipe the price direction in both down trend, uptrend and ranging markets. This tool can be used as the stand alone tool though it may be combined with other tools as well. My goal is to h
IconTradeSL
Vadim Gorodetskii
IconTradeSL.  Возможность выставлять sl по уровням. В индикаторе установлена возможность показывать историю уровней на графике. Возможность выставлять sl по уровням. Настройки индикатора: ЦВЕТ_BAR - цвет баров по которым ищем SL ЦВЕТ_Тек_BAR - Purple;//цвет текущего бара BAR - поиск в последних BAR барах (по умолчанию 200) show_bar - показывать бары по которым ищем SL
FxBears Super
Rachid Lafhil
FxBears Super – Advanced Trading Indicator for MQL4 Forex Bears Company is proud to introduce the FxBears Super , a cutting-edge trading indicator meticulously developed to enhance your Forex trading experience. After years of dedicated research, development, and sophisticated programming, FxBears Super stands as a revolutionary tool designed to transform your trading strategies and outcomes. Key Features of FxBears Super Unique and Comprehensive Strategy: Wave Analysis: Executes trades fro
IRDeS 1 0
Jan Carlos Pagano
**IRDeS(거리 및 스파이크 감지 지표)**는 거의 완벽한 타이밍으로 시장에 진입할 수 있는 힘과 제로로부터의 거리를 나타내는 지표입니다. 이는 제로로부터의 거리 및 변동성을 감지하는 파란색 연속 선과, 제로를 넘는 빨간색 히스토그램 및 제로 아래의 녹색 히스토그램으로 구성되어 특정 양초에서 거래의 강도와 힘을 측정하며 차트의 특정 지점에서 강력한 추진, 즉 "스파이크"를 생성합니다. IRDeS는 기술적 분석에 유용한 혁신적이고 다재다능한 도구로, 현대 상황에 적합하게 두 지표를 하나로 통합하여 시장 진입 후의 움직임의 힘의 품질을 측정할 수 있습니다. IRDeS의 명백한 장점에도 불구하고 다른 지표들과 마찬가지로, 분석가는 신중하게 행동하고 특정 차트 영역에 중점을 두어 다른 영역을 피해야 합니다. 특히 트레이더들은 이 지표를 초과매수 또는 초과매도 조건을 찾는 수단으로 사용하려 할 수 있지만, 이것이 항상 작동하는 것은 아닙니다. IRDeS는 어떤 값이든 가질 수 있기 때문에
Force Directional
Jan Carlos Pagano
포스 디렉셔널 지표 포스 디렉셔널 기술 지표는 가격 움직임의 상대적 강도를 측정하고 동시에 트렌드의 방향성을 식별하고 추적하는 데 도움이 되는 요소 세트를 모으는 아이디어에 기반합니다. 이 지표는 느린 오실레이터(검은 선), 빠른 오실레이터(회색 선) 및 지수의 중앙 선으로 작동하는 값이 감소한 신호 선(파란 선)으로 구성되어 있습니다. 이는 움직임의 반전을 식별하고 방향 가이드로도 작동합니다. 지표의 오실레이터는 100의 값 위나 아래로 이동하여 다른 기간 및 시간 프레임에서 마지막 가격의 종가와 이전 종가를 비교합니다. 이 지표는 특히 트렌드 반전을 식별하는 데 효과적이며 어떤 시간 프레임에서도 성공적으로 사용될 수 있습니다. 그러나 보다 정확한 결정을 내리기 위해 움직임이나 트렌드의 강도를 평가하기 위해 보다 긴 시간 프레임에서 사용하는 것이 좋습니다. 사용 방법: 권장되는 전략은 느린 오실레이터가 100보다 작은 값을 가지고 신호 선을 상향으로 통과할 때 매수 포지션
IA Trendx3 PRO
Marco Aurelio Santos Costa
What if God Created a Trade System? No miracles... Just see how mathematics can be effective in the market. We managed to combine technical analysis / price action into indicators, creating the best setup for trading, be it in Forex, Indices, or stocks. It took us 2 years to create something that really works, and now it's time for you to discover it. TrendX3 is a revolution in trend analysis. Based on advanced algorithms and real-time data, it provides valuable insights so that you can make inf
The 10PIPS Dynamite
Stephen Kehinde Kuku
The 10PIPS Dynamite is a semi-automated  cutting-edge Forex indicator designed to    automatically revolutionize your trading skills from a being a losing trader to becoming a profitable trader simply by Scalping   10 pips per Trade setup generated by the software. 10PIPS Dynamite Indicator once attached on the main chart it starts an in-depth market analysis based on its unique in-built advanced algorithm which seamlessly combines powerful indicators, statistical analysis, and trend recognition
제작자의 제품 더 보기
Prometheus Smart Money is an indicator that combines both price & volume with calculations based on other custom indicators, smart volume and retail volume to create this leading indicator that gives you high probability moves to help you make a decision on what is MOST likely to happen in the market going forward Advantages You can use it in ALL financial markets including binary options on ALL asset classes or instruments. You can use it as a stand alone indicator or as a confirmation tool wit
Centaurus Trend Engine is an indicator that uses custom indicators to give the current momentum moves of the market with a multi-timeframe approach to trading Features Value Area -It is the (red/green) rectangular box on your chart based on the dynamic structure period set;Green to indicate you focus on LONG moves & Red for SHORT moves Analysis - Displays The Market Analysis Strength - Displays The Market Strength Trend - Displays The Market Trend Entry State - Displays the BEST entry time for t
Primus Smart Money is an indicator that shows the average of bulls and bears on an asset. Used as a confirmation indicator for bullish and bearish control to assist in predicting future price moves Advantages Used in ALL financial markets including binary options on ALL asset classes or instruments. To be used as a confirmation tool with other indicators Parameters Period - default set to 9 (Recommended) Entry requirements Focus on the clusters on the indicator - the height or depth of the bars
Primus Trading Engine is a trading system that combines price action,ratio based indicators & custom indicators to create this leading indicator with a multi-timeframe approach to give you high probability trade setups for forex,CFD cash/futures,metals & binary option to assist in making predictions on what is MOST likely to happen in the market Main Chart Features Price Action Signal-Arrow displayed on a specific bar;NOT buy/sell arrow;DOES NOT repaint;Bullish arrow on a bullish bar,price is l
Prometheus Trade Engine is an indicator that combines price action, ratio based indicator with custom indicators& other lagging indicators to create this leading indicator that has a multi-timeframe approach to trading so that you are able to see what other timeframes are doing all in one chart and give you high probability trade setups to assist you to make a prediction on what is MOST likely to happen in the market going foward Chart Features 1. Reversal Zone It is the rectangular box on you
필터:
리뷰 없음
리뷰 답변
버전 21.3 2025.05.06
Improvements to market info & structure code
버전 21.2 2025.04.24
Improvements to market info code
Improvements to volume pressure code
버전 21.1 2025.04.16
Fixed issues of structure display on chart
버전 21.0 2025.04.13
Updated volume pressure code
버전 20.9 2025.02.04
Fixed an issue with namiri breach entry criteria
버전 20.8 2025.02.04
Added a filter to the entry criteria on all namiri trade setups
버전 20.7 2025.01.31
Improvements to support & resistance code
버전 20.6 2025.01.22
Adjustment to the volume pressure period
버전 20.5 2025.01.18
Improvements to volume pressure calculations
버전 20.4 2025.01.17
Improvements to volume pressure calculations
버전 20.3 2025.01.07
Fixed issues with structure display (support & resistance)
Minimum of 1000 bars is required on your chart
버전 20.2 2025.01.06
No trade focus, No structure displayed
버전 20.1 2025.01.04
Fixed the error in the namiri burrow trade alert
버전 20.0 2025.01.03
Renamed the namiri buddle trade setup to namiri burrow trade setup
버전 19.9 2024.12.12
Changes to the volume pressure code
버전 19.8 2024.12.11
Added a filter to the entry criteria on all setups
버전 19.7 2024.12.09
Improvements to volume pressure code
버전 19.6 2024.12.05
Improvements to the market info & volume pressure code
버전 19.5 2024.11.27
Rectified the error in namiri buddle entry criteria
버전 19.4 2024.11.26
Improvements to market info code
버전 19.3 2024.11.21
Fixed the issue with namiri bounce setup
버전 19.2 2024.11.21
Fixed an issue with the namiri breach entry criteria
버전 19.1 2024.11.20
Fixed the error in namiri buddle setup
버전 19.0 2024.11.19
Modified entry criteria for namiri bounce, breach & buddle setups
버전 18.9 2024.11.14
Fixed the issue with volume pressure reading
버전 18.8 2024.11.14
Improvements to volume pressure calculations
버전 18.7 2024.11.01
Removed inside & outside the wire markers
버전 18.6 2024.10.31
Added inside & outside the wire labels & markers to highlight the analysis limit (ONLY focus on volume pressure within the inside & outside the wire)
버전 18.5 2024.10.31
Improvements to market info & structure code
버전 18.4 2024.10.29
Improvements to structure & volume pressure code
버전 18.3 2024.10.28
Removed version number from the title
Improvements to volume & structure code
버전 18.2 2024.10.25
Improvements to structure & volume pressure codes
Modified entry criteria for namiri bounce, breach & buddle setups
버전 18.1 2024.10.15
Improvements to volume pressure code
버전 18.0 2024.10.15
Improvements to structure & volume pressure codes
버전 17.9 2024.10.07
Improvements to volume pressure code
버전 17.8 2024.10.02
Improvements to structure code
버전 17.7 2024.10.02
Improvements to structure code
버전 17.6 2024.09.24
Updated namiri breach setup entry criteria
버전 17.5 2024.09.20
Updated risk management tool
Updated volume pressure code
Updated structure code
버전 17.4 2024.09.02
Changes to entry zone on the risk management tool
Changes to entry criteria on all namiri trade setups
Changes to structure & volume pressure calculations
버전 17.3 2024.07.10
Adjusted the risk analysis period to 100
Adjusted the entry criteria to namiri breach setup
버전 17.2 2024.07.02
Adjusted the risk analysis period to 200
Improvements to structure code
Improvements to volume pressure calculations
버전 17.0 2024.06.11
Improvements to volume pressure code
버전 16.9 2024.06.08
Modified structure code
Simplified entry criteria for namiri bounce | breach | defense | strike setups
버전 16.8 2024.05.23
Added an adjustable maximum pip risk per trade parameter
Improvements to volume pressure code & re-added namiri defense setup
버전 16.7 2024.05.05
Removed namiri defense setup
Simplified entry criteria for namiri bounce, breach & strike setups
Improvements to structure to include broken support & resistance
Improvements to volume pressure calculations
버전 16.6 2024.03.19
Fixed a critical error on structure support & resistance code
버전 16.5 2024.03.19
Removed volume analysis limit
버전 16.4 2024.03.16
Improvements to volume pressure calculations
버전 16.3 2024.03.14
Improvements to structure to show broken support & resistance
버전 16.2 2024.03.12
Adjustments to the volume pressure period
버전 16.1 2024.03.07
Set market info & volume info analysis limit to 200 bars
The first 100 volume pressure bars represents "inside the wire"
The last 100 volume pressure bars represents "outside the wire"
버전 16.0 2024.02.28
Modified market info calculations
Modified volume pressure calculations
Added a filter to the entry criteria for all namiri trade setups
버전 15.9 2024.02.12
Modified entry criteria for namiri breach setup
Improvements to volume pressure calculations
버전 15.8 2024.01.29
Modified entry criteria for namiri defense setup
Improvements to volume pressure calculations
버전 15.7 2024.01.25
Modified entry criteria for namiri strike setup
Modified volume pressure calculations
버전 15.6 2024.01.25
Modified volume info calculations
Modified structure code
버전 15.5 2024.01.18
Modified entry criteria for namiri strike setup
Modified volume info calculations
버전 15.4 2023.12.01
Re-added namiri strike trade setup
Modified market info calculations
Modified entry criteria for all namiri trade setups
버전 15.3 2023.11.09
Modified volume pressure calculations
버전 15.2 2023.10.30
Removed strike trade setup
Modified entry criteria for breach & defense trade setups
버전 15.1 2023.10.23
Modified volume pressure calculations
버전 15.0 2023.10.18
Modified volume pressure calculations
Modified alerts on all trade setups
버전 14.9 2023.09.23
Added namiri strike trade setup
Improvements to support & resistance structure calculations
Added trade setup parameter options
Changed parameter options display
버전 14.8 2023.09.15
Modified analysis period
Modified namiri bounce setup
버전 14.7 2023.08.28
Modified namiri breach & namiri defense entry setups
버전 14.6 2023.08.25
Modified namiri bounce, namiri breach & namiri defense setups
버전 14.5 2023.08.02
Improvements to support & resistance code
버전 14.4 2023.07.24
Modifications to namiri breach & namiri defense entry setups
버전 14.3 2023.07.14
Fixed trade info -- commission, swap & stop loss display errors
버전 14.2 2023.07.12
Improvements to support & resistance code
버전 14.1 2023.07.11
Improvements to volume pressure calculations
버전 14.0 2023.07.10
Modified market info calculations
Modified volume pressure calculations
Added entry criteria for 3 entry setups (namiri bounce, namiri breach & namiri defense)
버전 13.9 2023.06.02
Modified market info calculations
Modified volume pressure calculations
Modified entry criteria
버전 13.8 2023.05.25
Updated entry criteria
버전 13.7 2023.05.19
Fixed issues in structure code
Modifications to volume pressure code
버전 13.6 2023.05.11
Modified entry criteria
Modified focus hooks
버전 13.5 2023.04.27
Improvements to market info to include fast market response
Improvements to volume info to include a longer analysis period
Improvements to structure calculations to include a longer analysis period
버전 13.4 2023.04.12
Improvements to volume pressure code
버전 13.3 2023.04.05
Added a filter to the entry criteria
Improvements to the volume pressure code
버전 13.2 2023.03.28
Removed momentum tag
버전 13.1 2023.03.22
Improvements to volume pressure code
Added momentum tag
버전 13.0 2023.03.21
Improvements to volume pressure code
버전 12.9 2023.03.16
Improvements to volume pressure code
버전 12.8 2023.03.15
Improvements to structure code
버전 12.7 2023.03.09
Changes to focus hooks on market info
버전 12.6 2023.03.09
Increased analysis period range to improve on chart analysis
Modification to display of focus hooks on market info
버전 12.5 2023.02.28
Removed volume pressure threshold levels
버전 12.4 2023.02.23
Improvements to structure calculations to only show verified levels
버전 12.3 2023.02.22
Modifications to market info & volume info
Replaced volume pressure threshold level 30 with level 15
버전 12.2 2023.02.21
Modifications to volume pressure
버전 12.1 2023.02.20
Removed volume pressure threshold level
Modification to market info focus hooks
버전 12.0 2023.02.17
Added volume pressure threshold level 30
Added the minimum 10 pip risk to entry criteria
버전 11.9 2023.02.16
Removed volume pressure threshold level
Removed the10 pip minimum risk entry criteria
버전 11.8 2023.01.26
Changed structure from dynamic to static
Removed daily, weekly, monthly dynamic structure
Removed daily, weekly, monthly market info direction bias
Removed momentum tag
Added focus hooks on market info
Added volume pressure threshold of level 30 to assist in monitoring the bull & bear fight
버전 11.7 2022.12.07
Modifications to structure to include daily, weekly & monthly structure as well as their open (depending on which time frame you are on)
Modifications to volume pressure calculations to confirm if you have a valid setup
Modifications to market info to give you direction bias based on structure & daily, weekly or monthly open (depending on which time frame you are on)
버전 11.6 2022.11.11
Changed structure from fixed to dynamic
Added momentum tag to identify whether price is oscillating bullish | bearish
버전 11.5 2022.10.26
Modifications to analysis period
Modifications to market info calculations
Modifications to volume pressure calculations
Modifications to potential entry alert criteria
버전 11.4 2022.10.06
Modifications to volume info range
Modifications to entry alert criteria
버전 11.3 2022.09.29
Modifications to volume pressure calculations
Modifications to trade entry alert criteria
Reduced the default risk to 0.5%
버전 11.2 2022.09.27
Modifications to market info calculations
Modifications to volume info calculations
Modifications to structure calculations
버전 11.1 2022.09.14
Modifications to analysis period
Modifications to market info calculations
Doubled volume pressure analysis range
버전 11.0 2022.08.26
Modifications to entry criteria
Modifications to structure calculations
Modifications to market info calculations
Modifications to volume pressure calculations
Removed volume level threshold
버전 10.9 2022.08.19
Modifications to entry criteria
Modifications to market info calculations
Modifications to volume info calculations
Modification of volume level threshold from 15 to 100
버전 10.8 2022.08.09
Removed trend stripes
Modifications to entry criteria
Modifications to market info calculations
Modifications to volume info calculations
Added volume level 15 threshold
버전 10.7 2022.08.03
Removed average tag
Added trend stripes to market info to highlight overall market focus
Modifications to analysis period
Modifications to market info calculations
Modifications to structure calculations
Modifications to entry criteria
버전 10.6 2022.08.01
Added the average tag
Modifications to market info calculations
Modifications to volume pressure calculations
Modifications to entry criteria
버전 10.5 2022.07.30
Modifications to volume pressure calculations
Removed threshold level
Removed maximum volume level
버전 10.4 2022.07.27
Modifications to volume pressure calculations
Changed the volume pressure threshold from 25 to 30
Set the fixed maximum volume pressure to 60
버전 10.3 2022.07.26
Modifications to market info calculations
Added 25 level volume pressure threshold
버전 10.2 2022.07.24
Modifications to volume pressure calculations
버전 10.1 2022.07.22
Removed psychological structure
Removed moving average tag
Modifications to entry criteria
버전 10.0 2022.07.18
Changed from dynamic structure to fixed psychological structure levels
Removed bullish, bearish & neutral color change option
Default percent risk set to 1.0
버전 9.9 2022.06.21
Modifications to market info calculations
Changes in entry criteria
버전 9.8 2022.05.17
Changed banner to highlight trade risk relative to structure range
버전 9.7 2022.05.17
Added more structure levels
Added a banner to highlight no trading with narrow structure range
버전 9.6 2022.05.13
Added structure level to the entry criteria
Removed "pending" market info
버전 9.5 2022.05.06
Added a 200 MA close level tag on the chart
Added the MA to the entry criteria
버전 9.4 2022.05.05
Reduced the number of structure levels
Renamed the structure levels
Removed "pending" market info condition
Changes to entry criteria
버전 9.3 2022.05.04
Changed labels on levels to include overall structure focus
Changed structure level period as well as period visibility
Changed market info calculations
Included "pending" market condition to market info meaning "no trade zone"
Changed risk management period
Changed entry criteria parameters
버전 9.2 2022.04.28
Changed structure period
Included structure labels
버전 9.1 2022.04.27
Changed dynamic structure period
Changed structure zones to structure levels
버전 9.0 2022.04.26
Fixed structure code label issue
Fixed entry criteria errors
버전 8.9 2022.04.26
Removed some dynamic structure levels
Changed from structure level to structure zone
Change structure period
Changed market info calculations
Changed volume info period
Changed risk management period
버전 8.8 2022.04.21
Changed structure levels to structure zones
Changed analysis period, volume info & structure periods
Changed entry criteria
버전 8.7 2022.04.20
Changed structure from static to dynamic
Changed volume info calculations
버전 8.6 2022.04.14
Changed from dynamic structure to fixed structure
버전 8.5 2022.04.13
Renamed structure levels
Changed volume period
버전 8.4 2022.04.08
Added structure labels to know where price is on the chart
Modified entry criteria
Changed trade range to structure range
버전 8.3 2022.04.06
Changed period to volume info calculations
Added a filter to entry criteria
버전 8.2 2022.04.04
Complete structure overhaul from static to dynamic
Improvements to market info calculations
Minor adjustment to the entry criteria
Removed redundant code
버전 8.1 2022.03.30
Cleaned up the overall code by removing outdated code
Improvements to structure calculations for a slightly more high probability structure zones
버전 8.0 2022.03.30
Modified period to market info calculations
Adjustments to risk management tool
Modified period to volume info calculations
Modified period to structure calculations
버전 7.9 2022.03.25
Improvements to market info & volume info calculations
버전 7.8 2022.03.22
Improvements to volume info calculations
버전 7.7 2022.03.21
Improvements to market info calculations
버전 7.6 2022.03.16
Removed probability factor to buy & sell contract
Modifications to volume info
버전 7.5 2022.03.16
Modifications to volume info
Added a probability factor to buy & sell contracts
버전 7.4 2022.03.15
Improvements to market info calculations & risk management tool
버전 7.3 2022.03.14
Modifications to risk management tool
버전 7.2 2022.03.12
Modifications to risk management & volume info
버전 7.1 2022.03.11
Improvements to market info calculations
버전 7.0 2022.03.04
Fixed entry alert criteria
Improvements to market info calculations
버전 6.9 2022.03.04
Restructured the risk management tool for high probability trade setups
버전 6.8 2022.03.01
Improvements to volume info calculations
버전 6.7 2022.02.26
Revert from dynamic structure to fixed structure
버전 6.6 2022.02.23
Changes to structure naming
Extended structure period
버전 6.5 2022.02.22
Complete structure overhaul from static to dynamic
Improvements to market info & volume info calculations
Minor adjustment to the entry criteria
버전 6.4 2022.02.18
Improvements to market info calculations
버전 6.3 2022.02.18
Added a filter on the entry criteria
버전 6.2 2022.02.11
Improvements to structure calculations
버전 6.1 2022.02.10
Improvements to volume calculations
Modifications to entry criteria
버전 6.0 2022.01.31
Modified structure calculations
Changed volume pressure chart presentation
버전 5.9 2022.01.17
Minor adjustments to volume info calculations
버전 5.8 2022.01.17
Modifications to volume info calculations
버전 5.7 2022.01.04
Modification to market info calculations
버전 5.6 2021.12.23
Adjustments to analysis period
Modifications to market info
버전 5.5 2021.12.17
Modified time delay between alerts
Improvements to market info calculations
버전 5.4 2021.12.14
Modifications to market info calculations
버전 5.3 2021.12.13
Improvements to structure code
Modified trade entry criteria
버전 5.2 2021.12.11
Improvements to structure calculations
Modified entry criteria
Bug fixes
버전 5.1 2021.12.06
Improvements to structure calculations
Modifications to volume calculations
버전 5.0 2021.12.01
Improvements to market info calculations
Modifications to structure code
Added levels to volume info
버전 4.9 2021.11.26
Removed adjustable analysis period
버전 4.8 2021.11.26
Complete change to volume pressure calculations
Improvements to market info calculations
버전 4.7 2021.11.02
Modified entry criteria
Changed default color theme
Volume bar width set to 3
버전 4.6 2021.10.26
Fixed minor bug
버전 4.5 2021.10.22
Improvements to market info calculations
Stretched the volume info mapping to twice the analysis range
버전 4.4 2021.10.18
Modified market info, volume info & entry alert criteria
버전 4.3 2021.10.15
Modifications to market info calculations
Maximum analysis period allowed set to 200
버전 4.2 2021.10.14
Slight modification to structure calculations
버전 4.1 2021.10.13
Modified volume info calculations
Modified structure calculations
Maximum analysis period allowed in 300
버전 4.0 2021.09.29
Low severity bug fixed
Default analysis period set is 100
Minimum analysis period allowed is 20
Maximum analysis period allowed is 500
버전 3.9 2021.09.17
Removed average tag on chart
Modified entry criteria to include average tag as an additional filter
버전 3.8 2021.09.16
Set default analysis period to 180
Set the volume bars width to 2
버전 3.7 2021.09.13
Added a tag to show the moving average on your chart
버전 3.6 2021.08.18
Changes to volume calculations
Default analysis period set to 100
버전 3.5 2021.08.06
Adjustable analysis period
Analysis period default set to 200
버전 3.4 2021.08.06
Analysis period set to 50
버전 3.3 2021.06.25
Restored static structure
Removed dynamic structure
Removed long & short trading zones
버전 3.2 2021.06.24
Replaced dynamic structure with dynamic long & short trading zones
Changed line style on both the chart & the left hand panel
버전 3.1 2021.06.15
Volume info modifications
버전 3.0 2021.06.07
Modified volume calculations
버전 2.9 2021.06.04
Changed structure labels
버전 2.8 2021.05.27
Changes to line style for better visuals
버전 2.7 2021.05.26
Changed market info response from static to dynamic
버전 2.6 2021.05.25
Modification to market info calculations
Modification to entry criteria
Modification to structure period & levels
버전 2.5 2021.05.21
Complete overhaul of the entire structure system from static to dynamic
Removed analysis & volume period parameter changes - all are now pre-coded
Improvements of volume calculations
Changes to chart labels
버전 2.4 2021.05.07
Rectified volume info calculations
버전 2.3 2021.05.06
Modified volume info calculations
버전 2.2 2021.05.06
Modified entry criteria
버전 2.1 2021.05.04
Improvements to structure calculations
버전 2.0 2021.04.27
Improvements to volume info calculations
Added labels to risk management levels [take profit, entry zone & stop loss]
버전 1.9 2021.04.20
Adjustable volume period
버전 1.8 2021.04.20
Corrections to structure analysis
Adjustable analysis period with default set to 50 bars
버전 1.7 2021.04.17
Modified structure calculations
버전 1.6 2021.04.16
Analysis period & trade signal is set to non-adjustable
버전 1.5 2021.04.15
Adjustments to volume info calculations
Analysis period default set to 100 bars
버전 1.4 2021.04.14
Analysis period default set to 200 bars
버전 1.3 2021.04.07
Added volume info bars
Structure is now set to always show on chart
버전 1.2 2021.03.27
Modified Alert Parameters
버전 1.1 2021.03.24
Adjusted Market Info Calculations