KT Support Resistance EA MT4

KT Support Resistance EA trades bounces only from the support and resistance levels where price has reversed its direction many times in the past. Every level carries a Reversal Chance: out of all the times price reached that level, the share of times it reversed instead of breaking through. The EA trades a bounce only when the Reversal Chance is high. Each trade opens with a stop loss beyond the zone and a take profit at the next opposing level.

Five tested settings built in

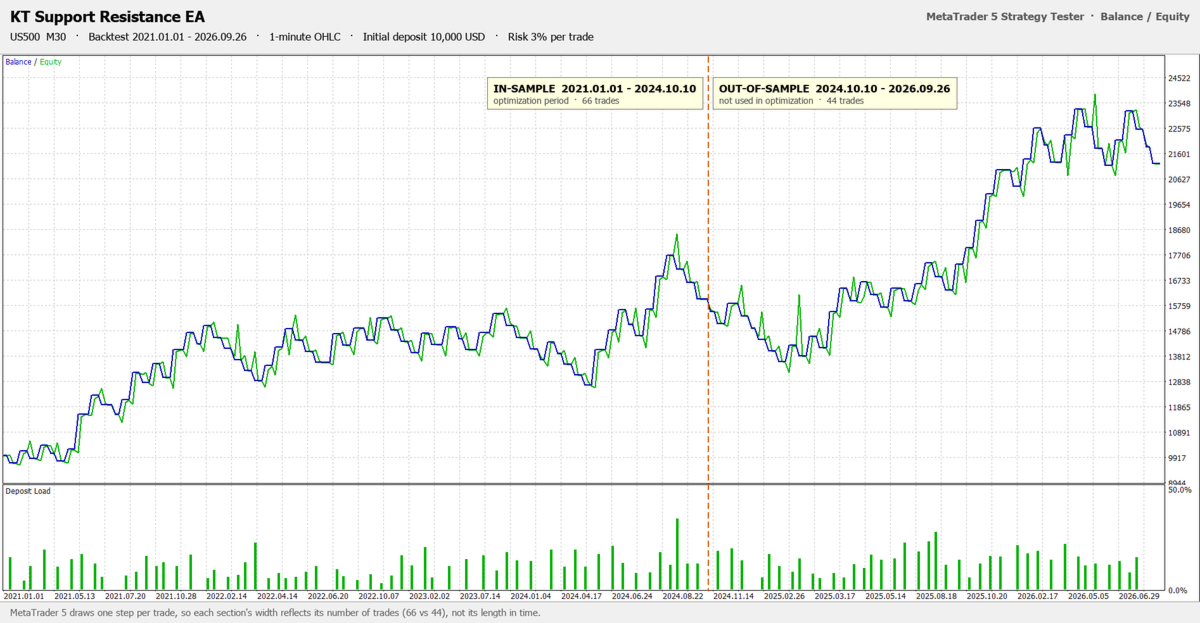
Choose JP225 M30, JP225 H1, US500 M30, US30 M30 or DE40 H1 in the Settings input, attach the EA to that chart, set your risk, and it trades the settings that were tested on those markets. Choose Custom to set every filter yourself. The backtest results of the tested settings are in the screenshots.

How it trades a bounce

The EA finds levels on the monthly, weekly, daily and chart timeframes: swing highs and lows, pivots, the previous day, week and month prices, order block midpoints and Smart Zones. These are the same levels as KT Auto Support Resistance Levels Indicator, and the indicator is not needed.

When a candle dips into a support zone and closes back above it, the EA buys at that close (and the mirror for resistance). Only closed candles count, so a wick that is still forming never opens a trade. The stop loss goes beyond the zone and beyond the wick, and the target is the next opposing level, as long as the reward is large enough for the risk.

Why traders choose it

  • Only proven levels: a level that price broke through too often is left alone, however good it looks on the chart.
  • A full plan from the first second: stop loss and take profit are set on every trade, and the stop loss moves to break even once the trade is far enough in profit.
  • The same risk on every trade: the lot size comes from the stop loss distance and your Risk Percent per Trade, or a fixed lot if you prefer it.
  • A daily loss limit that follows your risk: after a set number of losses in a day, the chart stops trading until the next day. Trades per day and open trades are limited too.
  • No grid, no martingale and no averaging: one trade per level per day, and if a stop loss is ever removed, the EA puts it back or closes the trade.
  • Careful with your account: a new trade never takes the margin level below 150%, and a lot above the broker's maximum is split into parts and managed as one trade.
  • Always informed: the panel shows the nearest support and resistance with their Reversal Chance, the EA's state and a PAUSE button, with pop-up, push and email alerts on every open and close.


Recommendations

JP225, US500, US30 and DE40 with the matching settings (your broker may call them NI225, SPX500, DJ30 or GER40), on hedging or netting accounts. Set Max bars in chart to 100000 or more so the EA sees enough history for the monthly and weekly levels. Each tested setting has its own Magic Number, so two of them can run on the same account. A VPS keeps the EA running around the clock.

Input parameters

  • Settings: JP225 M30, JP225 H1, US500 M30, US30 M30, DE40 H1 or Custom.
  • Levels and level engine: which level types to use, the pivot type, and the swing, order block and Smart Zone settings of the indicator.
  • Level filters: Minimum Reversal Chance, Minimum Number of Touches, and whether fresh levels are traded.
  • Entry modes: bounces, break and retest, and a minimum rejection wick.
  • Stop loss and take profit: stop loss mode and distance beyond the zone, take profit mode (next opposing level, level ladder or fixed points), minimum reward to risk and target level filters.
  • Risk: lot mode, Risk Percent per Trade, trades per day, open trades, daily loss limit and trades per level per day.
  • Trade management: break even, break even lock, level ladder percent and an ATR trailing stop.
  • Filters: trading hours, maximum spread, Friday close, higher timeframe trend filter and maximum slippage.
  • Panel and alerts: panel, levels on the chart, pop-up, push and email alerts, Magic Number and trade comment.


Trade the levels where price turns

Pick a tested setting, attach KT Support Resistance EA to its chart, and let it trade the support and resistance levels where price has reversed its direction many times before, with a stop loss and a target on every trade.

Другие продукты этого автора
KT Auto Support Resistance Levels: мультитаймфреймовые уровни S&R, умные зоны и панель уровней для MetaTrader 4/5 Свинг-хай. Пивоты. Ордер-блоки. Предыдущие максимумы и минимумы. Каждый трейдер размечает рынок немного по-своему, и в итоге страдает сам график. Если наложить на один экран слишком много методов, он перестает быть картой. Он превращается в шум. KT Auto Support Resistance Levels решает эту проблему. Индикатор одновременно сканирует месячный, недельный, дневной и текущий таймфрейм, а
ACB Breakout Arrows MT5
KEENBASE SOFTWARE SOLUTIONS
3.5 (2)
Сигналы пробоя с учетом торгового контекста ACB Breakout Arrows определяет фазу затишья цены, за которой следует направленный пробой, и отмечает сетап стрелкой покупки или продажи. Стрелка указывает на обнаруженную модель пробоя. Она не гарантирует, что каждый сигнал превратится в крупное движение. Стрелка покупки отмечает бычий сетап пробоя, а стрелка продажи отмечает медвежий сетап. Цена может повторно протестировать область пробоя или вернуться в предыдущий диапазон, поэтому перед входом оцен
ACB Trade Filter MT5
KEENBASE SOFTWARE SOLUTIONS
Перед открытием сделки ACB Trade Filter помогает ответить на один практический вопрос: рынок поддерживает эту сделку или вы пытаетесь войти при противоречивых условиях? Индикатор анализирует настроение рынка и тренд, а затем показывает результат с помощью цветной гистограммы и направления тренда. Используйте его после появления обычного сигнала на вход, а не вместо него. Три состояния рынка с первого взгляда Зеленая гистограмма и бычий тренд: условия поддерживают поиск сделок на покупку по вашей
KT Auto Support Resistance Levels: мультитаймфреймовые уровни S&R, умные зоны и панель уровней для MetaTrader 4/5 Свинг-хай. Пивоты. Ордер-блоки. Предыдущие максимумы и минимумы. Каждый трейдер размечает рынок немного по-своему, и в итоге страдает сам график. Если наложить на один экран слишком много методов, он перестает быть картой. Он превращается в шум. KT Auto Support Resistance Levels решает эту проблему. Индикатор одновременно сканирует месячный, недельный, дневной и текущий таймфрейм, а
Если вы замечали, что цена обновляет максимум, а Stochastic не подтверждает это движение, вы уже понимаете, почему трейдеры следят за дивергенциями. KT Stoch Divergence отмечает такие расхождения прямо на графике, помогая находить возможные развороты и точки продолжения тренда без ручного построения линий. Индикатор определяет обычные и скрытые дивергенции между ценой и осциллятором Stochastic. Он дает дополнительный контекст, а не готовую команду на вход. Окончательное решение всегда остается з
ACB Breakout Arrows
KEENBASE SOFTWARE SOLUTIONS
4.15 (34)
Сигналы пробоя с учетом торгового контекста ACB Breakout Arrows определяет фазу затишья цены, за которой следует направленный пробой, и отмечает сетап стрелкой покупки или продажи. Стрелка указывает на обнаруженную модель пробоя. Она не гарантирует, что каждый сигнал превратится в крупное движение. Стрелка покупки отмечает бычий сетап пробоя, а стрелка продажи отмечает медвежий сетап. Цена может повторно протестировать область пробоя или вернуться в предыдущий диапазон, поэтому перед входом оцен
ACB Trade Filter MT4
KEENBASE SOFTWARE SOLUTIONS
5 (1)
Перед открытием сделки ACB Trade Filter помогает ответить на один практический вопрос: рынок поддерживает эту сделку или вы пытаетесь войти при противоречивых условиях? Индикатор анализирует настроение рынка и тренд, а затем показывает результат с помощью цветной гистограммы и направления тренда. Используйте его после появления обычного сигнала на вход, а не вместо него. Три состояния рынка с первого взгляда Зеленая гистограмма и бычий тренд: условия поддерживают поиск сделок на покупку по вашей
KT Momentum Arrows
KEENBASE SOFTWARE SOLUTIONS
KT Momentum Arrows отмечает стрелками бычьи и медвежьи импульсные пробои, когда свеча закрывается за пределами адаптивных ценовых полос. Полосы реагируют на отклонение цены и изменение волатильности. Синяя стрелка вверх подтверждает закрытие выше верхней полосы, а красная стрелка вниз подтверждает закрытие ниже нижней полосы. После закрытия свечи сигнал фиксируется, поэтому при последующем просмотре графика стрелка не переносится на другой бар. Что показывает стрелка Стрелка отмечает свечу, на к
KT COG Advanced MT4
KEENBASE SOFTWARE SOLUTIONS
1 (1)
KT COG is an advanced implementation of the center of gravity indicator presented by John F. Ehlers in the May 2002 edition of Technical Analysis of Stocks & Commodities magazine. It's a leading indicator which can be used to identify the potential reversal points with the minimum lag. The COG oscillator catches the price swings quite effectively. MT5 version of the same indicator is available here KT COG Advanced MT5 Calculation of COG The COG indicator is consist of the two lines. The main l

KT Pin Bar
KEENBASE SOFTWARE SOLUTIONS
KT Pin Bar identifies the pin bar formation which is a type of price action pattern which depicts a sign of reversal or rejection of the trend. When combined with support and resistance, BRN and other significant levels, Pin Bar pattern proved to be a very strong sign of reversal. Basically, a pin bar is characterized by a small body relative to the bar length which is closed either in upper or lower 50% part of its length. They have very large wicks and small candle body. A pin bar candlestic
KT Trend Magic
KEENBASE SOFTWARE SOLUTIONS
Определяйте направление тренда прямо на графике KT Trend Magic объединяет импульс и волатильность в цветной линии, которая следует за ценой. Линия непрерывно показывает текущее состояние тренда и меняет цвет при смене расчетного направления. Зеленая линия: показывает бычье состояние тренда. Красная линия: показывает медвежье состояние тренда. Смена цвета: отмечает новый переход направления на графике. Во время устойчивого движения линия также может служить динамическим ориентиром для откатов и п
KT Auto Fibo
KEENBASE SOFTWARE SOLUTIONS
Auto Fibonacci indicator that draws the Fibonacci retracement on the swing you are looking at, and redraws it the moment you zoom or scroll the chart. Zoom in on a pullback and the levels measure that pullback. Zoom out and they measure the whole trend. There are no anchor points to drag and no levels to redraw after every new high. Key features Measures the highest high and the lowest low on your screen, the current candle included. Follows zoom, scroll and window size at once, even when the ma
KT Psar Arrows
KEENBASE SOFTWARE SOLUTIONS
KT Psar Arrows строит стрелки на графике с использованием стандартного индикатора Parabolic SAR. Восходящая стрелка отображается, когда максимум свечи касается линии SAR. Нисходящая стрелка появляется, когда минимум свечи касается линии SAR. Сигналы генерируются в реальном времени без ожидания закрытия бара.  Особенности Полезный инструмент для трейдеров, которые хотят экспериментировать с торговыми стратегиями, включающими использование индикатора Parabolic SAR.  Можно использовать для поиска
KT Ichimoku Trader
KEENBASE SOFTWARE SOLUTIONS
1 (1)
Пять стратегий Ишимоку с автоматической торговлей KT Ichimoku Trader является торговым советником (Expert Advisor), который автоматически открывает и закрывает сделки по пяти классическим стратегиям Ichimoku Kinko Hyo. Вы включаете нужные стратегии, и каждая торгует самостоятельно: со своими правилами входа, своими правилами выхода и не более чем одной открытой сделкой на стратегию одновременно. Каждый вход проверяется по закрытой свече. Когда открывается новая свеча, советник читает только что
Осциллятор волатильности KT анализирует прошлые и текущие рыночные данные с помощью математической формулы, отображая результат в виде осциллятора. Растущие и снижающиеся волны соответствуют высокой и низкой волатильности актива.  Проще говоря, волатильность — это измерение колебаний цены актива за определённый период времени. Без волатильности на рынке было бы мало движения, и трейдеры не могли бы зарабатывать на изменениях цен. Использование волатильности на рынке Форекс Использование волатил
KT COG Robot
KEENBASE SOFTWARE SOLUTIONS
KT COG Robot is a fully automated Expert Advisor based on the KT COG Indicator . The COG indicator was originally presented by John F. Ehlers in the May 2002 edition of Technical Analysis of Stocks & Commodities magazine. The EA fires a long trade when COG line cross above the signal line and a short trade is fired when the COG line cross below the signal line.  Adaptive Filtration Our adaptive filtration algorithm combines the original COG formula with the major trend direction and market acce
ACB Breakout Arrows EA
KEENBASE SOFTWARE SOLUTIONS
Автоматизируйте торговлю по пробоям ACB ACB Breakout Arrows EA анализирует пробойные сигналы на текущем графике и управляет сделками с помощью встроенной логики ACB Breakout Arrows и ACB Trade Filter. Установите советник на символ и таймфрейм, которые хотите отслеживать, разрешите автоматическую торговлю, затем выберите правила для объема позиции, сессий, фильтров и выходов в соответствии с вашим планом тестирования. Необходимые индикаторы и зависимости уже встроены в советник, поэтому отдельная
KT Asian Breakout
KEENBASE SOFTWARE SOLUTIONS
4 (1)
KT Asian Breakout carefully analyzes the range-bound market during the Asian session and then fires a long or short trade after doing some preassessment based on its inbuilt technical analysis module. The executed orders are closed within a day before the completion of the next day session. The inbuilt technical analysis module checks for the session range and compares it with the last 20 days price movement. If it finds any erratic price movement within the session, the orders are not executed
KT London Breakout
KEENBASE SOFTWARE SOLUTIONS
First thirty minutes are essential for a trading session. The early reaction of traders and market players sets a path for the rest of the day. KT London Breakout EA takes advantage of this phenomenon, and after analyzing the first thirty minutes of London session, it places two bidirectional pending orders. One of pending order is eventually canceled after realizing the market direction with certainty. It has been strictly tested and developed for EUR/JPY using 30-Min Time Frame. You can expe
Currency strength and pair correlation in one indicator KT Currency Strength and Correlation ranks the eight major currencies from strongest to weakest and shows, in a colored matrix, how closely ten currency pairs of your choice move together. Before you open a trade from your own strategy, you can check whether the two currencies of the pair are really moving apart, and whether the new trade adds risk to a trade you already hold. What you see on the chart Strength lines: a separate window belo
MACD Divergence Seeker
KEENBASE SOFTWARE SOLUTIONS
KT MACD Divergence Seeker trades the regular and hidden divergence signals generated by our free indicator named KT MACD Divergence indicator. Trading the standalone divergences can be a risky affair that's why the KT MACD Divergence Seeker combines the standard divergence signals with an advanced analysis module to exploit the price inefficiencies on some FX pairs. What is the Divergence exactly? As a general conception if the price is making higher highs, then macd should also be making hig
Отмечайте диапазон азиатской сессии KT Asian Breakout Indicator отмечает максимум и минимум четырехчасового окна азиатской сессии и отслеживает цену после завершения диапазона. Параметр GMT Offset согласует время сессии с серверным временем вашего брокера, а Draw Session Box управляет отображением диапазона на графике. Следите за пробоем и торговыми уровнями вместе Бычья стрелка появляется, когда цена закрывается выше максимума сессии. Медвежья стрелка появляется, когда цена закрывается ниже мин
MACD Divergence MT4
KEENBASE SOFTWARE SOLUTIONS
KT MACD Divergence показывает обычные и скрытые дивергенции, возникающие между ценой и осциллятором. Если ваша торговая стратегия предполагает разворот тренда, вы можете использовать обычную дивергенцию MACD для определения возможных точек разворота. А если вы придерживаетесь стратегии продолжения тренда, то скрытая дивергенция MACD будет подходящим решением. Ограничения KT MACD Divergence Использование дивергенции MACD как единственного сигнала входа может быть рискованным. Не каждую диверген
KT Bollinger Bands Trader — это полностью автоматизированный эксперт-советник, реализующий стратегию торговли на возврат к среднему значению с использованием полос Боллинджера в периоды низкой волатильности. Цена часто реагирует на верхнюю или нижнюю линию полос Боллинджера, однако разворот происходит не всегда. Тем не менее, вероятность разворота выше именно в условиях низкой волатильности. Входы Сделка на покупку открывается, когда цена корректно выстраивается ниже нижней полосы Боллинджера.
KT CCI Divergence MT4
KEENBASE SOFTWARE SOLUTIONS
KT CCI Divergence shows the regular and hidden divergence created between the price and CCI oscillator. Divergence is one of the vital signals that depicts the upcoming price reversal in the market. Manually spotting the divergence between price and CCI can be a hectic and ambiguous task. Limitations of KT CCI Divergence   Using the CCI divergence as a standalone entry signal can be risky. Every divergence can't be interpreted as a strong reversal signal. For better results, try to combine it w
Отслеживайте сглаженное состояние Heiken Ashi KT Heiken Ashi Smoothed преобразует движение цены в сглаженные синие и красные свечи. Синяя стрелка вверх появляется при переходе из медвежьего состояния в бычье, а красная стрелка вниз при переходе из бычьего состояния в медвежье. Благодаря этому смену направления легко заметить на графике. Период и метод сглаживания определяют степень сглаживания свечей. Индикатор дает более ровное представление движения, чем стандартный Heiken Ashi, и позволяет по
KT MA Crossover MT4
KEENBASE SOFTWARE SOLUTIONS
KT MA Crossover отображает стрелки покупки и продажи на основе пересечения выбранных скользящих средних. Кроме того, индикатор генерирует соответствующие оповещения и показывает значение MFE (наиболее благоприятное отклонение) для каждого нового сигнала. Стратегия пересечения скользящих средних является одной из самых популярных среди трейдеров по всему миру. Обычно она включает быструю и медленную скользящую среднюю, чтобы находить сигналы на покупку и продажу в зависимости от направления пере
KT Round Numbers MT4
KEENBASE SOFTWARE SOLUTIONS
KT Round Numbers plots the round number levels which are also commonly known as psychological levels in the Forex world. In the context of Forex trading, round number levels are those levels in which there are two or more zeroes at the end. They are named as 00 levels on the chart. Some traders also consider the halfway points as a valid round number level. They are named as 50 levels on the chart. Use of round number levels in trading Round number levels work as strong support and resistance
Despite the popularity of inside bar pattern among the traders, using it as a standalone signal doesn't provide any edge in the market. KT Inside Bar Advanced indicator solves this problem by combining the classic inside bar pattern with the "ECE" cycle and Fibonacci extensions. Using this indicator in place of our classic inside bar indicator will provide a tremendous advantage and edge in the market. What is the ECE cycle? In financial markets, the price never moves in a straight line but u
KT Inside Bar Hunter MT4
KEENBASE SOFTWARE SOLUTIONS
Despite the popularity of inside bar pattern among traders, using it as a standalone entry signal doesn't provide any evidentiary advantage. KT Inside Bar Hunter trades only selected inside bar patterns using some preassessment and ECE price action cycle. Trading Strategy On successful detection of the required pattern, EA places a pending order in the direction of the forecasted price expansion phase. Pending orders are canceled if they are not triggered within the next bar. Once triggered, ac
Фильтр:
Нет отзывов
Ответ на отзыв