KT Support Resistance EA MT4

KT Support Resistance EA trades bounces only from the support and resistance levels where price has reversed its direction many times in the past. Every level carries a Reversal Chance: out of all the times price reached that level, the share of times it reversed instead of breaking through. The EA trades a bounce only when the Reversal Chance is high. Each trade opens with a stop loss beyond the zone and a take profit at the next opposing level.

Five tested settings built in

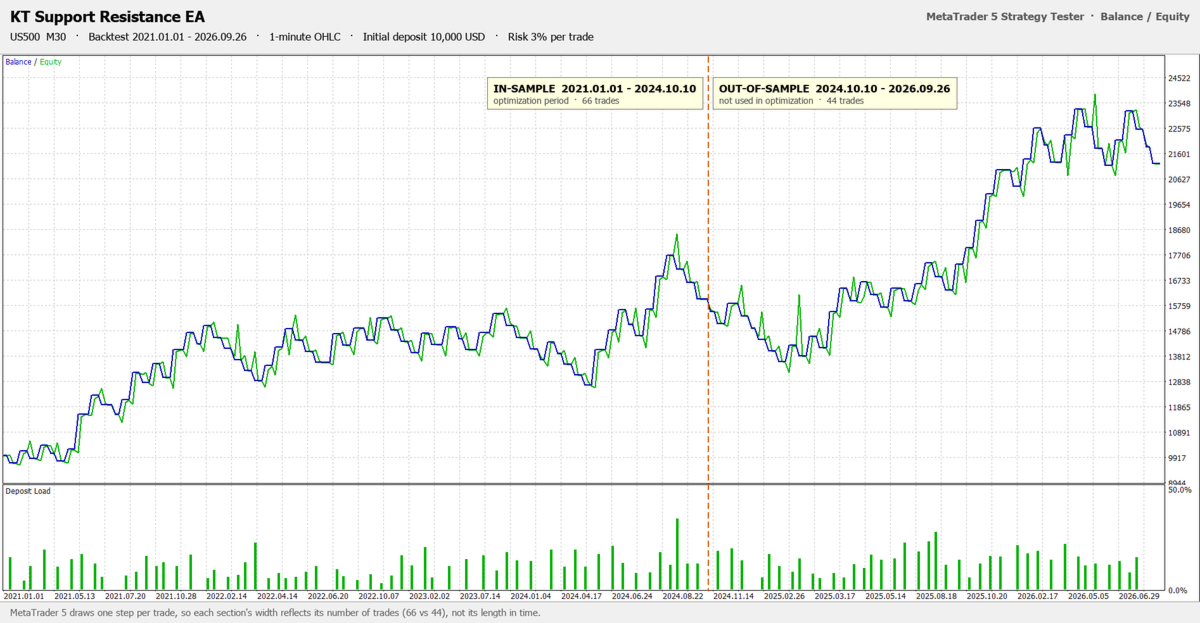
Choose JP225 M30, JP225 H1, US500 M30, US30 M30 or DE40 H1 in the Settings input, attach the EA to that chart, set your risk, and it trades the settings that were tested on those markets. Choose Custom to set every filter yourself. The backtest results of the tested settings are in the screenshots.

How it trades a bounce

The EA finds levels on the monthly, weekly, daily and chart timeframes: swing highs and lows, pivots, the previous day, week and month prices, order block midpoints and Smart Zones. These are the same levels as KT Auto Support Resistance Levels Indicator, and the indicator is not needed.

When a candle dips into a support zone and closes back above it, the EA buys at that close (and the mirror for resistance). Only closed candles count, so a wick that is still forming never opens a trade. The stop loss goes beyond the zone and beyond the wick, and the target is the next opposing level, as long as the reward is large enough for the risk.

Why traders choose it

  • Only proven levels: a level that price broke through too often is left alone, however good it looks on the chart.
  • A full plan from the first second: stop loss and take profit are set on every trade, and the stop loss moves to break even once the trade is far enough in profit.
  • The same risk on every trade: the lot size comes from the stop loss distance and your Risk Percent per Trade, or a fixed lot if you prefer it.
  • A daily loss limit that follows your risk: after a set number of losses in a day, the chart stops trading until the next day. Trades per day and open trades are limited too.
  • No grid, no martingale and no averaging: one trade per level per day, and if a stop loss is ever removed, the EA puts it back or closes the trade.
  • Careful with your account: a new trade never takes the margin level below 150%, and a lot above the broker's maximum is split into parts and managed as one trade.
  • Always informed: the panel shows the nearest support and resistance with their Reversal Chance, the EA's state and a PAUSE button, with pop-up, push and email alerts on every open and close.


Recommendations

JP225, US500, US30 and DE40 with the matching settings (your broker may call them NI225, SPX500, DJ30 or GER40), on hedging or netting accounts. Set Max bars in chart to 100000 or more so the EA sees enough history for the monthly and weekly levels. Each tested setting has its own Magic Number, so two of them can run on the same account. A VPS keeps the EA running around the clock.

Input parameters

  • Settings: JP225 M30, JP225 H1, US500 M30, US30 M30, DE40 H1 or Custom.
  • Levels and level engine: which level types to use, the pivot type, and the swing, order block and Smart Zone settings of the indicator.
  • Level filters: Minimum Reversal Chance, Minimum Number of Touches, and whether fresh levels are traded.
  • Entry modes: bounces, break and retest, and a minimum rejection wick.
  • Stop loss and take profit: stop loss mode and distance beyond the zone, take profit mode (next opposing level, level ladder or fixed points), minimum reward to risk and target level filters.
  • Risk: lot mode, Risk Percent per Trade, trades per day, open trades, daily loss limit and trades per level per day.
  • Trade management: break even, break even lock, level ladder percent and an ATR trailing stop.
  • Filters: trading hours, maximum spread, Friday close, higher timeframe trend filter and maximum slippage.
  • Panel and alerts: panel, levels on the chart, pop-up, push and email alerts, Magic Number and trade comment.


Trade the levels where price turns

Pick a tested setting, attach KT Support Resistance EA to its chart, and let it trade the support and resistance levels where price has reversed its direction many times before, with a stop loss and a target on every trade.

Altri dall’autore
KT Support and Resistance Levels MT5
KEENBASE SOFTWARE SOLUTIONS
5 (1)
KT Auto Support Resistance Levels: S&R multi-timeframe, Smart Zones e pannello dei livelli per MetaTrader 4/5 Massimi di swing. Pivot. Order block. Massimi e minimi precedenti. Ogni trader marca il mercato in modo leggermente diverso, e alla fine è il grafico a pagarne il prezzo. Se accumuli troppi metodi su una sola schermata, smette di essere una mappa. Diventa rumore. KT Auto Support Resistance Levels risolve questo problema. Scansiona contemporaneamente il timeframe mensile, settimanale, gio

ACB Breakout Arrows MT5
KEENBASE SOFTWARE SOLUTIONS
3.5 (2)
Segnali di breakout con il contesto di mercato ACB Breakout Arrows rileva una fase di stabilizzazione del prezzo seguita da un breakout direzionale e contrassegna la configurazione con una freccia di acquisto o vendita. La freccia identifica un pattern di breakout. Non garantisce che ogni segnale si trasformi in un movimento importante. Una freccia di acquisto evidenzia una configurazione di breakout rialzista, mentre una freccia di vendita evidenzia una configurazione ribassista. Poiché il prez
ACB Trade Filter MT5
KEENBASE SOFTWARE SOLUTIONS
Prima di aprire un'operazione, ACB Trade Filter aiuta a rispondere a una domanda pratica: il mercato sostiene questo trade oppure stai cercando di forzare un segnale in condizioni contrastanti? L'indicatore analizza il sentiment del mercato e il trend, quindi presenta il risultato con un istogramma colorato e la direzione del trend. Usalo dopo il tuo normale segnale di ingresso, non al suo posto. Tre condizioni di mercato a colpo d'occhio Istogramma verde con trend rialzista: le condizioni soste
KT Auto Support Resistance Levels: S&R multi-timeframe, Smart Zones e pannello dei livelli per MetaTrader 4/5 Massimi di swing. Pivot. Order block. Massimi e minimi precedenti. Ogni trader marca il mercato in modo leggermente diverso, e alla fine è il grafico a pagarne il prezzo. Se accumuli troppi metodi su una sola schermata, smette di essere una mappa. Diventa rumore. KT Auto Support Resistance Levels risolve questo problema. Scansiona contemporaneamente il timeframe mensile, settimanale, gio
KT Stoch Divergence MT4
KEENBASE SOFTWARE SOLUTIONS
Se ti è capitato di vedere il prezzo segnare un nuovo massimo mentre lo Stocastico non confermava il movimento, sai già perché i trader osservano le divergenze. KT Stoch Divergence segnala queste differenze direttamente sul grafico, aiutandoti a individuare possibili inversioni e continuazioni del trend senza disegnare ogni linea a mano. L'indicatore rileva divergenze regolari e nascoste tra il prezzo e l'oscillatore Stocastico. Ti offre un contesto, non un ordine automatico. Sei sempre tu a dec
ACB Breakout Arrows
KEENBASE SOFTWARE SOLUTIONS
4.15 (34)
Segnali di breakout con il contesto di mercato ACB Breakout Arrows rileva una fase di stabilizzazione del prezzo seguita da un breakout direzionale e contrassegna la configurazione con una freccia di acquisto o vendita. La freccia identifica un pattern di breakout. Non garantisce che ogni segnale si trasformi in un movimento importante. Una freccia di acquisto evidenzia una configurazione di breakout rialzista, mentre una freccia di vendita evidenzia una configurazione ribassista. Poiché il prez
ACB Trade Filter MT4
KEENBASE SOFTWARE SOLUTIONS
5 (1)
Prima di aprire un'operazione, ACB Trade Filter aiuta a rispondere a una domanda pratica: il mercato sostiene questo trade oppure stai cercando di forzare un segnale in condizioni contrastanti? L'indicatore analizza il sentiment del mercato e il trend, quindi presenta il risultato con un istogramma colorato e la direzione del trend. Usalo dopo il tuo normale segnale di ingresso, non al suo posto. Tre condizioni di mercato a colpo d'occhio Istogramma verde con trend rialzista: le condizioni soste
KT Momentum Arrows
KEENBASE SOFTWARE SOLUTIONS
KT Momentum Arrows segnala con frecce i breakout di momentum rialzisti e ribassisti quando una candela chiude oltre le bande di prezzo adattive. Le bande reagiscono alla deviazione del prezzo e ai cambiamenti della volatilità. Una freccia blu verso l'alto conferma una chiusura sopra la banda superiore, mentre una freccia rossa verso il basso conferma una chiusura sotto la banda inferiore. Il segnale viene fissato dopo la chiusura della candela, quindi la freccia non si sposta su un'altra barra q
KT COG Advanced MT4
KEENBASE SOFTWARE SOLUTIONS
1 (1)
KT COG is an advanced implementation of the center of gravity indicator presented by John F. Ehlers in the May 2002 edition of Technical Analysis of Stocks & Commodities magazine. It's a leading indicator which can be used to identify the potential reversal points with the minimum lag. The COG oscillator catches the price swings quite effectively. MT5 version of the same indicator is available here KT COG Advanced MT5 Calculation of COG The COG indicator is consist of the two lines. The main l
KT Pin Bar
KEENBASE SOFTWARE SOLUTIONS
KT Pin Bar identifies the pin bar formation which is a type of price action pattern which depicts a sign of reversal or rejection of the trend. When combined with support and resistance, BRN and other significant levels, Pin Bar pattern proved to be a very strong sign of reversal. Basically, a pin bar is characterized by a small body relative to the bar length which is closed either in upper or lower 50% part of its length. They have very large wicks and small candle body. A pin bar candlestic
KT Trend Magic
KEENBASE SOFTWARE SOLUTIONS
Leggi la direzione del trend direttamente sul grafico KT Trend Magic combina momentum e volatilità in una linea colorata che segue il prezzo. La linea offre una vista continua dello stato attivo del trend e cambia colore quando cambia la direzione calcolata. Linea verde: mostra uno stato di trend rialzista. Linea rossa: mostra uno stato di trend ribassista. Cambio di colore: segna una nuova transizione direzionale sul grafico. Durante un movimento sostenuto, la linea può anche servire come rifer
KT Auto Fibo
KEENBASE SOFTWARE SOLUTIONS
Auto Fibonacci indicator that draws the Fibonacci retracement on the swing you are looking at, and redraws it the moment you zoom or scroll the chart. Zoom in on a pullback and the levels measure that pullback. Zoom out and they measure the whole trend. There are no anchor points to drag and no levels to redraw after every new high. Key features Measures the highest high and the lowest low on your screen, the current candle included. Follows zoom, scroll and window size at once, even when the ma
KT Psar Arrows
KEENBASE SOFTWARE SOLUTIONS
KT Psar Arrows traccia frecce sul grafico utilizzando l'indicatore standard Parabolic SAR. Una freccia rialzista viene tracciata quando il massimo della candela tocca il SAR. Una freccia ribassista viene tracciata quando il minimo della candela tocca il SAR. I segnali vengono generati in tempo reale senza attendere la chiusura della candela.  Funzionalità Uno strumento utile per i trader che desiderano sperimentare strategie di trading che includono l'uso dell'indicatore Parabolic SAR.  Può ess
KT Ichimoku Trader
KEENBASE SOFTWARE SOLUTIONS
1 (1)
Cinque strategie Ichimoku, negoziate in automatico KT Ichimoku Trader è un Expert Advisor che apre e chiude operazioni in automatico con cinque strategie classiche di Ichimoku Kinko Hyo. Attivi le strategie che desideri e ognuna opera per conto proprio: con le sue regole di ingresso, le sue regole di uscita e al massimo un'operazione aperta per strategia alla volta. Ogni ingresso viene verificato su una candela chiusa. Quando si apre una nuova candela, l'EA legge la candela appena chiusa e apre
KT Volatility Oscillator
KEENBASE SOFTWARE SOLUTIONS
L'Oscillatore di Volatilità KT analizza i dati di mercato passati e presenti utilizzando una formula matematica per mostrare il risultato sotto forma di oscillatore. Le onde crescenti e decrescenti corrispondono rispettivamente a un'elevata e a una bassa volatilità dell'asset.  In poche parole, la volatilità è semplicemente una misura delle fluttuazioni di prezzo di un asset in un certo periodo di tempo. Senza volatilità, ci sarebbero pochi movimenti di mercato e i trader non potrebbero trarre p
KT COG Robot
KEENBASE SOFTWARE SOLUTIONS
KT COG Robot is a fully automated Expert Advisor based on the KT COG Indicator . The COG indicator was originally presented by John F. Ehlers in the May 2002 edition of Technical Analysis of Stocks & Commodities magazine. The EA fires a long trade when COG line cross above the signal line and a short trade is fired when the COG line cross below the signal line.  Adaptive Filtration Our adaptive filtration algorithm combines the original COG formula with the major trend direction and market acce
ACB Breakout Arrows EA
KEENBASE SOFTWARE SOLUTIONS
Automatizza il flusso di breakout ACB ACB Breakout Arrows EA valuta i segnali di breakout sul grafico attivo e gestisce le operazioni con la logica integrata di ACB Breakout Arrows e ACB Trade Filter. Applica l'EA al simbolo e al timeframe che vuoi monitorare, abilita il trading automatico, quindi scegli le regole di posizione, sessione, filtri e uscita adatte al tuo piano di test. Gli indicatori e i componenti necessari sono incorporati nell'EA, quindi non occorre un download separato. I loro p
KT Asian Breakout
KEENBASE SOFTWARE SOLUTIONS
4 (1)
KT Asian Breakout carefully analyzes the range-bound market during the Asian session and then fires a long or short trade after doing some preassessment based on its inbuilt technical analysis module. The executed orders are closed within a day before the completion of the next day session. The inbuilt technical analysis module checks for the session range and compares it with the last 20 days price movement. If it finds any erratic price movement within the session, the orders are not executed
KT London Breakout
KEENBASE SOFTWARE SOLUTIONS
First thirty minutes are essential for a trading session. The early reaction of traders and market players sets a path for the rest of the day. KT London Breakout EA takes advantage of this phenomenon, and after analyzing the first thirty minutes of London session, it places two bidirectional pending orders. One of pending order is eventually canceled after realizing the market direction with certainty. It has been strictly tested and developed for EUR/JPY using 30-Min Time Frame. You can expe
Currency strength and pair correlation in one indicator KT Currency Strength and Correlation ranks the eight major currencies from strongest to weakest and shows, in a colored matrix, how closely ten currency pairs of your choice move together. Before you open a trade from your own strategy, you can check whether the two currencies of the pair are really moving apart, and whether the new trade adds risk to a trade you already hold. What you see on the chart Strength lines: a separate window belo
MACD Divergence Seeker
KEENBASE SOFTWARE SOLUTIONS
KT MACD Divergence Seeker trades the regular and hidden divergence signals generated by our free indicator named KT MACD Divergence indicator. Trading the standalone divergences can be a risky affair that's why the KT MACD Divergence Seeker combines the standard divergence signals with an advanced analysis module to exploit the price inefficiencies on some FX pairs. What is the Divergence exactly? As a general conception if the price is making higher highs, then macd should also be making hig
KT Asian Breakout Indicator
KEENBASE SOFTWARE SOLUTIONS
Traccia l'intervallo della sessione asiatica KT Asian Breakout Indicator segna il massimo e il minimo di una finestra di quattro ore della sessione asiatica e controlla il prezzo dopo il completamento dell'intervallo. Il parametro GMT Offset allinea la sessione all'ora del server del broker, mentre Draw Session Box controlla la visualizzazione dell'intervallo. Osserva insieme il breakout e i livelli operativi Una freccia rialzista appare quando il prezzo chiude sopra il massimo della sessione. U
MACD Divergence MT4
KEENBASE SOFTWARE SOLUTIONS
KT MACD Divergence mostra le divergenze regolari e nascoste che si formano tra il prezzo e l’oscillatore. Se la tua strategia di trading prevede un'inversione di tendenza, puoi utilizzare la divergenza regolare del MACD per identificare possibili punti di svolta. Se invece la tua strategia si basa sulla continuazione del trend, la divergenza nascosta del MACD sarà più adatta. Limitazioni di KT MACD Divergence Usare la divergenza del MACD come unico segnale d'ingresso può essere rischioso. Non
KT Bollinger Bands Trader MT4
KEENBASE SOFTWARE SOLUTIONS
KT Bollinger Bands Trader è un Expert Advisor completamente automatizzato che utilizza una strategia di ritorno alla media basata sulle bande di Bollinger durante i periodi di bassa volatilità. Il prezzo spesso reagisce sulla linea superiore o inferiore delle bande, ma non sempre si verifica un'inversione. Tuttavia, la probabilità di un’inversione è maggiore quando la volatilità è bassa. Ingressi Un trade long viene attivato quando il prezzo si posiziona correttamente al di sotto della banda in
KT CCI Divergence MT4
KEENBASE SOFTWARE SOLUTIONS
KT CCI Divergence shows the regular and hidden divergence created between the price and CCI oscillator. Divergence is one of the vital signals that depicts the upcoming price reversal in the market. Manually spotting the divergence between price and CCI can be a hectic and ambiguous task. Limitations of KT CCI Divergence   Using the CCI divergence as a standalone entry signal can be risky. Every divergence can't be interpreted as a strong reversal signal. For better results, try to combine it w
KT Heiken Ashi Smoothed MT4
KEENBASE SOFTWARE SOLUTIONS
Segui lo stato Heiken Ashi smussato KT Heiken Ashi Smoothed trasforma il movimento del prezzo in candele blu e rosse smussate. Aggiunge una freccia blu verso l'alto quando lo stato passa da ribassista a rialzista e una freccia rossa verso il basso quando passa da rialzista a ribassista, rendendo facili da individuare i cambi di direzione sul grafico. Il periodo e il metodo di smussamento controllano l'intensità dello smussamento delle candele. Questo offre una vista più stabile rispetto all'Heik
KT MA Crossover MT4
KEENBASE SOFTWARE SOLUTIONS
KT MA Crossover disegna frecce di acquisto e vendita in base all'incrocio delle medie mobili selezionate. Inoltre, genera gli avvisi appropriati e visualizza il valore MFE (Escursione Più Favorevole) per ogni segnale consecutivo. L’incrocio delle medie mobili è una delle strategie più utilizzate dai trader di tutto il mondo. Di solito si basa su una media mobile veloce e una lenta per determinare segnali di ingresso in acquisto o vendita in base alla direzione dell’incrocio. Segnale di acquisto
KT Round Numbers MT4
KEENBASE SOFTWARE SOLUTIONS
KT Round Numbers plots the round number levels which are also commonly known as psychological levels in the Forex world. In the context of Forex trading, round number levels are those levels in which there are two or more zeroes at the end. They are named as 00 levels on the chart. Some traders also consider the halfway points as a valid round number level. They are named as 50 levels on the chart. Use of round number levels in trading Round number levels work as strong support and resistance
KT Inside Bar Advanced MT4
KEENBASE SOFTWARE SOLUTIONS
Despite the popularity of inside bar pattern among the traders, using it as a standalone signal doesn't provide any edge in the market. KT Inside Bar Advanced indicator solves this problem by combining the classic inside bar pattern with the "ECE" cycle and Fibonacci extensions. Using this indicator in place of our classic inside bar indicator will provide a tremendous advantage and edge in the market. What is the ECE cycle? In financial markets, the price never moves in a straight line but u
KT Inside Bar Hunter MT4
KEENBASE SOFTWARE SOLUTIONS
Despite the popularity of inside bar pattern among traders, using it as a standalone entry signal doesn't provide any evidentiary advantage. KT Inside Bar Hunter trades only selected inside bar patterns using some preassessment and ECE price action cycle. Trading Strategy On successful detection of the required pattern, EA places a pending order in the direction of the forecasted price expansion phase. Pending orders are canceled if they are not triggered within the next bar. Once triggered, ac
Filtro:
Nessuna recensione
Rispondi alla recensione