KT Support Resistance EA MT4

KT Support Resistance EA trades bounces only from the support and resistance levels where price has reversed its direction many times in the past. Every level carries a Reversal Chance: out of all the times price reached that level, the share of times it reversed instead of breaking through. The EA trades a bounce only when the Reversal Chance is high. Each trade opens with a stop loss beyond the zone and a take profit at the next opposing level.

Five tested settings built in

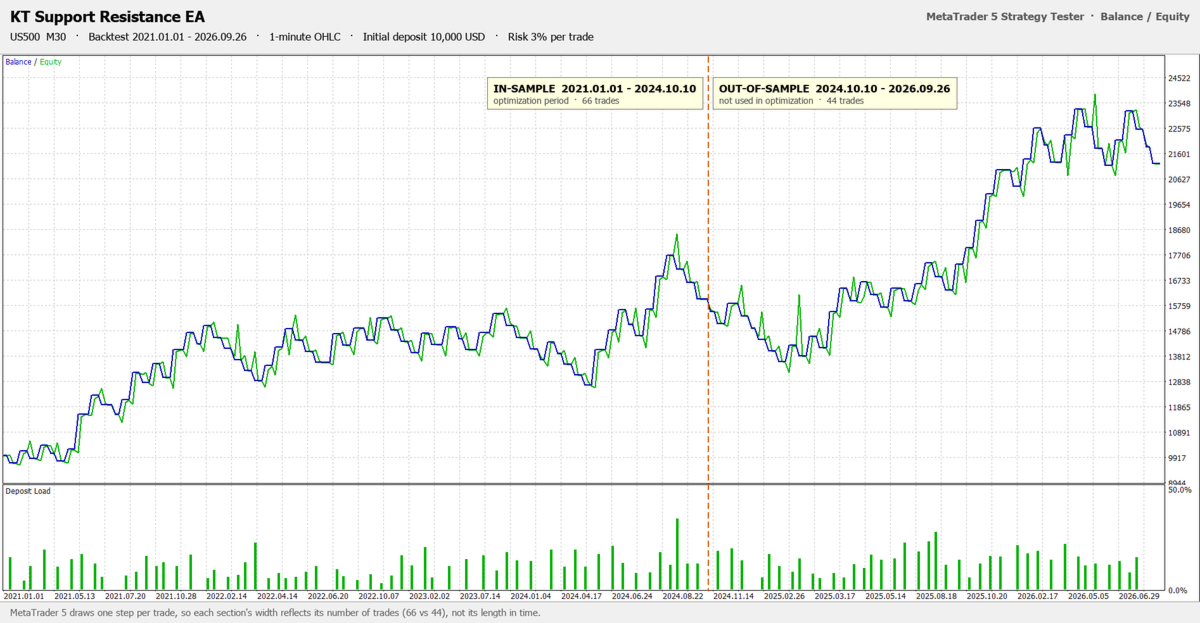
Choose JP225 M30, JP225 H1, US500 M30, US30 M30 or DE40 H1 in the Settings input, attach the EA to that chart, set your risk, and it trades the settings that were tested on those markets. Choose Custom to set every filter yourself. The backtest results of the tested settings are in the screenshots.

How it trades a bounce

The EA finds levels on the monthly, weekly, daily and chart timeframes: swing highs and lows, pivots, the previous day, week and month prices, order block midpoints and Smart Zones. These are the same levels as KT Auto Support Resistance Levels Indicator, and the indicator is not needed.

When a candle dips into a support zone and closes back above it, the EA buys at that close (and the mirror for resistance). Only closed candles count, so a wick that is still forming never opens a trade. The stop loss goes beyond the zone and beyond the wick, and the target is the next opposing level, as long as the reward is large enough for the risk.

Why traders choose it

  • Only proven levels: a level that price broke through too often is left alone, however good it looks on the chart.
  • A full plan from the first second: stop loss and take profit are set on every trade, and the stop loss moves to break even once the trade is far enough in profit.
  • The same risk on every trade: the lot size comes from the stop loss distance and your Risk Percent per Trade, or a fixed lot if you prefer it.
  • A daily loss limit that follows your risk: after a set number of losses in a day, the chart stops trading until the next day. Trades per day and open trades are limited too.
  • No grid, no martingale and no averaging: one trade per level per day, and if a stop loss is ever removed, the EA puts it back or closes the trade.
  • Careful with your account: a new trade never takes the margin level below 150%, and a lot above the broker's maximum is split into parts and managed as one trade.
  • Always informed: the panel shows the nearest support and resistance with their Reversal Chance, the EA's state and a PAUSE button, with pop-up, push and email alerts on every open and close.


Recommendations

JP225, US500, US30 and DE40 with the matching settings (your broker may call them NI225, SPX500, DJ30 or GER40), on hedging or netting accounts. Set Max bars in chart to 100000 or more so the EA sees enough history for the monthly and weekly levels. Each tested setting has its own Magic Number, so two of them can run on the same account. A VPS keeps the EA running around the clock.

Input parameters

  • Settings: JP225 M30, JP225 H1, US500 M30, US30 M30, DE40 H1 or Custom.
  • Levels and level engine: which level types to use, the pivot type, and the swing, order block and Smart Zone settings of the indicator.
  • Level filters: Minimum Reversal Chance, Minimum Number of Touches, and whether fresh levels are traded.
  • Entry modes: bounces, break and retest, and a minimum rejection wick.
  • Stop loss and take profit: stop loss mode and distance beyond the zone, take profit mode (next opposing level, level ladder or fixed points), minimum reward to risk and target level filters.
  • Risk: lot mode, Risk Percent per Trade, trades per day, open trades, daily loss limit and trades per level per day.
  • Trade management: break even, break even lock, level ladder percent and an ATR trailing stop.
  • Filters: trading hours, maximum spread, Friday close, higher timeframe trend filter and maximum slippage.
  • Panel and alerts: panel, levels on the chart, pop-up, push and email alerts, Magic Number and trade comment.


Trade the levels where price turns

Pick a tested setting, attach KT Support Resistance EA to its chart, and let it trade the support and resistance levels where price has reversed its direction many times before, with a stop loss and a target on every trade.

Plus de l'auteur
KT Support and Resistance Levels MT5
KEENBASE SOFTWARE SOLUTIONS
5 (1)
KT Auto Support Resistance Levels : S&R multi-timeframe, Smart Zones et tableau de bord des niveaux pour MetaTrader 4/5 Sommets de swing. Pivots. Order blocks. Plus hauts et plus bas précédents. Chaque trader marque le marché à sa façon, et c’est souvent le graphique qui en paie le prix. Empilez trop de méthodes sur un seul écran et il cesse d’être une carte. Il devient du bruit. KT Auto Support Resistance Levels règle ce problème. L’indicateur analyse en même temps le mensuel, l’hebdomadaire, l

ACB Breakout Arrows MT5
KEENBASE SOFTWARE SOLUTIONS
3.5 (2)
Signaux de cassure avec contexte de marché ACB Breakout Arrows détecte une phase de stabilisation du prix suivie d'une cassure directionnelle et marque la configuration avec une flèche d'achat ou de vente. La flèche identifie une structure de cassure. Elle ne garantit pas que chaque signal deviendra un mouvement important. Une flèche d'achat met en évidence une configuration de cassure haussière, tandis qu'une flèche de vente indique une configuration baissière. Comme le prix peut retester la zo
ACB Trade Filter MT5
KEENBASE SOFTWARE SOLUTIONS
Avant d'ouvrir une position, ACB Trade Filter vous aide à répondre à une question pratique : le marché soutient-il cette opération ou essayez-vous de forcer un signal dans des conditions contradictoires ? L'indicateur analyse le sentiment du marché et la tendance, puis présente le résultat avec un histogramme coloré et la direction de la tendance. Utilisez-le après votre signal d'entrée habituel, pas à sa place. Trois états du marché en un coup d'œil Histogramme vert avec tendance haussière : le
KT Auto Support Resistance Levels : S&R multi-timeframe, Smart Zones et tableau de bord des niveaux pour MetaTrader 4/5 Sommets de swing. Pivots. Order blocks. Plus hauts et plus bas précédents. Chaque trader marque le marché à sa façon, et c’est souvent le graphique qui en paie le prix. Empilez trop de méthodes sur un seul écran et il cesse d’être une carte. Il devient du bruit. KT Auto Support Resistance Levels règle ce problème. L’indicateur analyse en même temps le mensuel, l’hebdomadaire, l
KT Stoch Divergence MT4
KEENBASE SOFTWARE SOLUTIONS
Si vous avez déjà vu le prix inscrire un nouveau sommet alors que le Stochastique ne confirmait pas le mouvement, vous savez pourquoi les traders surveillent les divergences. KT Stoch Divergence marque ces désaccords directement sur le graphique afin de repérer plus facilement les retournements possibles et les continuations de tendance, sans tracer chaque ligne à la main. L'indicateur détecte les divergences régulières et cachées entre le prix et l'oscillateur Stochastique. Il vous apporte du c
ACB Breakout Arrows
KEENBASE SOFTWARE SOLUTIONS
4.15 (34)
Signaux de cassure avec contexte de marché ACB Breakout Arrows détecte une phase de stabilisation du prix suivie d'une cassure directionnelle et marque la configuration avec une flèche d'achat ou de vente. La flèche identifie une structure de cassure. Elle ne garantit pas que chaque signal deviendra un mouvement important. Une flèche d'achat met en évidence une configuration de cassure haussière, tandis qu'une flèche de vente indique une configuration baissière. Comme le prix peut retester la zo
ACB Trade Filter MT4
KEENBASE SOFTWARE SOLUTIONS
5 (1)
Avant d'ouvrir une position, ACB Trade Filter vous aide à répondre à une question pratique : le marché soutient-il cette opération ou essayez-vous de forcer un signal dans des conditions contradictoires ? L'indicateur analyse le sentiment du marché et la tendance, puis présente le résultat avec un histogramme coloré et la direction de la tendance. Utilisez-le après votre signal d'entrée habituel, pas à sa place. Trois états du marché en un coup d'œil Histogramme vert avec tendance haussière : le
KT Momentum Arrows
KEENBASE SOFTWARE SOLUTIONS
KT Momentum Arrows marque les cassures de momentum haussières et baissières avec des flèches lorsqu'une bougie clôture au-delà de ses bandes de prix adaptatives. Les bandes réagissent à l'écart du prix et aux changements de volatilité. Une flèche bleue vers le haut confirme une clôture au-dessus de la bande supérieure, tandis qu'une flèche rouge vers le bas confirme une clôture sous la bande inférieure. Le signal est fixé après la clôture de la bougie, la flèche ne se déplace donc pas sur une au
KT COG Advanced MT4
KEENBASE SOFTWARE SOLUTIONS
1 (1)
KT COG is an advanced implementation of the center of gravity indicator presented by John F. Ehlers in the May 2002 edition of Technical Analysis of Stocks & Commodities magazine. It's a leading indicator which can be used to identify the potential reversal points with the minimum lag. The COG oscillator catches the price swings quite effectively. MT5 version of the same indicator is available here KT COG Advanced MT5 Calculation of COG The COG indicator is consist of the two lines. The main l
KT Pin Bar
KEENBASE SOFTWARE SOLUTIONS
KT Pin Bar identifies the pin bar formation which is a type of price action pattern which depicts a sign of reversal or rejection of the trend. When combined with support and resistance, BRN and other significant levels, Pin Bar pattern proved to be a very strong sign of reversal. Basically, a pin bar is characterized by a small body relative to the bar length which is closed either in upper or lower 50% part of its length. They have very large wicks and small candle body. A pin bar candlestic
KT Trend Magic
KEENBASE SOFTWARE SOLUTIONS
Lisez la direction de la tendance directement sur le graphique KT Trend Magic associe momentum et volatilité dans une ligne colorée qui suit le prix. La ligne donne une vue continue de l'état actif de la tendance et change de couleur lorsque la direction calculée se modifie. Ligne verte : indique un état de tendance haussier. Ligne rouge : indique un état de tendance baissier. Changement de couleur : marque une nouvelle transition directionnelle sur le graphique. Pendant un mouvement soutenu, la
KT Auto Fibo
KEENBASE SOFTWARE SOLUTIONS
Auto Fibonacci indicator that draws the Fibonacci retracement on the swing you are looking at, and redraws it the moment you zoom or scroll the chart. Zoom in on a pullback and the levels measure that pullback. Zoom out and they measure the whole trend. There are no anchor points to drag and no levels to redraw after every new high. Key features Measures the highest high and the lowest low on your screen, the current candle included. Follows zoom, scroll and window size at once, even when the ma
KT Psar Arrows
KEENBASE SOFTWARE SOLUTIONS
KT Psar Arrows trace des flèches sur le graphique en utilisant l'indicateur standard Parabolic SAR. Une flèche haussière est tracée lorsque le plus haut de la bougie touche le SAR. Une flèche baissière est tracée lorsque le plus bas de la bougie touche le SAR. Les signaux sont générés en temps réel sans attendre la clôture de la bougie.  Fonctionnalités Un outil utile pour les traders souhaitant expérimenter des stratégies de trading intégrant l'indicateur Parabolic SAR.  Peut être utilisé pour
KT Ichimoku Trader
KEENBASE SOFTWARE SOLUTIONS
1 (1)
Cinq stratégies Ichimoku tradées automatiquement KT Ichimoku Trader est un Expert Advisor qui ouvre et ferme des positions automatiquement avec cinq stratégies classiques d'Ichimoku Kinko Hyo. Vous activez les stratégies de votre choix, et chacune trade de façon indépendante : avec ses propres règles d'entrée, ses propres règles de sortie et au maximum une position ouverte par stratégie à la fois. Chaque entrée est vérifiée sur une bougie clôturée. À l'ouverture d'une nouvelle bougie, l'EA lit l
KT Volatility Oscillator
KEENBASE SOFTWARE SOLUTIONS
L'oscillateur de volatilité KT analyse les données de marché passées et actuelles à l'aide d'une formule mathématique pour afficher le résultat sous forme d'oscillateur. Les vagues croissantes et décroissantes correspondent respectivement à une volatilité élevée et faible de l'actif.  En résumé, la volatilité est simplement une mesure des fluctuations du prix d'un actif sur une certaine période de temps. Sans volatilité, il y aurait peu de mouvement sur le marché et les traders ne pourraient pas
KT COG Robot
KEENBASE SOFTWARE SOLUTIONS
KT COG Robot is a fully automated Expert Advisor based on the KT COG Indicator . The COG indicator was originally presented by John F. Ehlers in the May 2002 edition of Technical Analysis of Stocks & Commodities magazine. The EA fires a long trade when COG line cross above the signal line and a short trade is fired when the COG line cross below the signal line.  Adaptive Filtration Our adaptive filtration algorithm combines the original COG formula with the major trend direction and market acce
ACB Breakout Arrows EA
KEENBASE SOFTWARE SOLUTIONS
Automatisez le processus de cassure ACB ACB Breakout Arrows EA évalue les signaux de cassure sur le graphique actif et gère les opérations avec la logique intégrée d'ACB Breakout Arrows et d'ACB Trade Filter. Placez l'EA sur le symbole et l'unité de temps à surveiller, autorisez le trading automatique, puis choisissez les règles de position, de session, de filtre et de sortie adaptées à votre plan de test. Les indicateurs et composants nécessaires sont intégrés à l'EA, aucun téléchargement sépar
KT Asian Breakout
KEENBASE SOFTWARE SOLUTIONS
4 (1)
KT Asian Breakout carefully analyzes the range-bound market during the Asian session and then fires a long or short trade after doing some preassessment based on its inbuilt technical analysis module. The executed orders are closed within a day before the completion of the next day session. The inbuilt technical analysis module checks for the session range and compares it with the last 20 days price movement. If it finds any erratic price movement within the session, the orders are not executed
KT London Breakout
KEENBASE SOFTWARE SOLUTIONS
First thirty minutes are essential for a trading session. The early reaction of traders and market players sets a path for the rest of the day. KT London Breakout EA takes advantage of this phenomenon, and after analyzing the first thirty minutes of London session, it places two bidirectional pending orders. One of pending order is eventually canceled after realizing the market direction with certainty. It has been strictly tested and developed for EUR/JPY using 30-Min Time Frame. You can expe
Currency strength and pair correlation in one indicator KT Currency Strength and Correlation ranks the eight major currencies from strongest to weakest and shows, in a colored matrix, how closely ten currency pairs of your choice move together. Before you open a trade from your own strategy, you can check whether the two currencies of the pair are really moving apart, and whether the new trade adds risk to a trade you already hold. What you see on the chart Strength lines: a separate window belo
MACD Divergence Seeker
KEENBASE SOFTWARE SOLUTIONS
KT MACD Divergence Seeker trades the regular and hidden divergence signals generated by our free indicator named KT MACD Divergence indicator. Trading the standalone divergences can be a risky affair that's why the KT MACD Divergence Seeker combines the standard divergence signals with an advanced analysis module to exploit the price inefficiencies on some FX pairs. What is the Divergence exactly? As a general conception if the price is making higher highs, then macd should also be making hig
KT Asian Breakout Indicator
KEENBASE SOFTWARE SOLUTIONS
Tracez la plage de la session asiatique KT Asian Breakout Indicator marque le plus haut et le plus bas d'une fenêtre de quatre heures de la session asiatique, puis surveille le prix une fois la plage terminée. Le paramètre GMT Offset aligne la session sur l'heure du serveur de votre courtier, tandis que Draw Session Box contrôle l'affichage de la plage. Visualisez ensemble la cassure et les niveaux de transaction Une flèche haussière apparaît lorsque le prix clôture au-dessus du plus haut de la
MACD Divergence MT4
KEENBASE SOFTWARE SOLUTIONS
KT MACD Divergence affiche les divergences régulières et cachées qui se forment entre le prix et l’oscillateur. Si votre stratégie de trading anticipe un retournement de tendance, vous pouvez utiliser la divergence MACD régulière pour repérer les points de retournement potentiels. Et si votre stratégie repose sur la continuité de la tendance, la divergence cachée du MACD sera plus appropriée. Limites de KT MACD Divergence Utiliser la divergence MACD comme unique signal d’entrée peut être risqu
KT Bollinger Bands Trader MT4
KEENBASE SOFTWARE SOLUTIONS
KT Bollinger Bands Trader est un Expert Advisor 100 % automatisé qui applique une stratégie de retour à la moyenne basée sur les bandes de Bollinger pendant les périodes de faible volatilité. Le prix réagit souvent sur la ligne supérieure ou inférieure des bandes, mais un retournement ne se produit pas systématiquement. Cependant, la probabilité d’un retournement est plus élevée lorsque la volatilité est faible. Entrées Un achat est déclenché lorsque le prix se positionne correctement sous la b
KT CCI Divergence MT4
KEENBASE SOFTWARE SOLUTIONS
KT CCI Divergence shows the regular and hidden divergence created between the price and CCI oscillator. Divergence is one of the vital signals that depicts the upcoming price reversal in the market. Manually spotting the divergence between price and CCI can be a hectic and ambiguous task. Limitations of KT CCI Divergence   Using the CCI divergence as a standalone entry signal can be risky. Every divergence can't be interpreted as a strong reversal signal. For better results, try to combine it w
KT Heiken Ashi Smoothed MT4
KEENBASE SOFTWARE SOLUTIONS
Suivez l'état Heiken Ashi lissé KT Heiken Ashi Smoothed transforme le mouvement du prix en bougies bleues et rouges lissées. Une flèche bleue vers le haut apparaît lorsque l'état passe de baissier à haussier, et une flèche rouge vers le bas lorsqu'il passe de haussier à baissier, ce qui rend les changements de direction faciles à repérer sur le graphique. La période et la méthode de lissage déterminent le niveau de lissage des bougies. Vous obtenez ainsi une vue plus stable que le Heiken Ashi st
KT MA Crossover MT4
KEENBASE SOFTWARE SOLUTIONS
KT MA Crossover affiche des flèches d'achat et de vente en fonction du croisement des moyennes mobiles sélectionnées. Il génère également les alertes appropriées et affiche la valeur MFE (Excursion la plus favorable) pour chaque signal successif. La stratégie de croisement des moyennes mobiles est l'une des techniques les plus utilisées par les traders dans le monde entier. Elle repose généralement sur une moyenne mobile rapide et une moyenne mobile lente pour détecter les signaux d'achat et de
KT Round Numbers MT4
KEENBASE SOFTWARE SOLUTIONS
KT Round Numbers plots the round number levels which are also commonly known as psychological levels in the Forex world. In the context of Forex trading, round number levels are those levels in which there are two or more zeroes at the end. They are named as 00 levels on the chart. Some traders also consider the halfway points as a valid round number level. They are named as 50 levels on the chart. Use of round number levels in trading Round number levels work as strong support and resistance
KT Inside Bar Advanced MT4
KEENBASE SOFTWARE SOLUTIONS
Despite the popularity of inside bar pattern among the traders, using it as a standalone signal doesn't provide any edge in the market. KT Inside Bar Advanced indicator solves this problem by combining the classic inside bar pattern with the "ECE" cycle and Fibonacci extensions. Using this indicator in place of our classic inside bar indicator will provide a tremendous advantage and edge in the market. What is the ECE cycle? In financial markets, the price never moves in a straight line but u
KT Inside Bar Hunter MT4
KEENBASE SOFTWARE SOLUTIONS
Despite the popularity of inside bar pattern among traders, using it as a standalone entry signal doesn't provide any evidentiary advantage. KT Inside Bar Hunter trades only selected inside bar patterns using some preassessment and ECE price action cycle. Trading Strategy On successful detection of the required pattern, EA places a pending order in the direction of the forecasted price expansion phase. Pending orders are canceled if they are not triggered within the next bar. Once triggered, ac
Filtrer:
Aucun avis
Répondre à l'avis