• Обзор
  • Отзывы (13)
  • Обсуждение (59)
  • Что нового

Blahtech Supply Demand MT5

4.45

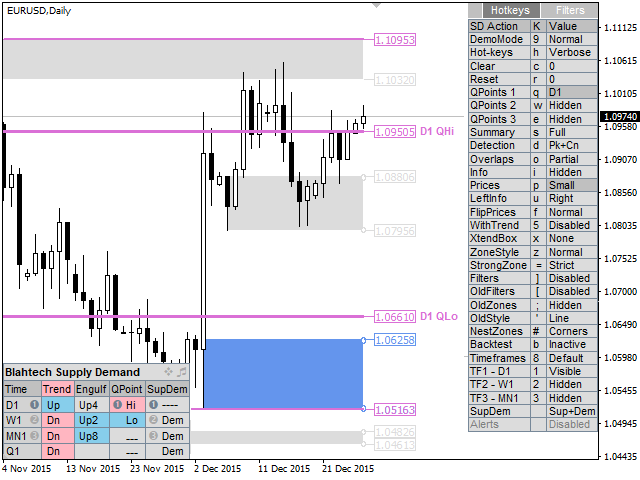
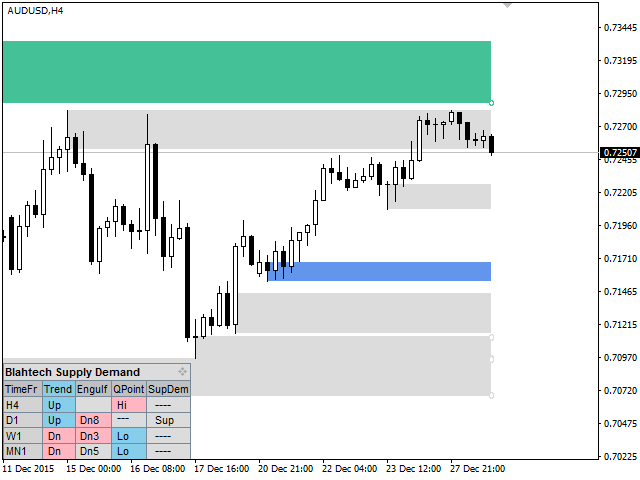
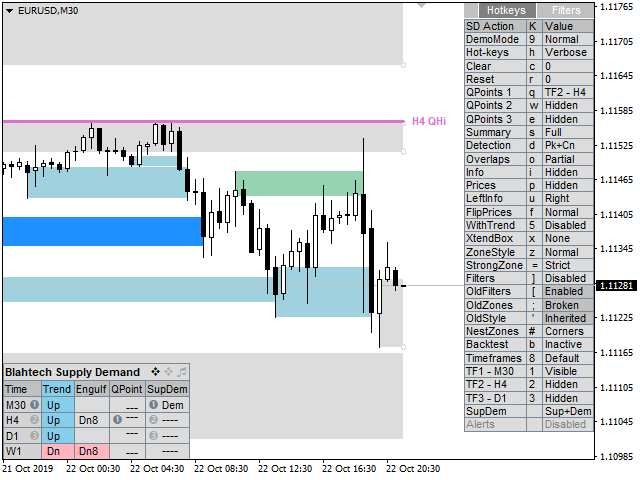
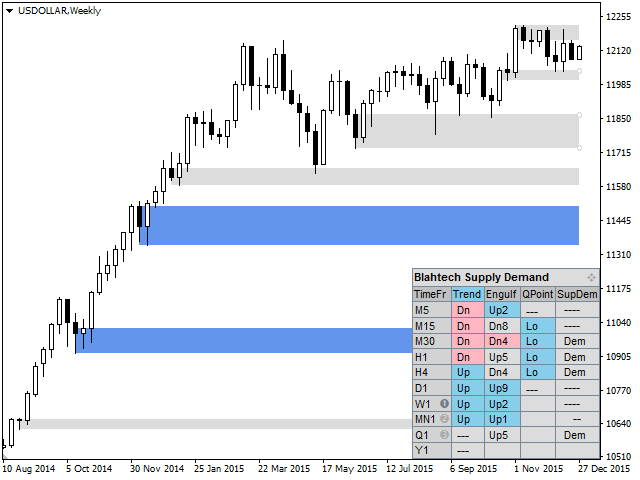
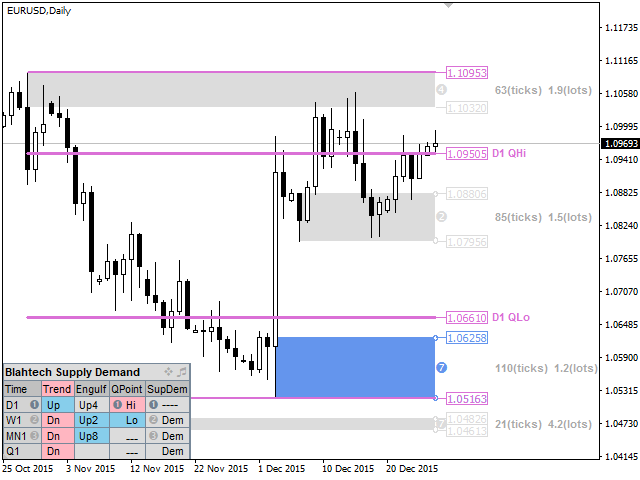
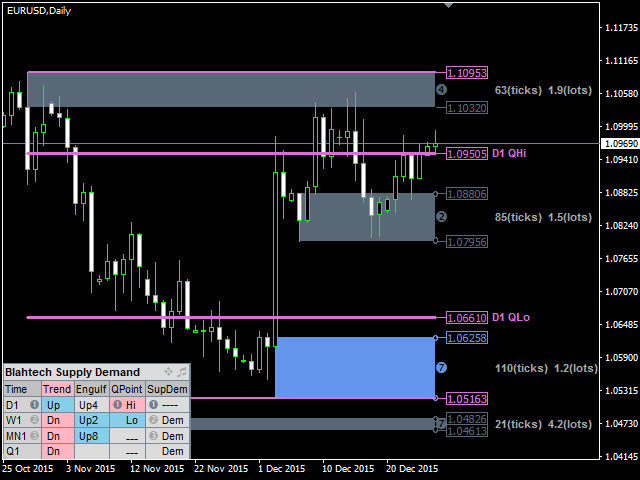
Индикатор Supply Demand использует предыдущее ценовое действие для выявления потенциального дисбаланса между покупателями и продавцами. Ключевым является определение зон с лучшими возможностями, а не просто вероятностей.

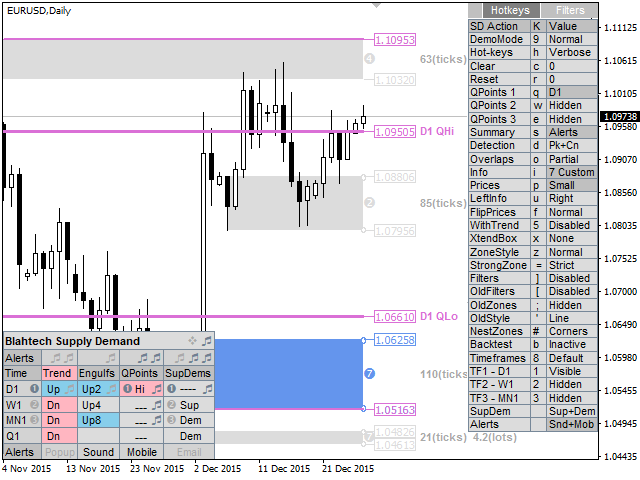
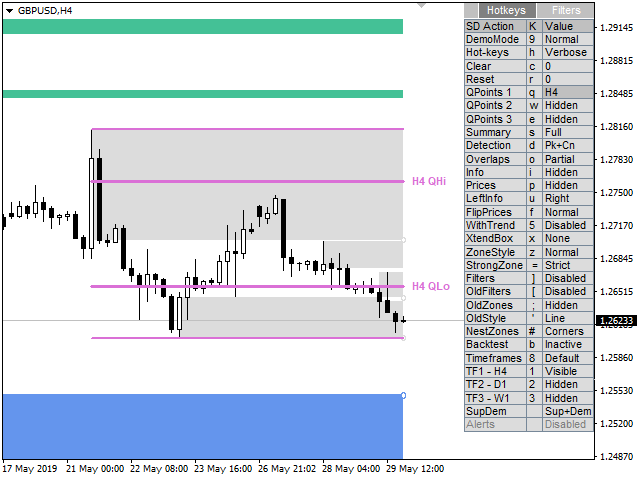
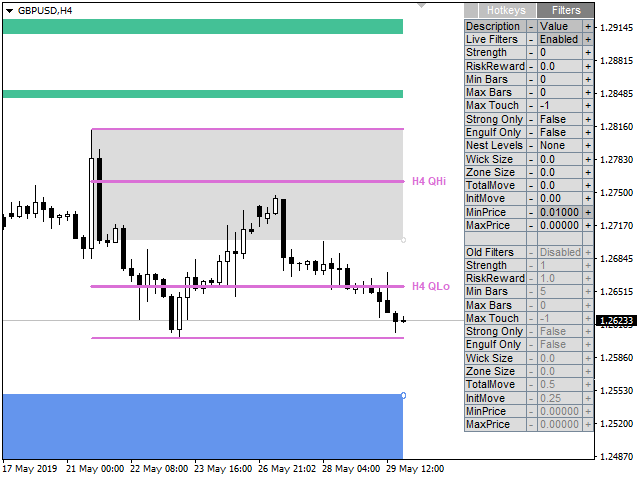
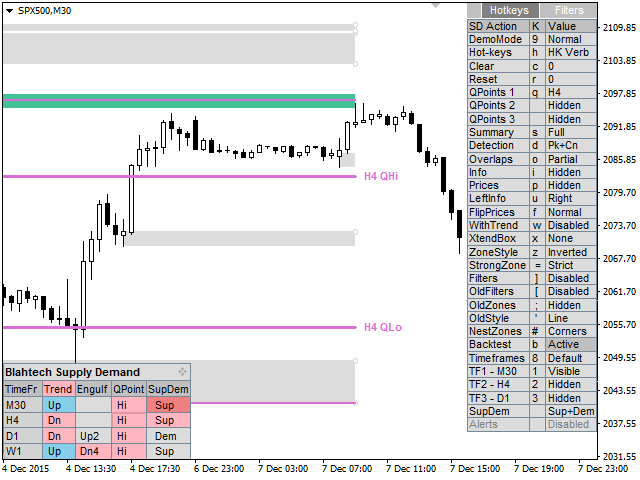
Индикатор Blahtech Supply Demand обеспечивает функционал, не доступный ни в одной платформе. Этот индикатор 4 в 1 не только выделяет зоны с более высокой вероятностью на основе механизма оценки силы по множественным критериям, но также комбинирует его с мульти-таймфреймовым анализом тренда, ранее подтвержденными свинг-движениями и детекторами поглощения. Индикатор включает в себя удобный и простой интерфейс, а также инновационный режим тестирования на истории, благодаря чему это незаменимый инструмент для всех трейдеров, торгующих на основе анализа спроса и предложения.


Links [ Install | Update | Documentation & Training ]


Основные особенности

  • Мультитаймфреймовое отображение
  • Тест по истории непосредственно на графике
  • Панель информации
  • Анализ тренда по нескольким таймфреймам
  • Подтвержденные свинг-движения 
  • Механизм оценки силы зоны 
  • Расширенный поиск уровней 
  • Квартальные и годовые уровни


Отзывы 13
smhczd
54
smhczd 2022.12.29 21:30 
 

At first I rented the indicator for 1 month to understand how it's working and see if it really gives what it promises, I watched the youtube video several times to get the most of it and after 1 month of trial with various settings, I got convinced that it really helps with your trading, and just to be %100 sure I rented it for another 3 months and I in this period I have been testing the indicator and my knowledge about it on demo and have seen wonders :) so now I can say that it is really perfect for the ones who are looking for supply & demand indicator (which is actually the basics of technical analysis no matter if you're a scalper or day/swing trader) and as my period ends I will definitely buy it . Especially if you're working with several instruments, it just makes wonders that all you need to do is check the supply & demand areas (especially nested ones with higher timeframes) and set alarms on or close to those levels and check how the price is approaching those levels. I tried hundreds of free and paid indicators in 3 years of trading life and I can say that this is literally a good indicator which eases your trading process because as all of us know indicators are not the basics of trading but if you know how to use them properly, they may lessen your workload in great extent and make a real contribution to your trading adventure. It is so obvious that Dee and her team literally knows what trading is and their product is no bullshit but just a real working tool that came up at the end of a scientific research & development (as an engineer I can see it clearly:). To sum up, if you are looking for a supply & demand indicator, just try it at least for 1 month . Try to understand fully how it works, especially the backtest mode is perfect for it and I am pretty sure that you'll get the benefits that you've been looking for. Thank you Blahtech !

RiaB
59
RiaB 2022.11.14 21:07 
 

I've been using this indicator for over a year and can definitely recommend this reliable and effective tool showing high probability zones on multiple timeframes. Other functionalities include detailed info on the zones and their strength, trend indicator and backtesting mode.

boxtrader
66
boxtrader 2022.06.25 21:44 
 

Amazing tool to identify Supply & Demand levels on any chart timeframe. Tremendous flexibilty in configuring alerts and display options. Found an issue with duplicate alerts in a previous version and Blahtech quickly resolved for me. Would definitely recommend!

Рекомендуем также
Индикатор кумулятивной дельты Как считает большинство трейдеров, цена движется под давление рыночных покупок или продаж. Когда кто-то выкупает стоящий в стакане оффер, то сделка проходит как "покупка". Если же кто-то наливает в стоящий в стакане бид - сделка идет с направлением "продажа". Дельта - это разница между покупками и продажами. А кумулятивная дельта - разница между покупками и продажами накопленным итогом за определенный период времени. Она позволяет видеть, кто в настоящий момент конт
50 USD
Premium level - это уникальный индикатор с точностью правильных прогнозов  более 80%!  Данный индикатор тестировался более двух месяцев лучшими Специалистами в области Трейдинга!  Индикатор авторский такого вы больше не где не найдете!  По скриншотах можете сами увидеть точностью данного инструмента!  1 отлично подходит для торговли бинарными опционами со временем экспирации на 1 свечу. 2 работает на всех валютных парах, акциях, сырье, криптовалютах Инструкция: Как только появляется красная стре
1 100 USD
Wapv Price and volume
Eduardo Da Costa Custodio Santos
Индикатор цены и объема WAPV для MT5 является частью набора инструментов (Wyckoff Academy Wave Market) и (Wyckoff Academy Price and Volume). Индикатор цены и объема WAPV для MT5 был создан, чтобы упростить визуализацию движения объема на графике интуитивно понятным способом. С его помощью можно наблюдать моменты пикового объема и моменты, когда рынок не представляет профессионального интереса. Определите моменты, когда рынок движется по инерции, а не по движению «умных денег». Он состоит из 4 цв
40 USD
Индикатор автоматически рассчитывает и строит уровни поддержки и сопротивления Фибоначчи - один из самых эффективных инструментов для анализа рынка. Для расчёта используются усреднённые ценовые данные по выбранному периоду и таймфрейму. В качестве начала и окончания движения взят минимум и максимум за этот период. Уровни Фибоначчи позволяют увидеть потенциальные ориентиры, около которых движение цены может замедлиться или развернуться, то есть используются для прогнозирования дальнейшего движени
30 USD
Noize Absorption Index - is the manual trading system that measures the difference of pressure between bears forces and bulls forces. Green line - is a noize free index that showing curent situation. Zero value of index shows totally choppy/flat market.Values above zero level shows how powerfull bullish wave is and values below zero measures bearish forces.Up arrow appears on bearish market when it's ready to reverse, dn arrow appears on weak bullish market, as a result of reverse expectation.
199 USD
Trend Fibonacci is a unique indicator that combines a power of Fibonacci sequences and ranges. How to read: - There are three zones --> red, gold and green - Red candlestick = downtrend - Green candlestick = uptrend   - Gold candlestick = no established trend Inputs: Per = number of bars used for calculations FirstRatio = first Fibonacci ratio (Or use any ratio you want) SecondRatio = second Fibonacci ratio (Or use any ratio you want) !! IF YOU PURCHASE THE INDICATOR, CONTACT ME FOR
47 USD
No Demand No Supply MT5
Trade The Volume Waves Single Member P.C.
No Demand No Supply   This indicator identifies   No Demand –No Supply candles  to your chart and plots volume bars colored according to the signal. It can be applied to all timeframes or to a specific one only. It can also be used as regular volume indicator  with exceptional future of WEIGHTED VOLUME. Furthermore is has an alert notification, sound and email when a signals occurs. The indicator does not repaint but the alert will come on two candles back due to the definition of No Demand No S
80 USD
BoxChart MT5
Evgeny Shevtsov
5 (6)
Рынок несправедлив, хотя бы потому, что всего лишь 10% игроков управляют 90% капитала. У рядового трейдера мало шансов, чтобы противостоять этим «хищникам». Но выход есть, необходимо всего лишь перейти на другую сторону, необходимо находиться в числе этих 10% «акул», научиться распознавать их намерения и двигаться вместе с ними. Объем - это единственный опережающий фактор, который безупречно работает на любом периоде и любом торговом инструменте. Сначала зарождается и накапливается объем, и толь
33 USD
Introduction to Chart Pattern MT Chart Pattern MT is a chart pattern scanner to detect the triangle pattern, falling wedge pattern, rising wedge pattern, channel pattern and so on. Chart Pattern MT uses highly sophisticated chart pattern detection algorithm. However, we have designed it in the easy to use with intuitive user interface. Chart Pattern MT will show all the patterns in your chart in the most efficient format for your trading. You do not have to do tedious manual pattern detection an
180 USD
Об индикаторе: DALA Forecast - универсальный инструмент предсказания динамики временных рядов любой природы. Для предсказания используется модифицированные методы анализа нелинейной динамики, на основе которых строится предсказательная модель с применением методов машинного обучения.  Для получения ознакомительной версии индикатора вы можете связаться со мной в личных сообщениях. Как пользоваться индикатором: Примените индикатор к выбранному вами финансовому интрументу или индикатору с нужным
30 USD
Laguerre SuperTrend Clouds   adds an Adaptive Laguerre averaging algorithm and alerts to the widely popular SuperTrend indicator. As the name suggests,   Laguerre SuperTrend Clouds (LSC)   is a trending indicator which works best in trendy (not choppy) markets. The SuperTrend is an extremely popular indicator for intraday and daily trading, and can be used on any timeframe. Incorporating Laguerre's equation to this can facilitate more robust trend detection and smoother filters. The LSC uses the
30 USD
The Accumulation / Distribution is an indicator which was essentially designed to measure underlying supply and demand. It accomplishes this by trying to determine whether traders are actually accumulating (buying) or distributing (selling). This indicator should be more accurate than other default MT5 AD indicator for measuring buy/sell pressure by volume, identifying trend change through divergence and calculating Accumulation/Distribution (A/D) level. Application: - Buy/sell pressure: above
45 USD
Индикатор строит текущие котировки, которые можно сравнить с историческими и на этом основании сделать прогноз ценового движения. Индикатор имеет текстовое поле для быстрой навигации к нужной дате. Параметры : Symbol - выбор символа, который будет отображать индикатор; SymbolPeriod - выбор периода, с которого индикатор будет брать данные; IndicatorColor - цвет индикатора; Inverse - true переворачивает котировки, false - исходный вид; Далее идут настройки текстового поля, в которое можн
55 USD
Индикатор паттерна 31 ("Длинный остров") из книги Томас Н. Булковский "Полная энциклопедия графических ценовых моделей". Второй гэп в обратном направлении. Параметры: Alerts - Включение алертов при появлении стрелки   Push - Отправка Push-уведомления при появлении стрелки (требуется настройка в терминале) GapSize - Минимальный размер гэпа в пунктах ArrowType - Значок: от 1 до 17 ArrowVShift - Сдвиг значков по вертикали в пунктах   ShowLevels - Показывать уровни ColUp - Цвет линий вверх ColDn
30 USD
Индикатор Supply and Demand Zones - один из лучших инструментов, которые мы когда-либо создавали. Этот замечательный инструмент автоматически рисует зоны спроса и предложения - лучшие места для открытия и закрытия позиций. Он имеет множество дополнительных функций, таких как поддержка зон на нескольких таймфреймах, отображение ширины зон, уведомления об измененных зонах и многое другое. Благодаря фрактальности рынка, этот индикатор можно использовать для любого вида торговли. Не имеет значения,
99 USD
Концепция спроса и предложения с возвратом к среднему значению Концепция торговли по спросу и предложению полагается на несовпадение объемов покупок и продаж на финансовых рынках. Для обычных трейдеров зоны спроса и предложения служат точками разворота. При рассмотрении первоначальной концепции было обнаружено, что первоначальная торговля по спросу и предложению может выполняться лучше на периоде возврата к среднему значению, а не на периоде тренда. Для демонстрации этой концепции, чтобы какая-л
80 USD
ini adalah indikator khusus digunakan untuk trading di binary.com dengan pair volatility 75. indikator ini sangat simpel dan mudah digunakan baik untuk yang sudah profesional atau pun yang baru dalam dunia trading terutama yang baru di market volatility 75.indikator ini lebih bertujuan untuk scalping trader dan menggunakan timeframe M1 sebagai acuan untuk entry. adapun jika ingin mempelajari lebih lanjut bisa menghubungi di telegram  https://t.me/shadowbreakerfx . untuk SOP lengkap silahkan klik
110 USD
This Indicator comes handy for everyone who uses Support and Resistance zones when trading. It will not only show you all major Supp/Res zones on the chart, but it will also notify you in a case of possible entry signal. Thanks to its customization possibilities, it will be the only indicator you will need when it comes down to trading Supp and Resistance zones.  !! If you decide to purchase the product, please contact me for further support and useful tips !! 
57 USD
Профиль Рынка (Market Profile) определяет ряд типов дней, которые помогают трейдеру распознать поведение рынка. Ключевая особенность - это область значений (Value Area), представляющая диапазон ценового действия, в котором произошло 70% торговли. Понимание области значений может помочь трейдерам вникнуть в направление рынка и установить торговлю с более высокими шансами на успех. Это отличное дополнение к любой системе, которую вы возможно используете. Blahtech Limited представляет сообществу Me
99 USD
Tunafish EA
Ismaele Daniele Lodetti
Tunafish EA is the most efficient EA on my profile. I spent a lot of time and effort to make this software sophisticated with possibilities of high potential returns while keeping the drawdown below 25%. The algorithms of the robot provide investors of any level of training with an investment opportunity that is both safe and aggressive. Tunafish EA imitating the work of the brain, capable of learning and adapting to changing conditions and predicting situations. When applied to trading in fina
69 USD
Order Book, известный также как Market Book, глубина рынка, стакан цен, Level 2, - это предоставляемая брокером динамически обновляемая таблица с данными по текущим объемам торговых заявок на покупку и продажу для различных уровней цен вблизи Bid и Ask конкретного финансового инструмента. MetaTrader 5 предоставляет возможность трансляции стакана цен , но только в реальном времени. Данный индикатор OrderBook Cumulative Indicator позволяет аккумулировать данные стакана онлайн и визуализировать их
49 USD
Этот индикатор покажет вам значения TP и SL (в этой валюте), которые вы уже установили для каждого ордера на графиках (закрытые от линии транзакции/ордера), что очень поможет вам оценить вашу прибыль и убыток для каждого ордера. И он также показывает вам значения PIP. Показанный формат - «Валютные значения нашей прибыли или убытка / значений PIP». Значение TP будет отображаться зеленым цветом, а значение SL — красным. По любым вопросам или для получения дополнительной информации, пожалуйста,
99 USD
[ MT4 Version ] Supply and Demand Multitimeframe Supply and Demand Multitimeframe is the first indicator in the market that combines multiple aspects like trading volume, price structure and momentum to identify Supply and Demand zones for every asset. The Supply and Demand indicator analyzes simultaneously up to 4 different TFs and represents their information in the current graph. Its interactive UI highlights everytime the price enters a Supply or Demand zone even if the zones are not visible
224 USD
MetaTrend M5
Vahidreza Heidar Gholami
5 (2)
Meta Trend Indicator is an efficient way to forecast and detect the trend in any market. It reveals the trend, support and resistance levels, volatility and the maximum potential target, all in one indicator. To adapt to the price and to decrease consecutive trend failures, the internal trend detector algorithm studies the market and dynamically chooses the right values for the internal parameters. This indicator is a perfect trend filter for any strategy or expert advisor. Features Super Adapti
99 USD
Market profile was developed by Peter Steidlmayer in the second half of last century. This is a very effective tool if you understand the nature and usage. It's not like common tools like EMA, RSI, MACD or Bollinger Bands. It operates independently of price, not based on price but its core is volume. The volume is normal, as the instrument is sung everywhere. But the special thing here is that the Market Profile represents the volume at each price level. 1. Price Histogram The Price Histogram
50 USD
Description: The Volume Profile displays detailed informations of historical trading activities at certain price levels (Market Profile). Locate the areas with the best prices in the market and get an advantage over other market participants. Support: The indicator is constantly being developed and improved. Please do not hesitate to contact me via the MQL5 Platform. I am very grateful about any Bug report, so that i can constantly improve the indicator. I appreciate any public review for this
140 USD
Индикатор паттернов 24, 25, 26 и 27 ("Голова и плечи", "Комплексная голова и плечи") из книги Томас Н. Булковский "Полная энциклопедия графических ценовых моделей".  Параметры: Alerts - Включение алертов при появлении стрелки   Push - Отправка Push-уведомления при появлении стрелки (требуется настройка в терминале) PeriodBars - Период индикатора K - Дополнительный параметр влияющий на точность распознавания и форму паттерна. Чем меньше значение, тем ровнее в ряд должны располагаться верши
30 USD
Renko Gold
Ignacio Agustin Mene Franco
Renko Gold! clearly indicates the floors and ceilings where it goes from 4 lines, the line below that marks the floor in green confirming with the thinnest line clarifies the purchase entry, the same is for sale, the top line marks the ceiling and the thinnest red line marks the sale, This indicator works for all temporalities! For Forex and Synthetic Indices markets! It also works for crypto markets! Good profit! World Investor.
40 USD
Before installing the HeatMap indicator make sure you are using a broker that gives you access to the Depth of market (DOM) !! This indicator creates a heatmap on your chart allowing you to see the buy or sell limit orders easily and in real time. You have the possibility to change the setting and the colors of the HeatMap in order to adapt to all markets and all charts. Here is an example of a setting you can use with the NASDAQ100 on the AMPGlobal broker :  https://www.youtube.com/watch?v=x0
80 USD
МТФ-индикатор уровней поддержки и сопротивления, построенных на экстремумах индикаторов Advanced ZigZag Dynamic и/или Extended Fractals с отключаемым ценовым значением в виде меток. Для режима МТФ можно выбрать все более старшие ТФ. По умолчанию уровни строятся на основе точек индикатора "Зигзаг", можно также использовать для построения точки индикатора Фракталов совместно с Зигзагом или вместо него. Для упрощения работы и экономии процессорного времени расчёт происходит один раз на каждом баре
30 USD
С этим продуктом покупают
Топовый индикатор МТ5, дающий сигналы для входа в сделки без перерисовки! Идеальные точки входа в сделки для  валют, крипты, металлов, акций, индексов !  Смотрите  видео  (6:22) с примером отработки всего одного сигнала, окупившего индикатор. Версия индикатора для MT4 Преимущества индикатора Сигналы на вход без перерисовки Если сигнал появился, он никуда НЕ исчезает! В отличие от индикаторов с перерисовкой, которые ведут к потере депозита, потому что могут показать сигнал, а потом убрать его.
125 USD
Этот индикатор является уникальным, качественным и доступным инструментом для торговли, включающим в себя наши собственные разработки и новую формулу. В обновленной версии появилась возможность отображать зоны двух таймфреймов. Это означает, что вам будут доступны зоны не только на старшем ТФ, а сразу с двух таймфреймов - таймфрейма графика и старшего: отображение вложенных зон. Обновление обязательно понравится всем трейдерам, торгующим по зонам спроса и предложения. Важная информация Для мак
199 USD
TPA True Price Action indicator reveals the true price action of the market makers through 100% non-repainting signals strictly at the close of a candle! TPA shows entries and re-entries, every time the bulls are definitely stronger than the bears and vice versa. Not to confuse with red/green candles. The shift of power gets confirmed at the earliest stage and is ONE exit strategy of several. There are available now two free parts of the TPA User Guide for our customers. The first "The Basics"
168 USD
Это, пожалуй, самый полный индикатор автоматического распознавания гармонического ценообразования, который вы можете найти для платформы MetaTrader. Он обнаруживает 19 различных паттернов, воспринимает проекции Фибоначчи так же серьезно, как и вы, отображает зону потенциального разворота (PRZ) и находит подходящие уровни стоп-лосс и тейк-профит. [ Руководство по установке | Руководство по обновлению | Устранение неполадок | FAQ | Все продукты ] Он обнаруживает 19 различных гармонических цен
249 USD
ACB Breakout Arrows MT5
KEENBASE SOFTWARE SOLUTIONS
5 (1)
Индикатор ACB Breakout Arrows формирует важные сигналы на вход в рынок, определяя специальные паттерны пробоя. Индикатор постоянно сканирует график, ожидая появления импульса в одном направлении, и генерирует точный сигнал входа прямо перед большим движением. Основные возможности: Не перерисовывается! Показывает уровни стоп-лосс и тейк-профит. Подходит для внутридневых трейдеров, свинг-трейдеров и скальперов. Оптимизированный алгоритм для повышения точности сигналов. Предварительно рассчитыва
145 USD
Royal Wave Pro M5
Vahidreza Heidar Gholami
3.67 (3)
Royal Wave is a Trend-Power oscillator which has been programmed to locate and signal low-risk entry and exit zones. Its core algorithm statistically analyzes the market and generates trading signals for overbought, oversold and low volatile areas. By using a well-designed alerting system, this indicator makes it easier to make proper decisions regarding where to enter and where to exit trades. Features Trend-Power Algorithm Low risk Entry Zones and Exit Zones Predictions for Overbought and Over
129 USD
EFW Analytics исходит из принципа "Мы торгуем, потому что на финансовом рынке есть закономерности". EFW Analytics - набор инструментов для повышения эффективности торговли путем обнаружения повторяющихся фрактальных геометрических паттернов на финансовом рынке (пятая закономерность). EFW Analytics - один из нескольких инструментов, поддерживающих торговую логику без необходимости тестирования на истории. Инструмент состоит из трех частей: Equilibrium Fractal Wave Index - индекс равновесной фракт
200 USD
XQ Indicator MT5
Marzena Maria Szmit
5 (1)
The signal conditions are a combination of three indicators, and XQ Forex Indicators only display  medium and long-term trends . The indicator's efficacy has been improved with the addition of a filter that blocks out false signals. The XQ Forex Indicator can be used on  FX pairs, CFDs, and Cryptocurrencies . There are two type of signals:  Buy or Sell and Big Long or Big Short It is possible to enable sending emails when a major trend-change signal is detected, as well as to display the alerts
179 USD
MetaBands M5
Vahidreza Heidar Gholami
5 (2)
MetaBands использует мощные и уникальные алгоритмы для построения каналов и обнаружения тенденций, чтобы предоставлять трейдерам потенциальные точки для входа и выхода из сделок. Это индикатор канала плюс мощный индикатор тенденций. Он включает различные типы каналов, которые могут быть объединены для создания новых каналов, просто используя параметры ввода. MetaBands использует все типы оповещений, чтобы уведомлять пользователей о событиях на рынке. Особенности Поддерживает большинство алгоритм
129 USD
Royal Scalping Indicator is an advanced price adaptive indicator designed to generate high-quality trading signals. Built-in multi-timeframe and multi-currency capabilities make it even more powerful to have configurations based on different symbols and timeframes. This indicator is perfect for scalp trades as well as swing trades. Royal Scalping is not just an indicator, but a trading strategy itself. Features Price Adaptive Trend Detector Algorithm Multi-Timeframe and Multi-Currency Trend Low
149 USD
Trend Trading - это индикатор, предназначенный для получения максимальной прибыли от трендов, происходящих на рынке, путем определения времени отката и прорыва. Он находит торговые возможности, анализируя, что делает цена во время установленных тенденций. [ Руководство по установке | Руководство по обновлению | Устранение неполадок | FAQ | Все продукты ] Торгуйте на финансовых рынках с уверенностью и эффективностью Прибыль от устоявшихся тенденций без проволочек Признать прибыльные откаты,
175 USD
Представляем вам индикатор iVISTscalp 5 , который не только уникален, но и эффективен в использовании при анализе торговых операциях. Этот индикатор основывается на временных данных и является результатом многолетнего опыта и глубокого анализа финансовых рынков. Индикатор iVISTscalp 5 отличный помощник для ручной торговли. Удобство, простота и визуализация. Все самое сложное спрятано внутри. Мы максимум упростили настройки и использование индикатора iVISTscalp 5 . Индикатор подходит для всех
500 USD
Индикатор Price Action  finder Multi является мультивалютным и мультитаймфреймовым индикатором. Он ищет паттерны системы Price Action сразу на всех стандартный тайм фреймах и на большом (до 60-ти) количестве инструментов (валюты, акции, металлы и др). Полученные паттерны индикатор помещает в таблицу в нижней части экрана.  Паттерны: На текущий момент в индикаторе присутствуют паттерны: Внешний бар , Внутренний бар , Пин бар , Бар силы , PPR , а также паттерны свечного анализа Перевёрнутый моло
149 USD
Stargogs Spike Catcher V3.11 This Indicator is Developed To milk the BOOM and CRASH indices . Send me Message if you need any help with the indicator.  CHECK OUT THE STARGOGS SPIKE CATCHER EA/ROBOT V3: CLICK HERE ALSO CHECK OUT SECOND TO NONEFX SPIKE CATCHER:   CLICK HERE STARGOGS SPIKE CATCHER V3.11 WHATS NEW! Brand New Strategy. This is the Indicator you need for 2023. The Indicator Gives you an Entry at a time when conditions are met and you should use TP & SL. New Trendline that changes col
100 USD
AI Forecast MT5
Leonardo Antonio Camacaro Armas
Discover our extraordinary AI-powered Metatrader 4 indicator, designed to provide you with accurate forecasts on the price reaction of a financial asset based on a specific level! Our product guides you through three simple steps to obtain reliable results and make informed decisions: ️   Step 1:   The user selects the entry level and the two possible outcomes (Take Profit and Stop Loss) and clicks on calculate. In an instant, the full potential of the indicator is unleashed. ️   Step 2:
100 USD
Свинг-трейдинг - это первый индикатор, предназначенный для обнаружения колебаний в направлении тренда и возможных разворотов. Он использует базовый подход свинговой торговли, широко описанный в торговой литературе. Индикатор изучает несколько векторов цен и времени для отслеживания направления совокупного тренда и выявляет ситуации, когда рынок перепродан или перекуплен и готов к исправлению. [ Руководство по установке | Руководство по обновлению | Устранение неполадок | FAQ | Все продукты ]
175 USD
WAPV Full MT5
Eduardo Da Costa Custodio Santos
## Профессионально работать с WAPV Full и иметь возможность отслеживать где деньги крупных игроков Представьте, что у вас в руках инструмент, который самостоятельно выполняет чтение основных Игроков рынка с указанием лучших торговых регионов на основе анализа цены и объема. WAPV Full — это законченный инструмент, на 100 % ориентированный на операционную деятельность Р. Вайкоффа. В дополнение к отображению рыночных движений в торговых волнах, он также отображает рынок, читая цену и объем. Профес
199 USD
ToolBox 360 is the swiss knife of all indicators. It is full packed with useful tools to help you with your trading. It can be used to find best entry and exit points and help you to decide if you should open a trade or not. It shows market trends, candlestick formations outside / inside bars and you can sett time based allerts. Main features: Time based Fibonacci lines Choose a start and end time and the indicator shows you Fibonacci lines within the selected time range including range high
399 USD
Introduction to X3 Chart Pattern Scanner X3 Cherart Pattern Scanner is the non-repainting and non-lagging indicator detecting X3 chart patterns including Harmonic pattern, Elliott Wave pattern, X3 patterns, and Japanese Candlestick patterns. Historical patterns match with signal patterns. Hence, you can readily develop the solid trading strategy in your chart. More importantly, this superb pattern scanner can detect the optimal pattern of its kind. In addition, you can switch on and off individu
250 USD
Golden Spikes Detector This indicator is based on an advanced strategy primarily for trading spikes on Boom and Crash Indices. Complex algorithms were implanted to detect high probability entries only. It alerts on potential Buy and Sell entries. To trade spikes on the Deriv or Binary broker, only take Buy Boom and Sell Cash alerts. It was optimised for 5-minute timeframe. Features ·          Sends push notifications to mobile phone ·          Pop up and sound alerts on computer or laptop ·     
150 USD
VTrende Pro - МТФ индикатор для трендовой торговли с панелью индикации для МТ5 !!! - Подробное описание на русском языке под видео (на Youtube) - !!! Хотя сигналы индикатора VTrende Pro можно использовать, как сигналы полноценной торговой системы, рекомендуется применять их в связке с ТС Билла Вильямса. VTrende Pro - это расширенная версия индикатора VTrende . Отличие Pro версии от VTrende: - Временные зоны - Сигнал V - сигнал 1-2 волн Основная задача индикатора - определить точки изм
697 USD
The Volume by Price Indicator for MetaTrader 5 features Volume Profile and Market Profile TPO (Time Price Opportunity). Get valuable insights out of currencies, equities and commodities data. Gain an edge trading financial markets. Volume and TPO histogram bar, line and metric charts. TPO letter and block marker charts including split structures. Positioning and styling options to suit the user's needs and context. Volume Profile and Market Profile TPO Point of Control (VPOC and TPOC), Imbalanc
179.95 USD
Buy and Sell Alerts when price breaks out following strict price action. Sends Alerts – #On MT5 To Your Phone To Your Email Does not repaint . Works on any Forex pair, any timeframe. 10 Activations allowed so you are free from limitations >> MT4 Version Here Description When the indicator detects a possible trade, it sends you an alert. It shows you where to place your trade and even suggests Stop Loss and Take Profits for you. How To Trade With The Breakout Entry Signals Indicator
297 USD
The Quantum VPOC indicator has been developed to expand the two dimensional study of volume and price, to a three dimensional one which embraces time. The volume/price/time relationship then provides real insight to the inner workings of the market and the heartbeat of sentiment and risk which drives the price action accordingly. The Quantum VPOC indicator displays several key pieces of information on the chart as follows: Volume Profile - this appears as a histogram of volume on the vertical pr
197 USD
Introducing the POWER TRADE indicator created by a small group of traders with a few years trading trading the financial market profitably . This is a plug and play indicator that provides you with  POWERFUL Entry signals with Profit Taking and rebound zones. The indicator Works with all MT5 trading instruments. The indicator uses previous  chart data as receipt to speculate on future market moves.
150 USD
Buy and sell signals based on Larry Williams's exponential moving average strategies 9.1, 9.2, 9.3 and 9.4 for trend reversals and continuations. To understand the logic and how to trade the signals, please check: Setup 9.1:  https://www.mql5.com/pt/market/product/50986 Setup 9.2:  https://www.mql5.com/pt/market/product/52268 Setup 9.3:  https://www.mql5.com/pt/market/product/52269 Setup 9.4:  https://www.mql5.com/pt/market/product/52273 Notices:  - This indicator displays a lot of signals.
199 USD
Устали от построения линий поддержки и сопротивления? Сопротивление поддержки - это мульти-таймфреймовый индикатор, который автоматически обнаруживает и отображает линии поддержки и сопротивления на графике с очень интересным поворотом: поскольку ценовые уровни тестируются с течением времени и его важность возрастает, линии становятся более толстыми и темными. [ Руководство по установке | Руководство по обновлению | Устранение неполадок | FAQ | Все продукты ] Повысьте технический анализ в одноч
125 USD
Trade system "PAX Multi TMA/HMA 8" for MT5 It is a ready-made trading system for trading on any instrument and any timeframe. An experienced trader on one instrument can get a profit   from 100% to 400% per week . Completely ready for manual trading and use in robots. Not redrawn signals ( See the picture ) It is convenient to work on any timeframe. Tested on metals, currency pairs, oil, international stocks, Russian stocks, cryptocurrencies, monetary and cryptocurrency indices.
144 USD
Рынок Форекс может пройти множество различных ценовых путей к достижению некоей точки в будущем. Будущее динамично. Поэтому, планирование торговли с возможным будущим сценарием является важным шагом для вашего успеха. Для этих целей представляем вашему вниманию Harmonic Pattern Scenario Planner, первый предиктивный инструмент для определения гармонических моделей в своем роде. Основные характеристики Прогнозирование будущих моделей для анализа сценариев 11 Определение гармонических моделей Авт
100 USD
Introduction to Fractal Pattern Scanner Fractal Indicator refers to the technical indicator that makes use of the fractal geometry found in the financial market. Fractal Pattern Scanner is the advanced Fractal Indicator that brings the latest trading technology after the extensive research and development work in the fractal geometry in the financial market. The most important feature in Fractal Pattern Scanner is the ability to measure the turning point probability as well as the trend probabil
185 USD
Другие продукты этого автора
Blahtech VWAP - Volume Weighted Average Price (VWAP) is the ratio of price to total volume. It provides an average price over a specified time interval.  Links [  Install  |  Update  |  Documentation   ] Feature Highlights Configurable VWAP Line Sessions, intervals, anchored or continuous Previous day settlement line Standard Deviation bands Alerts at bar close or real time Automatic Broker or Tick volumes Significantly reduced CPU usage Input Parameters Max Bars   - Restrict the number of
49 USD
Профиль Рынка (Market Profile) определяет ряд типов дней, которые помогают трейдеру распознать поведение рынка. Ключевая особенность - это область значений (Value Area), представляющая диапазон ценового действия, в котором произошло 70% торговли. Понимание области значений может помочь трейдерам вникнуть в направление рынка и установить торговлю с более высокими шансами на успех. Это отличное дополнение к любой системе, которую вы возможно используете. Blahtech Limited представляет сообществу Me
99 USD
Blahtech VWAP
Blahtech Limited
5 (1)
Blahtech VWAP - Volume Weighted Average Price (VWAP) is the ratio of price to total volume. It provides an average price over a specified time interval.  Links [  Install  |  Update  |  Documentation   ] Feature Highlights Configurable VWAP Line Sessions, intervals, anchored or continuous Previous day settlement line Standard Deviation bands Alerts at bar close or real time Automatic Broker or Tick volumes Significantly reduced CPU usage Input Parameters Max Bars   - Restrict the number of
49 USD
Индикатор Supply Demand использует предыдущее ценовое действие для выявления потенциального дисбаланса между покупателями и продавцами. Ключевым является определение зон с лучшими возможностями, а не просто вероятностей. Индикатор Blahtech Supply Demand обеспечивает функционал, не доступный ни в одной платформе. Этот индикатор 4 в 1 не только выделяет зоны с более высокой вероятностью на основе механизма оценки силы по множественным критериям, но также комбинирует его с мульти-таймфреймовым анал
99 USD
Профиль Рынка (Market Profile) определяет ряд типов дней, которые помогают трейдеру распознать поведение рынка. Ключевая особенность - это область значений (Value Area), представляющая диапазон ценового действия, в котором произошло 70% торговли. Понимание области значений может помочь трейдерам вникнуть в направление рынка и установить торговлю с более высокими шансами на успех. Это отличное дополнение к любой системе, которую вы возможно используете. Blahtech Limited представляет сообществу Me
99 USD
Over 100,000 users on MT4 and MT5 Blahtech Candle Timer displays the remaining time before the current bar closes and a new bar forms. It can be used for time management Links [  Install  |  Update  |  Training  ] Feature Highlights The only candle timer on MT4 with no stutter and no lag S electable Location Tracks server time not local time Multiple colour Schemes Configurable Text Customisable alerts and messages Optimised to reduce CPU usage Input Parameters Text Location   - Beside / Upper
FREE
Over 100,000 users on MT4 and MT5 Blahtech Candle Timer displays the remaining time before the current bar closes and a new bar forms. It can be used for time management Links [  Install  |  Update  |  Training  ] Feature Highlights The only candle timer on MT5 with no stutter and no lag S electable Location Tracks server time not local time Multiple colour Schemes Configurable Text Customisable alerts and messages Optimised to reduce CPU usage Input Parameters Text Location - Beside / Upper L
FREE
Индикатор Blahtech Daily Range отображает средний дневной диапазон вместе с диапазонами отдельных сессий. Используя дневные цены открытия в качестве опорных, индикатор показывает цели фиксированного диапазона и динамического диапазона в виде линий на графике. Эти линии четко показывают, когда происходит истощение среднего диапазона. Дневные и сессионные диапазоны могут быть полезны для подтверждения входов или для установки целей, а также являются отличным способом улучшить шансы любой торговой
34 USD
Blahtech Moving Average indicator is a multitimeframe version of the standard Moving Average indicator. It is also enhanced with customisable alerts, period breaks and other configuration options. The 50 day and 200 day moving averages are widely followed by investors and traders, with breaks above and below the MA lines considered to be signals of interest. Links [  Install  |  Update  |   Training   |   All Products  ] Feature Highlights Up to three timeframes Configurable calculation variab
FREE
Blahtech Better Volume provides an enhanced version of the vertical volume bars. Each bar is compared to the previous 20 bars. Depending on its volume, range and volume density it will be assigned a state and colour. Low Volume – Minimum volume High Churn   – Significant volume with limited movement Climax Neutral –   High volume with unclear direction Climax Up   – High volume with bullish direction Climax Dn   – High volume with bearish direction Climax Churn – High volume with restricted mo
31 USD
Индикатор Blahtech Moving Average - модифицированная версия стандартного индикатора Moving Average. Он также дополнен настраиваемыми оповещениями, разделителями периодов и другими возможностями настройки. 50-дневная и 200-дневная скользящие средние широко применяются инвесторами и трейдерами, а прорывы вверх и вниз от линий MA считаются значимыми сигналами. Основные особенности До трех таймфреймов Настраиваемые переменные для вычислений Настраиваемые оповещения и сообщения Дополнительные перио
FREE
Blahtech Fisher Transform indicator is an oscillator that displays overbought and oversold locations on the chart. The Fisher Transform algorithm transforms prices with any distribution shape into a normal distribution. The end result is a curve with sharp turning points that may help to identify bullish or bearish trends. Fisher Transform values exceeding 1.66 on the daily chart are considered to be good areas for reversal trades. Links [  Install  |  Update  |  Training   |  All Products  ]
33 USD
Blahtech Better Volume provides an enhanced version of the vertical volume bars. Each bar is compared to the previous 20 bars. Depending on its volume, range and volume density it will be assigned a state and colour. Low Volume – Minimum volume High Churn   – Significant volume with limited movement Climax Neutral –   High volume with unclear direction Climax Up   – High volume with bullish direction Climax Dn   – High volume with bearish direction Climax Churn – High volume with restricted mo
31 USD
Индикатор Blahtech Fisher Transform представляет собой осциллятор, который отображает графике области перекупленности и перепроданности. Алгоритм преобразования Фурье (Fisher Transform) преобразует цены с любой формой распределения в нормальное распределение. Конечным результатом является кривая с резкими точками разворота, которые могут помочь определить бычьи или медвежьи тренды. Значения Fisher Transform выше 1.6 на дневном графике считаются хорошими областями для сделок на разворот. Основн
33 USD
Фильтр:
smhczd
54
smhczd 2022.12.29 21:30 
 

At first I rented the indicator for 1 month to understand how it's working and see if it really gives what it promises, I watched the youtube video several times to get the most of it and after 1 month of trial with various settings, I got convinced that it really helps with your trading, and just to be %100 sure I rented it for another 3 months and I in this period I have been testing the indicator and my knowledge about it on demo and have seen wonders :) so now I can say that it is really perfect for the ones who are looking for supply & demand indicator (which is actually the basics of technical analysis no matter if you're a scalper or day/swing trader) and as my period ends I will definitely buy it . Especially if you're working with several instruments, it just makes wonders that all you need to do is check the supply & demand areas (especially nested ones with higher timeframes) and set alarms on or close to those levels and check how the price is approaching those levels. I tried hundreds of free and paid indicators in 3 years of trading life and I can say that this is literally a good indicator which eases your trading process because as all of us know indicators are not the basics of trading but if you know how to use them properly, they may lessen your workload in great extent and make a real contribution to your trading adventure. It is so obvious that Dee and her team literally knows what trading is and their product is no bullshit but just a real working tool that came up at the end of a scientific research & development (as an engineer I can see it clearly:). To sum up, if you are looking for a supply & demand indicator, just try it at least for 1 month . Try to understand fully how it works, especially the backtest mode is perfect for it and I am pretty sure that you'll get the benefits that you've been looking for. Thank you Blahtech !

RiaB
59
RiaB 2022.11.14 21:07 
 

I've been using this indicator for over a year and can definitely recommend this reliable and effective tool showing high probability zones on multiple timeframes. Other functionalities include detailed info on the zones and their strength, trend indicator and backtesting mode.

boxtrader
66
boxtrader 2022.06.25 21:44 
 

Amazing tool to identify Supply & Demand levels on any chart timeframe. Tremendous flexibilty in configuring alerts and display options. Found an issue with duplicate alerts in a previous version and Blahtech quickly resolved for me. Would definitely recommend!

Frank Paetsch
7292
Frank Paetsch 2022.01.24 10:56 
 

simly good

MAKARIOS YACOUBIAN
2793
MAKARIOS YACOUBIAN 2022.01.16 10:22 
 

one of the best coded system , many choices to adjust your zones . i will defiantly give 5 stars from experience trader to experience developer

47358640
24
47358640 2021.06.16 23:59 
 

I liked the app when I tested it on my demo account so I went ahead and bought it to use once I opened a “real” account. Unfortunately the MT5 platform is not very user friendly and it is very poor when it comes to customer support so I have not been able to fund my “real” account or link it to my other brokerage accounts like they say you are supposed to be able to do, so I can’t give a good review. My issue is more with MT5 and MQL5 than with Blahtech.

musashi69
24
musashi69 2021.05.22 16:03 
 

For all the bells and whistles the training and documentation fall well short of easy or intuitive use. I try to figure things out on my and then go for help if I need it. Even after I go to the manual I can't get some features to work or be altered as they do in the video. They manual should have enhanced screen captures which show what they are talking about and show changes. Not just pages of insufficient text.

EdiF
170
EdiF 2021.05.19 08:04 
 

One of the few high level Indicators.

Alief Nurtendron
123
Alief Nurtendron 2020.12.01 06:04 
 

plis help, how to lunc this indicator, i am beginner and can not use this, the botton of lunch indicator was gone

Scott Moore
34
Scott Moore 2020.09.27 17:40 
 

It works great with the relevant theory. Already back tested it with more recent market moves. I was specifically hoping it would work with S&P 500 and it aligned perfectly with the setups I was looking at. Coupled with market profile and specific setups it saves me time doing the math and charting points. Worth the money in my humble opinion.

arti90
52
arti90 2019.02.11 14:52 
 

its a brilliant indicator when u get a little bit used to it and understand it. good one its the money worse.

faithdefender
1525
faithdefender 2019.01.23 00:52 
 

I was not too impressed with this supply/demand indicator. It appears it may have been developed with Online Trading Academy's "program" in mind. (A very expensive course that didn't help me) The idea that a drop base drop or a rally base rally equates into a S/D zone is silly. These same DBD RBR can and often are developed by price imbalances. I even heard the proverbial "don't diddle in the middle" saying that runs rampant through the $$ OTA course. Nevertheless, this indicator carries with it the idea that these S/D pointed out by the indicator could be areas where Bank Institution left orders. The same sentiment taught by OTA. I have used the indicator and I have yet to have the "Big Banks" helping my trades. The key pad should be memorized because you depend upon the alphabet to learn how to use the indicator. Too many bells and whistles. I gave it a three because it does provide Supply/Demand levels, but nothing more than other indicators.

Jair Miranda
176
Jair Miranda 2017.04.27 05:35 
 

I bought it wrong, I thought this was for metatrader 4, there is no way to return the money so I can buy the correct one.

Even though I downloaded and installed metatrader 5 and put this indicator and it does not work for anything, it is in the browser, but it does not go to the graph

Ответ на отзыв
Версия 4.0 2022.05.12
- Overall Trend - Add "Three In A Row" option to highlight trend when all three timeframe trends align
- Hotkeys - Zone Visibility - With Trend - Hide zones with unknown trend status
- Alerts - Zone Visibility - Alow user to filter visibility independent of the display hotkey setting
Версия 3.9 2022.04.11
- New Alerts - Stop excessive alerts being generated when multiple timeframes are active
Версия 3.8 2022.02.07
- Block invalid alerts that were triggered when broker resets data feed
- Improve level tooltip texts to always include nested info
- Summary Panel - Add parameter Trend Show Consolidation Dots
- Summary Panel - Rename parameter Engulfings - Stop Loss to Engulfings - Viable Size
Версия 3.7 2021.05.05
Enhancements
- Timeframes - Add new timeframe options - Current Plus One / Two / Three
- Profiles - Add parameter "Clear Hotkeys On Terminal Close" to improve profile switching on MT5
- Offline Charts - Add support for offline charts and backtest tools with missing market data and unsynced current time

Fixes
- Summary Panel - Q Points - Improve accuracy of real time updates
- Summary Panel - Q Points - Ensure text is positioned correctly in the center of the box
- Trend Change - Incremental - Check that BarNum >= MinBarsOldZones
- Mouse Events - Keep CHART_EVENT_MOUSE_MOVE enabled if other indicators are waiting on mouse events
Версия 3.6 2021.04.20
Enhancements
- MT5 - Add support for extended timeframes
- Trend Worm - Add option to display Trend Worm and/or Consolidation Worm on the chart
(Due to a platform issue, MT5 users may need to re-attach the indicator to see the Trend Worm)

Performance
- Clear Hotkey - Improve performance of clear chart calls
- Redraw - Remove ObjectsDeleteAll calls that slow other indicators with many objects
Версия 3.5 2021.04.02
Fixes
- Summary SupDem - Apply Filters to SupDem column
- iCustom - Apply Filters to iCustom buffers
- iCustom - Improve Blahtech Expert Advisor Examples
- Alerts - Add MinBarsLevel and PriceAway filters to alerts
- Overall Move - Fix edge case where Overall Move wasn't being calculated correctly
Версия 3.4 2021.03.24
Enhancements
- Enable filters whenever an individual filter is changed in the GUI
- iCustom - Refactor EA code examples into class to support cleaner multiple instances

Fixes
- Summary SupDem - Improve highlighting of overlapped zones
- Consolidations - Fix edge case when near MaxBars
- Allow user to configure Timeframes 1-4 in any order
- Allow experts to operate on higher timeframes than the current chart period
- Change format of diff files to support iCustom development
- Only populate iCustom buffers if they are enabled and used
- Change position of Overall Move filter to the top half of the GUI
Версия 3.3 2021.03.08
Enhancements
- Summary Trend - Display dot next to the trend direction when recent bars are consolidating
- Filters - Add Max Levels filter to allow the user to restrict the number of levels on the chart
- Zone Highlight - Add parameter to change highlighting mode (None/Strength/Untouched)
- Parameters - Write simple list of changed parameters to experts log when Ctrl+Q keys are pressed
- Parameters - Create detailed report of changed parameters in Files/Blahtech directory to assist users and support

Fixes
- Q Points - Add Min Risk Reward parameter
- Trend Change - Add Min Range and rename Min Risk Reward parameters
- Overall Trend Alerts - Print all three timeframe directions in alert message
- Summary SupDem - Improve highlighting accuracy with overlapped zones
- Old Zones - Enable detection of old zones with just two bars
- Consolidation - Fix edge case in consolidation zones detection
- Hotkeys - Revert regression from 3.1 release where [ and ] were swapped round
- Expert Advisor Mode - Change to a single option named "Reserved For iCustom Calls"
Версия 3.2 2021.01.20
Enhancements
- Alerts - Add parameter "Filter Nested (Levels)" to control raising alerts for nested zones only
- Alerts - Add parameter "Trigger Alerts Early" to trigger touch/break alerts N points before the level
- Hotkey Panel - Add "Alerts Nest" button to allow user to modify the nested zone filter from the GUI
- Summary - Alerts panel - Add icon next to title to show "Trigger Early Alerts" points value
- Summary - Alerts panel - Improve alerts icon tooltips
- Touches - Increase accuracy of Touches and add optional Touch/Untouch points parameters
- Info - Add parameter to control the precision of the {lots1} substitution string
- Info - Add a second user custom format string

Fixes
- Alerts - Fix edge case where duplicate alerts could be raised
- Alerts - Remove overlaps from Retouch alerts and apply filters to New alerts
- Alerts - Don't raise alerts for levels hidden from display by the "Zone Visibility" parameter
- Alerts - Improve text format, add bid price and number of touches
- Trend Change - Modify trend change parameter to OVERLAP_ALL to improve consistency of trend reversals
- Summary Panel - Improve accuracy of summary panel when price retraces from touched levels
- Summary Panel - Optimise summary panel redraw to compensate for increased accuracy
- HotKey Panel - Adjust panel Y location when position changed to Bottom left/right
Версия 3.1 2019.10.17
- Enable left mouse click actions on Hotkey panel when keys have been reserved
Версия 3.0 2019.10.09
Enhancements
- Add a third mode to the Summary panel GUI to control all alerts
- Alow user to set individual alert timeframes for Trend, Engulfings, QPoints and Levels
- Allow M30,H4,D1 as well as 1,2,3 when setting alerts timeframe parameters
- Enable Summary Timeframe Bubble Numbers by default
- Add bubble numbers to QPoints and SupDem columns in the Summary panel
- Add option to adjust the zone start bar of a level to the begining of a consolidation
- Add Timeframe hints to the TF section of the Hotkey panel
- Add {lots3} option to Info format

Fixes
- Change default colour of QPoint 2 from MediumOrchid to PaleVoiletRed
- Change Invert Style and colour parameters to be more intuitive
- Change text colour of oversized Q Points on the chart to Gray
- Change Summary heading from TimeF to Time
- Improve the behaviour of the Q Points hotkeys
- Modify all lines drawn by the indicator to be unselectable
- Include first bar in search for max move away of zones and Q Points
- Reset hotkey settings when indicator is removed from chart or chart is closed
- Only call TerminalInfoInteger to get ctrl status when key pressed or object clicked
Версия 2.9 2019.07.16
Fix issue when backtesting beyond Max Bars
Версия 2.8 2019.06.19
Enhancements
- Add options to draw multi timeframe Q Points on the chart
- Add GUI tab within HUD panel for control of filter parameters
- Add extra filters for Nested Levels, Zone Size and Min Price Away
- Change default values for live filters to disabled
- Add option to choose method for Zone Height calculation - Default/Whole Body/Entire Candle
- Add parameters to limit zone height "Zone Height Min" and "Zone Height Max"
- Add iCustom Buffers for QPoint 1 Top Bar and QPoint 1 Bot Bar
- Add option to display Total Move in custom format
- Left clicking any description in the Hud Panel now resets the value back to its input parameter version

Fixes
- Change defaults to display more features on chart at startup
- Check UserTickSize to stop divide by zero error
- Check for empty iCustom buffer
Версия 2.7 2018.05.30
Улучшения
- Возможность отключить выделение сильных зон
- Возможность использовать текущий таймфрейм только для общего тренда
- Параметр, позволяющий изменить угол привязки окна информации
- Добавлена кнопка "Sup/Dem", позволяющая отображать только уровни спроса или предложения
- Добавлен фильтр по количеству повторных касаний
- Добавлен фильтр для уровней, которые были сформированы паттерном "Поглощение"
- Добавлен фильтр по максимальному отдалению цены
- Добавлен фильтр по возрасту старых зон в барах
- Поддержка оповещений об изменениях тренда
- Поддержка оповещений об изменениях общего тренда
Версия 2.5 2017.08.29
Улучшения
- Поддержка оповещений при касании и пробое QPoint
- Поддержка оповещений по 3 таймфреймам
- Поддержка инвертированных стилей зон для мультитаймфреймного отображения
- Запоминание горячих клавиш при перезапуске терминала
- Поддержка вызовов iCustom с более чем 64 параметрами при помощи set-файла

Изменения
- Добавлены всплывающие подсказки в графику вложенных зон
- Добавлен параметр резервирования клавиш для предотвращения конфликтов с другими продуктами
Версия 2.4 2017.07.21
- Перекомпилирован с помощью MetaEditor 1629 для поддержки облака MetaTrader
- Добавлены тултипы для отображения "горячих" клавиш
Версия 2.2 2017.04.06
Улучшения
- Поддержка дополнительных таймфреймов
- Поддержка оповещений для поглощений
- Отрисовка зон со смещением на один бар назад, если там начинается совпадающая линия
- Изменен цвет и шрифт метки QPoints, когда диапазон больше 15x среднего размера
- Отделены старые и активные фильтры для упрощения использования
- Добавлены расширенные буферы iCustom для таймфреймов два и три
- Добавлен второй демонстрационный режим, чтобы показать дополнительные таймфреймы
= Панель информации
- Поддержка скрытия/показа зон при нажатии на значения таймфреймов
- Поддержка изменения фокуса при нажатии на значения QPoint
- Отключено выделение значения QPoint розовым/синим цветом, когда диапазон меньше 15x среднего диапазона
- Изменено выделение значений SupDem, теперь для этого используются только розовый и синий цвета
= Горячие клавиши
- Изменен порядок изменения горячих клавиш при нажатой клавише "Shift"
- Сдвиг начала и конца зоны на один бар вперед при нажатии на клавишу "X"

Исправления
- Запоминание установленного пользователем таймфрейма QPoint при переключении таймфрейма графика
- Исправлен расчет среднего значения бара, чтобы соответствовать значениям версии 1.0 (регрессионная ошибка)
- Перекомпилирован в соответствии с новейшими изменениями платформы MetaTrader
- Все глобальные переменные изменены на постоянные выражения
Версия 2.1 2017.01.19
- Исправлен вызов iCustom
- Уменьшен максимум каждого тика для оптимизации быстродействия советника
- Добавлен режим советника для пропуска создания и отображения объектов