• 概述
  • 评论 (15)
  • 评论 (60)
  • 新特性

Blahtech Supply Demand MT5

4.54

Was: $299  Now: $149  

Supply Demand uses previous price action to identify potential imbalances between buyers and sellers. The key is to identify the better odds zones, not just the untouched ones.

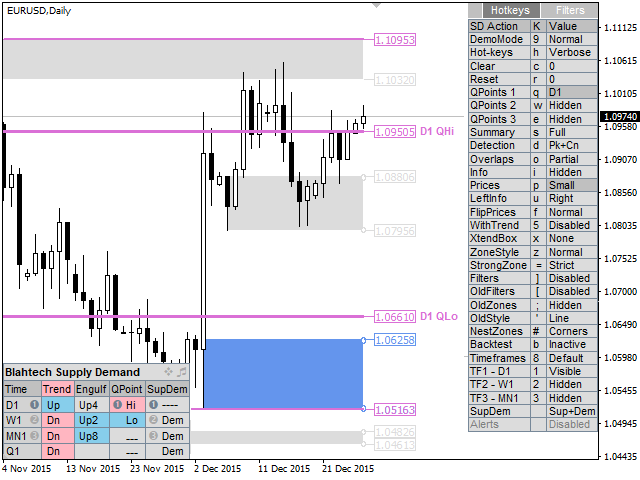
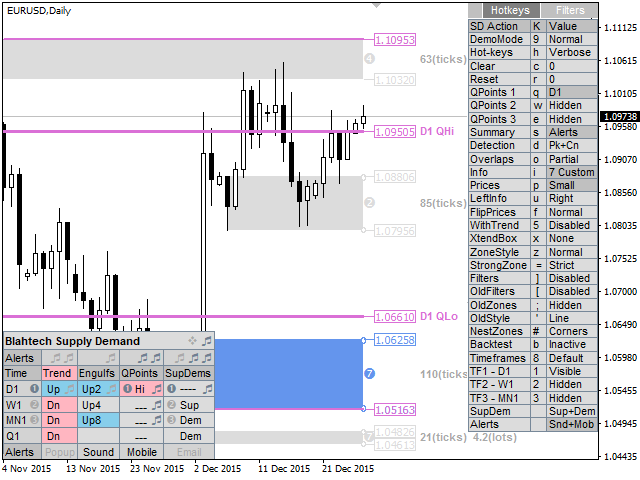
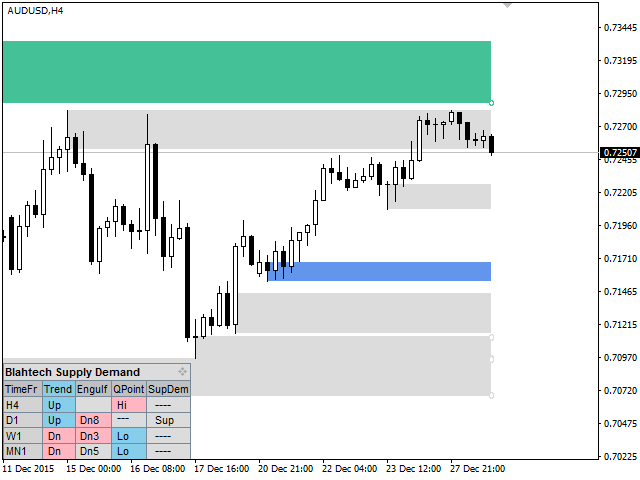
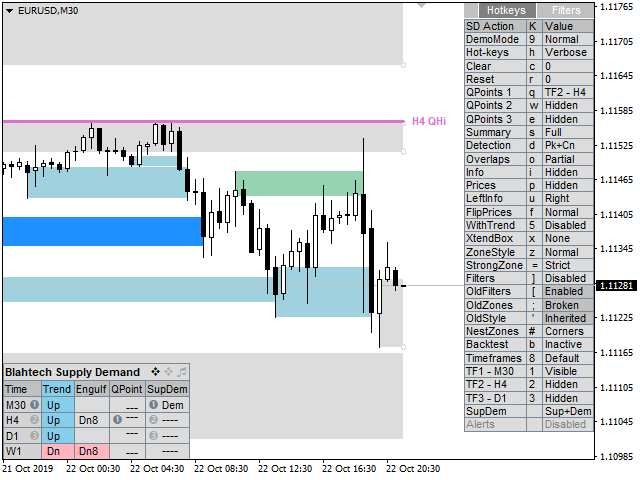
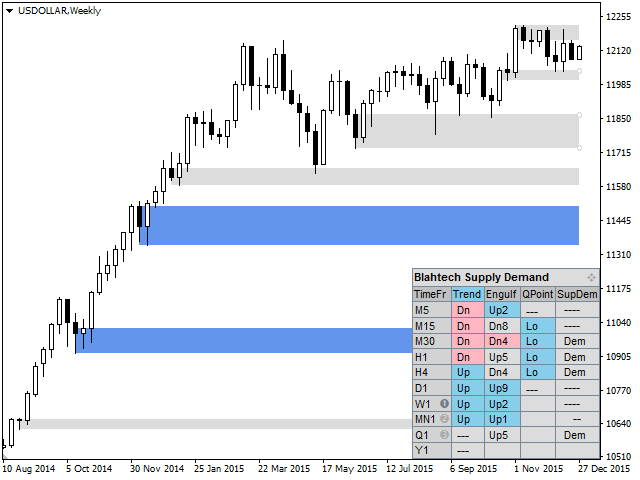
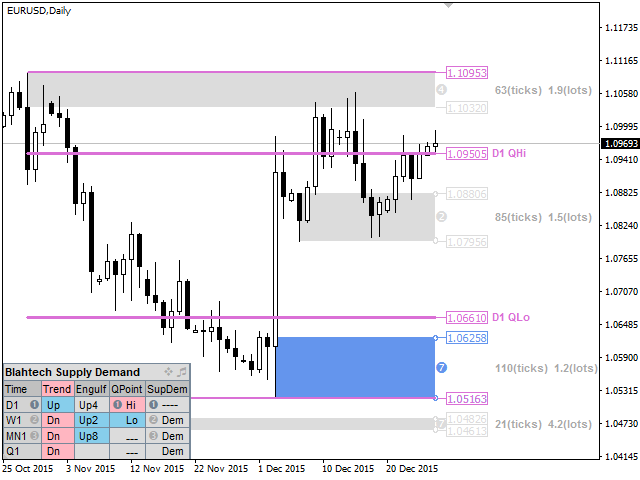
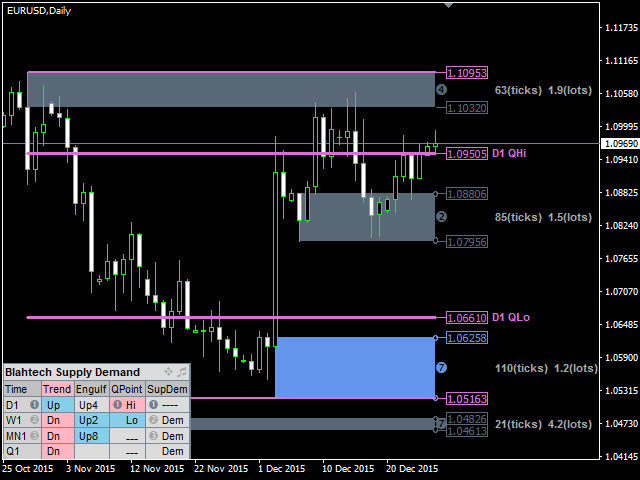
Blahtech Supply Demand indicator delivers functionality previously unavailable on any trading platform. This 4-in-1 indicator not only highlights the higher probability zones using a multi-criteria strength engine, but also combines it with multi-timeframe trend analysis, previously confirmed swings and engulfing detectors. Driven by an easy to use interface and innovative backtest mode this indicator is a must-have for all supply demand traders.

Links [ Install | Update | Documentation & Training ]


Feature Highlights

  • Multi-timeframe display
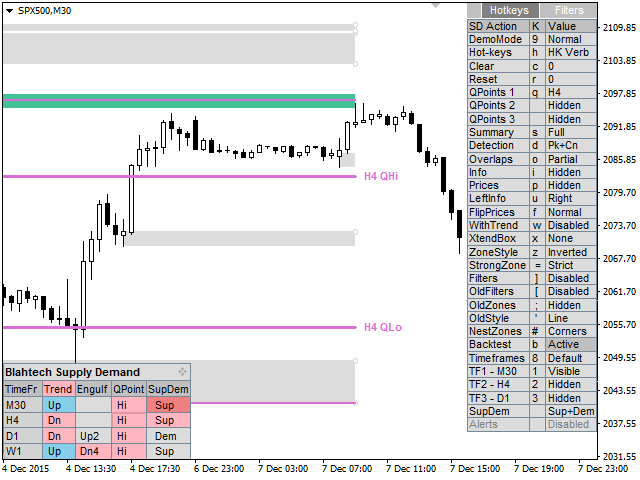
  • Backtest directly on the chart
  • Summary panel
  • Multi-timeframe trend analysis
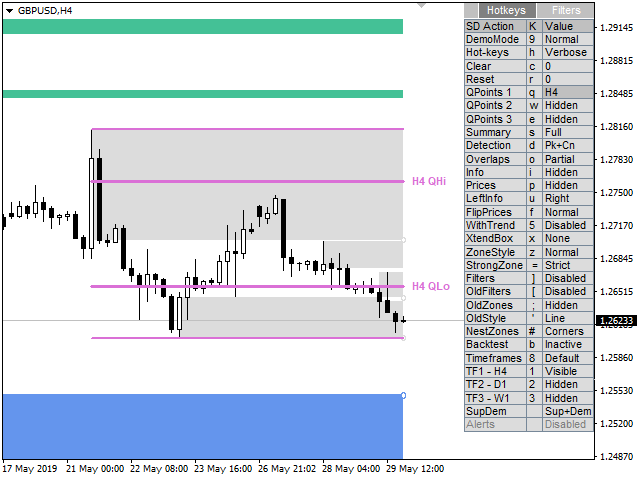
  • Confirmed swings (High and Low QPoints)
  • Zone strength engine (seven criteria)

Feature Highlights continued...

  • Advanced level detection (peaks, consolidations, drop-base-drops)
  • Fast access hot-keys
  • Alerts
  • Engulfing detector
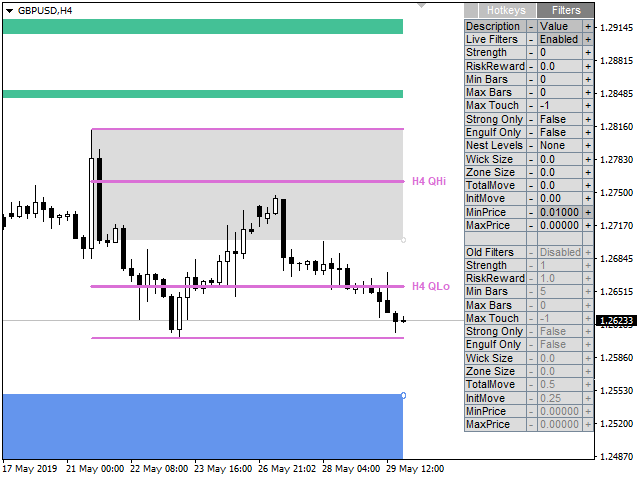
  • Visibility Filters
  • Old zones (broken levels or trend changes)
  • Highlight of Nested zones

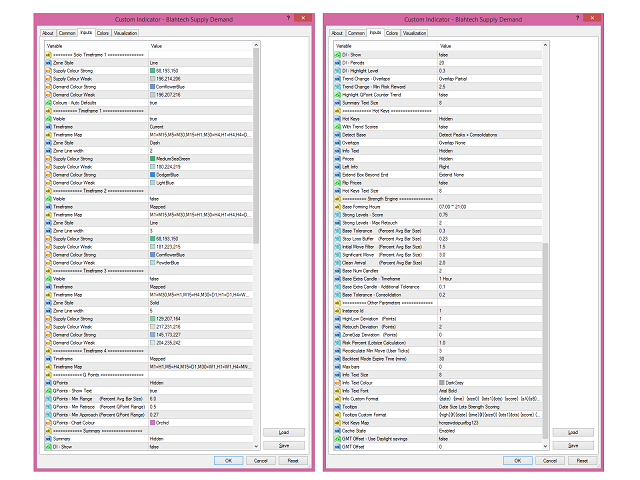
Input Parameters

 - Download documentation using link above for details


评论 15
Nicolas Dobrovsky
609
Nicolas Dobrovsky 2023.08.21 17:26 
 

Great indicator, I used it on MT4. I have been using it on MT5 for a few months now, the advantage of MT5 is more time frames (H2,H3 etc)

Denis Sokolovsky
414
Denis Sokolovsky 2023.06.25 21:39 
 

thank you :)

smhczd
54
smhczd 2022.12.29 21:30 
 

At first I rented the indicator for 1 month to understand how it's working and see if it really gives what it promises, I watched the youtube video several times to get the most of it and after 1 month of trial with various settings, I got convinced that it really helps with your trading, and just to be %100 sure I rented it for another 3 months and I in this period I have been testing the indicator and my knowledge about it on demo and have seen wonders :) so now I can say that it is really perfect for the ones who are looking for supply & demand indicator (which is actually the basics of technical analysis no matter if you're a scalper or day/swing trader) and as my period ends I will definitely buy it . Especially if you're working with several instruments, it just makes wonders that all you need to do is check the supply & demand areas (especially nested ones with higher timeframes) and set alarms on or close to those levels and check how the price is approaching those levels. I tried hundreds of free and paid indicators in 3 years of trading life and I can say that this is literally a good indicator which eases your trading process because as all of us know indicators are not the basics of trading but if you know how to use them properly, they may lessen your workload in great extent and make a real contribution to your trading adventure. It is so obvious that Dee and her team literally knows what trading is and their product is no bullshit but just a real working tool that came up at the end of a scientific research & development (as an engineer I can see it clearly:). To sum up, if you are looking for a supply & demand indicator, just try it at least for 1 month . Try to understand fully how it works, especially the backtest mode is perfect for it and I am pretty sure that you'll get the benefits that you've been looking for. Thank you Blahtech !

推荐产品
Blahtech Market Profile MT5
Blahtech Limited
5 (8)
Was: $249    Now: $149   Market Profile defines a number of day types that can help the trader to determine market behaviour. A key feature is the Value Area, representing the range of price action where 70% of trading took place. Understanding the Value Area can give traders valuable insight into market direction and establish the higher odds trade. It is an excellent addition to any system you may be using. Blahtech Limited presents their Market Profile indicator for the MetaTrader community.
149 USD
BoxChart MT5
Evgeny Shevtsov
5 (6)
The market is unfair if only because 10% of participants manage 90% of funds. An ordinary trader has slim changes to stand against these "vultures". This problem can be solved. You just need to be among these 10%, learn to predict their intentions and move with them. Volume is the only preemptive factor that faultlessly works on any timeframe and symbol. First, the volume appears and is accumulated, and only then the price moves. The price moves from one volume to another. Areas of volume accumu
33 USD
该指标建立当前报价,可以与历史报价进行比较,并在此基础上进行价格走势预测。指示器有一个文本字段,用于快速导航到所需日期。 选项: 符号 - 选择指标将显示的符号; SymbolPeriod - 选择指标从中获取数据的时段; IndicatorColor - 指示器颜色; HorisontalShift - 由指标绘制的报价移动指定的柱数; Inverse - true 反转引号,false - 原始视图; ChartVerticalShiftStep - 图表垂直移动(键盘上的向上/向下箭头); 接下来是文本字段的设置,您可以在其中输入日期,您可以通过按“回车”立即跳转到该日期。 接下来是文本字段的设置,您可以在其中输入日期,您可以通过按“回车”立即跳转到该日期。
55 USD
VolumeProfile MT5
Robert Hess
3.57 (7)
Description: The Volume Profile displays detailed informations of historical trading activities at certain price levels (Market Profile). Locate the areas with the best prices in the market and get an advantage over other market participants. Support: The indicator is constantly being developed and improved. Please do not hesitate to contact me via the MQL5 Platform. I am very grateful about any Bug report, so that i can constantly improve the indicator. I appreciate any public review for this
140 USD
Order Book, known also as Market Book, market depth, Level 2, - is a dynamically updated table with current volumes of orders to buy and to sell specific financial instument at price levels near Bid and Ask. MetaTrader 5 provides the means for receiving market book from your broker, but in real time only, without access to its history. The indicator OrderBook Cumulative Indicator accumulates market book data online and visualizes them on the chart. In addition, the indicator can show the market
49 USD
Volume by Price MT5
Brian Collard
5 (2)
The Volume by Price Indicator for MetaTrader 5 features Volume Profile and Market Profile TPO (Time Price Opportunity). Get valuable insights out of currencies, equities and commodities data. Gain an edge trading financial markets. Volume and TPO histogram bar, line and metric charts. TPO letter and block marker charts including split structures. Positioning and styling options to suit the user's needs and context. Volume Profile and Market Profile TPO Point of Control (VPOC and TPOC), Imbalanc
259 USD
BoxInside MT5
Evgeny Shevtsov
5 (4)
This indicator calculates the volume profile and places labels that correspond to the VAH, VAL and POC levels, for each candle individually. Indicator operation features The indicator works on the timeframes from M3 to MN, but it uses the history data of smaller periods: M1 - for periods from M3 to H1, M5 - for periods from H2 to H12, M30 - for the D1 period, H4 - for the W1 period, D1 - for the MN period. The color and location of the VAL, VAH and POC labels on the current candle are consider
FREE
Moving VVC mt5
Andriy Sydoruk
The   Visual Volatility Clustering   indicator clusters the market based on volatility. The indicator does not redraw and gives accurate data, does not use closing prices. Uses the opening prices or the highs or lows of the previous completed bar. Therefore, all information will be clear and unambiguous. The essence of the indicator is to divide the price market into certain areas according to a similar type of volatility. This can be done in any way. In this example, the indicator is configure
109 USD
本指标可以让您享受两个最流行的产品来分析在感兴趣的价位的请求量和市场成交量: 真实市场深度图表 真实报价足迹成交量图表 本产品结合两个指标的效力,并以单个文件提供。 反危机出售。今日低价。赶紧! 真实的 COMBO 市场深度功能和报价成交量图表,完全等同于原始指标。您将享受这两款产品结合为单一超级指标的力量!下面是您将得到的功能: 真实市场深度图表 股民专用工具现已在 MetaTrader 5 上可用。 真实市场深度图表 指标在图表上以直方条的形式显示可视化的市场深度,并在实时模式下刷新。 利用 真实市场深度图表 指标您可以正确评估市场请求并从图表上看到大的市场。这可以 100% 的精确剥头皮和设置持仓止损。 指标以两种相应颜色的水平直方条形式显示买和卖的请求 (买-卖)。价格图表上给定级别的显示条和它们的长度与请求的交易量相应。此外, 它指示买卖请求的最大交易量。 此指标显示买卖请求总数量作为堆积面积图。这可以评估当经过下一价位时将会执行的请求总量。买卖请求总数量也显示在图表上。 省缺, 指标显示在图表背景上, 且它不会干扰任何其它指标。当使用指标交易时, 建议使用实际交易量。
40 USD
Market Profile 3 ForexArby com
Hussien Abdeltwab Hussien Ryad
4 (8)
Market Profile 3 MetaTrader 5 indicator  version 4.70— is a classic Market Profile implementation that can show the price density over time, outlining the most important price levels, value area, and control value of a given trading session. This indicator can be attached to timeframes between M1 and D1 and will show the Market Profile for daily, weekly, monthly, or even intraday sessions. Lower timeframes offer higher precision. Higher timeframes are recommended for better visibility. It is als
FREE
AW Candle Patterns
Alexander Nechaev
AW 蜡烛形态指标是高级趋势指标与强大的蜡烛形态扫描仪的组合。它是识别和突出显示 30 个最可靠的烛台形态的有用工具。此外,它是一个基于彩色条的电流趋势分析器,带有   可调整大小和定位的插件多时间框架趋势面板。根据趋势过滤调整模式显示的独特能力。 优点: 轻松识别蜡烛形态 不重绘结果 内置多时间趋势面板 禁用模式类型(1、2、3 根蜡烛) 显示形态时趋势过滤的调整 显示模式列表: 锤模式 固定/固定 看跌 Harami / 看涨 Harami 看跌 Harami Cross / 看涨 Harami Cross 枢轴点反转向上/枢轴点反转向下 双柱低位收盘价较高/双柱低位收盘价较低 收盘价反转向上 / 收盘价反转向下 中性条 /     两个中性条 双内/内/外 向上推力杆/向下推力杆 晚星/晨星 晚上十字星 / 早上十字星 吞没看跌线/吞没看涨线 镜子酒吧 流星 乌云盖顶 十字星 输入变量: Main settings Trend Filtering Mode - Adjustment of trend filtering when displaying patterns Pa
145 USD
Ultimate Candle Patterns
Wojciech Daniel Knoff
This is a multi-symbol and multi-timeframe table-based indicator designed for a candlestick patterns detection with 46 patterns for META TRADER 5. Each formation has own image for easier recognition. Here you find most popular formations such as "Engulfing", "Hammer", "Three Line Strike", "Piercing" or Doji - like candles. Check my full list of patterns on my screenshots below. Also you can not only switch all bearish or bullish patterns from input, but also select formation for a specified symb
30 USD
Introducing "X Marks the Spot" – Your Ultimate MetaTrader 5 Indicator for Perfect Trades! Are you tired of the guesswork in trading? Ready to take your MetaTrader 5 experience to a whole new level? Look no further – "X Marks the Spot" is here to revolutionize your trading strategy! What is "X Marks the Spot"? "X Marks the Spot" is not just another indicator – it's your personal trading compass that works seamlessly on all timeframes . Whether you're a beginner or an experienced trader,
65 USD
Trading Utility for Forex Currency Pairs Only not for Gold  Functions Auto Lot Calculation based on Risk Auto stoploss  Auto TakeProfit Breakeven Auto Close Half % Close in percentage with respect to the PIPs Pending Orders BuyLimit Sell Limit with distances BuyStop Sell Stop    with distances Trading Informations Risk in percentage For Multiple trades Combine Takeprofit and Combine Stoplosses
30 USD
Introduction to Chart Pattern MT Chart Pattern MT is a chart pattern scanner to detect the triangle pattern, falling wedge pattern, rising wedge pattern, channel pattern and so on. Chart Pattern MT uses highly sophisticated chart pattern detection algorithm. However, we have designed it in the easy to use with intuitive user interface. Chart Pattern MT will show all the patterns in your chart in the most efficient format for your trading. You do not have to do tedious manual pattern detection an
180 USD
Before installing the HeatMap indicator make sure you are using a broker that gives you access to the Depth of market (DOM) !! This indicator creates a heatmap on your chart allowing you to see the buy or sell limit orders easily and in real time. You have the possibility to change the setting and the colors of the HeatMap in order to adapt to all markets and all charts. Here is an example of a setting you can use with the NASDAQ100 on the AMPGlobal broker :  https://www.youtube.com/watch?v=x0
80 USD
The Market Profile Indicator for MT5 displays the price levels and zones where increased trading activity happens. These zones with substantial forex trading activity provide the forex traders with the best entry levels, support, and resistance levels. Moreover, price levels indicate the best reversal zones. As a result, forex traders can identify BULLISH and BEARISH market trends and BUY and SELL entry points as well as the best reversal points. The indicator works well in all intraday timefram
299 USD
Value Chart Candlesticks
Flavio Javier Jarabeck
4.8 (5)
The idea of a Value Chart indicator was presented in the very good book I read back in 2020 , " Dynamic Trading Indicators: Winning with Value Charts and Price Action Profile ", from the authors Mark Helweg and David Stendahl. The idea is simple and the result is pure genius: Present candlestick Price analysis in a detrended way! HOW TO READ THIS INDICATOR Look for Overbought and Oversold levels. Of course, you will need to test the settings a lot to find the "correct" one for your approach.
FREE
Cumulative Delta MT5
Evgeny Shevtsov
4.51 (51)
The indicator analyzes the volume scale and splits it into two components - seller volumes and buyer volumes, and also calculates the delta and cumulative delta. The indicator does not flicker or redraw, its calculation and plotting are performed fairly quickly, while using the data from the smaller (relative to the current) periods. The indicator operation modes can be switched using the Mode input variable: Buy - display only the buyer volumes. Sell - display only the seller volumes. BuySell -
FREE
Noize Absorption Index
Ekaterina Saltykova
Noize Absorption Index - is the manual trading system that measures the difference of pressure between bears forces and bulls forces. Green line - is a noize free index that showing curent situation. Zero value of index shows totally choppy/flat market.Values above zero level shows how powerfull bullish wave is and values below zero measures bearish forces.Up arrow appears on bearish market when it's ready to reverse, dn arrow appears on weak bullish market, as a result of reverse expectation.
199 USD
该指标自动计算并绘制斐波那契支撑位和阻力位 - 最有效的市场分析工具之一。 计算使用所选期间和时间范围的平均价格数据。此期间的最小值和最大值被视为运动的开始和结束。 斐波那契水平让您可以看到潜在的参考点,围绕这些点价格走势可以放缓或逆转,也就是说,它们用于预测进一步的走势,以及设置止损和限价单。 参数: PartsShow - 从当前柱状图显示的历史级别数 CalcPeriod - 价格平均周期 SmoothingMethod - 价格平均法(26 个选项) TF - 用于计算的时间范围 LevelColor - 水平线的颜色 ZeroLevelColor - 零级颜色 ShowVerticalLine - 启用/禁用水平之间的垂直线的显示 VLineStyle - 垂直线的样式 VLineColor - 垂直线的颜色 ShowInfo - 启用以标签形式显示有关级别百分比值的信息,否则以对象描述的形式显示 InfoFontSize - 信息字体大小 InfoColor - 信息字符串的颜色 FiboLevels - 显示水平的百分比值
30 USD
Green Power
Ignacio Agustin Mene Franco
Black Card Pack indicator 5/3 Green power It has the high and low breakout strategy giving the signal with the red or green dot the red dot for short and the green dot for long , perfect for forex markets and synthetic index markets, works for all seasons It is used for scalping and intraday! Ideal for Crash and boom markets!! Volatilitys y jumps !! Micro y macro en forex !
50 USD
FDP Strong Point new
Yauheni Dashevich
This indicator shows a candle combination based on dodge, dodge and pin bar. The logic of the pattern is to stand on the side of strength, after uncertainty. The indicator is universal and is useful for trading binary options, forex, ETFs, cryptocurrency, stocks. The indicator supports timeframes from M5 to MN, including non-standard TF presented in MT5. (М5,М6,М10,M12, M15, M20, M30, H1, H2, H3, H4, H6, H8, H12, D1, W1, MN). The ability to enable and disable TF is implemented. Sound alerts and
450 USD
The   Visual Volatility Clustering   indicator clusters the market based on volatility. The indicator does not redraw and gives accurate data, does not use closing prices. Uses the opening prices or the highs or lows of the previous completed bar. Therefore, all information will be clear and unambiguous. The essence of the indicator is to divide the price market into certain areas according to a similar type of volatility. This can be done in any way. In this example, the indicator is configure
109 USD
Wapv Price and volume
Eduardo Da Costa Custodio Santos
40 USD
PZ Trend Trading MT5
PZ TRADING SLU
3.67 (3)
许多盈利交易者不仅知道如何识别市场趋势,而且也能把握趋势建立后的交易机会。 Pz 趋势交易 指标设计用来在趋势行情中尽可能的赚取利润。 已建立的趋势提供了一揽子交易机会,但大多数趋势交易指标完全忽视了它们,让交易者在趋势行情时完全不知道该如何做!一般趋势指标只通知有关的趋势变化,但根本不足以得到卓越的回报. Pz 趋势交易 指标比一般趋势指标显示多达 20 倍的交易 , 因为它注重所谓的市场时机。它不仅显示当前的市场趋势,也有回调,内柱线的突破和调整。它令您在趋势回调之后介入,安全的柱线内突破金字塔加仓,以及发现潜在的反转,和已知的调整。 趋势改变 一个趋势改变在市场方向变化时发生。趋势变化在图表上用带数字的彩色圆圈显示。蓝色 (1) 信号为上涨开始, 而红色 (1) 信号为下跌开始。趋势变化并非评估当前价格动作的结果, 它意味着交易设置是不定时地。如果您正确使用本指标, 在趋势变化时, 您将将已经入场 (参看下面的调整)。 回调 但凡趋势在运动中,行情上下抖动,盈利者收割利润,且其它参与者入场。趋势回调代表好的买入机会,通常是由主力获利离场导致。如果行情在回调后回归上行, 指
249 USD
A "Volume Profile" is an advanced charting indicator that displays total volume traded at every price level over a user specified time period. The main components of the volume profile are POC ( Point Of Control - the price level, at which the maximum number of contracts were executed during a selected period), VAH ( Value Area High - the highest price in the Value Area) and VAL ( Value Area Low - the lowest price in the Value Area). When we settled on the original indicator, we spent a lot o
150 USD
POC level MT5
Mikhail Nazarenko
The indicator automatically calculates       and displays the level of the maximum       real   volume Point Of Control (POC) of the Market Profile for the   array of candles   highlighted by a rectangular area. This will significantly increase the accuracy of your position entries when trading POC bounces and reversals. Attention when testing the demo version!   In the MT5 strategy tester , there is no possibility of dragging a rectangle and this is a problem of limitations of the MT5 strategy
55 USD
ClusterSecond
Rafil Nurmukhametov
4.77 (30)
该工具允许绘制不同类型的图表。 秒图从1秒到86400秒 从1滴答开始的滴答图 成交量图 三角洲图 仁科图 范围图 用于体积分析的内置指标。 该工具的演示版 https://www.mql5.com/ru/channels/clustersecond 每日市场概况和所选时间框架的市场概况。 集群搜索。 不平衡。 VWAP。 动态POC、VAH、VAL 价格窗口简介 具有不同表现形式的垂直体积。 δ,有不同的可视化选项。 当前的和高的时间框架极 地下室指标烛台显示 也可以从图表中进行交易。 注意:该工具是为具有真实(交换)量的市场设计的。 它不适合外汇市场。它在VPS上不起作用。它在策略测试器中不起作用。 为了控制该图表,我们使用了 鼠标左键 - 移动图表,在设置中选择不同的模式,调用位于屏幕左下角带螺丝刀的钥匙图标下的主设置窗口。 鼠标右键 - 用于输入位于屏幕左上角图标下的图形结构的设置,以及绘制垂直、水平、趋势线和矩形的单独设置。 在图表区域旋转鼠标滚轮--左右移动图表,按住Ctrl键--上下移动图表,在价格比例区域--按价格比例,在时间轴区域--按时间比例。 H
100 USD
该产品的买家也购买
IVISTscalp5
Vadym Zhukovskyi
5 (1)
我们向您介绍iVISTscalp5指标,它不仅独特,而且在交易操作中也非常有效。该指标基于时间数据,是多年金融市场经验和深入分析的结果。iVISTscalp5指标是手动交易的优秀工具。便利性、简单性和可视化 - 所有的复杂性都隐藏在内部。我们将iVISTscalp5指标的设置和使用简化到了最大程度。该指标适用于MT5终端中您所拥有的所有金融工具。 操作时间为UTC+3的早上4点到晚上8点。 iVISTscalp5指标菜单(见截图1): History - 计算行情的周数 dT_min - 选择时间间隔的时间(分钟) TFline - 绘制水平成交量(时间帧) BARSline - 绘制水平成交量(条数) TFtrend1 - 绘制日线通道(时间帧) BARStrend1 - 绘制日线通道(条数) TFtrend2 - 绘制周线通道(时间帧) BARStrend2 - 绘制周线通道(条数) ALERT_TIMER - 设置闹钟 ALERT - 开启/关闭闹钟 Save - 开启/关闭将时间记录到文本文件。 图表上的红色和蓝色旗帜表示时间(VIST智能剃须系统的信号)。卖出信号为红旗,买入
500 USD
Advanced Supply Demand MT5
Bernhard Schweigert
4.36 (11)
任何新手或专业交易者的最佳解决方案! 该指标是一款独特、高质量、且价格合理的交易工具,因为我们已经整合了许多专有功能和新公式。 依据此更新,您将能够显示双重时间帧区域。 您不仅可以显示一个较高的时间帧,还可以同时显示图表时间帧,加上更高的时间帧:显示嵌套时区。 供需双方所有交易者都会喜欢它。 :) 重要信息披露 高级供需的最大潜力,请访问 https://www.mql5.com/zh/blogs/post/720245   想象您的交易如何得以改善,是因为您能够精准定位入场或目标位吗? 构建于新的底层算法,它可以更轻松地识别出买卖双方之间的潜在失衡。 这是因为它以图形方式展示供需最强劲区域,及其过去的表现(显示旧区域)。 这些功能旨在帮助您更轻松地发现最佳入场区域和价位。 现在您可以针对您的交易品种和时间帧来优化和编辑区域强度! 高级供需指标适用于所有产品和时间帧。 它是一个新的公式,非常新的功能是两个区域强度函数可由用户输入进行调整! 这在交易中是一大优势。 当您学习如何使用专有功能,例如带有价格游离最小 X 因子的区域强度时,您能够判断该区域强劲与否。 供需区域用作警报触发器
199 USD
PZ Harmonacci Patterns MT5
PZ TRADING SLU
3.25 (4)
可以说,这是您可以为MetaTrader平台找到的最完整的谐波价格形成自动识别指标。它检测19种不同的模式,像您一样认真对待斐波那契投影,显示潜在的反转区域(PRZ),并找到合适的止损和获利水平。 [ 安装指南 | 更新指南 | 故障排除 | 常见问题 | 所有产品 ] 它检测19种不同的谐波价格形态 它绘制了主要,衍生和互补的斐波那契投影(PRZ) 它评估过去的价格走势并显示每个过去的形态 该指标分析其自身的质量和性能 它显示合适的止损和获利水平 它使用突破来表明合适的交易 它在图表上绘制所有样式比率 它实现了电子邮件/声音/视觉警报 受斯科特·M·卡尼(Scott M. Carney)的书的启发,该指标旨在满足最纯粹和最熟练的交易者的需求。但是,它采取了一种使交易更容易的方式:在向交易发出信号之前,它会等待Donchian朝正确方向突破,从而使交易信号非常可靠。 斐波那契投影与向量无关 它实现了电子邮件/声音/推送警报 它绘制了ABCD投影 重要提示: 为了符合 Scott M. Carney先生 的商标申诉,某些图案名称已重命名为不言自明的替代方式, Scot
299 USD
XQ Indicator MT5
Marzena Maria Szmit
3.25 (4)
The signal conditions are a combination of three indicators, and XQ Forex Indicators only display  medium and long-term trends . The indicator's efficacy has been improved with the addition of a filter that blocks out false signals. The XQ Forex Indicator can be used on  FX pairs, CFDs, and Cryptocurrencies . There are two type of signals:  Buy or Sell and Big Long or Big Short It is possible to enable sending emails when a major trend-change signal is detected, as well as to display the alerts
179 USD
TPA True Price Action indicator reveals the true price action of the market makers through 100% non-repainting signals strictly at the close of a candle! TPA shows entries and re-entries, every time the bulls are definitely stronger than the bears and vice versa. Not to confuse with red/green candles. The shift of power gets confirmed at the earliest stage and is ONE exit strategy of several. There are available now two free parts of the TPA User Guide for our customers. The first "The Basics"
168 USD
RubdFx Perfect Reversal , The reversal indicator is used to determine areas of support and resistance by Drawing an arrow with a level of supply and demand ( ReversalZones ). - You will catch more swings by reducing the period, and less swings if you increase period - Mobile, computer and email alerts available . it is not pushed by price which means the arrow will stay in one place,suitable for scalping and long term trading  Also Compatible with all forex paris , BUY RULES;  open a buy positio
159 USD
Introduction to Fractal Pattern Scanner Fractal Indicator refers to the technical indicator that makes use of the fractal geometry found in the financial market. Fractal Pattern Scanner is the advanced Fractal Indicator that brings the latest trading technology after the extensive research and development work in the fractal geometry in the financial market. The most important feature in Fractal Pattern Scanner is the ability to measure the turning point probability as well as the trend probabil
185 USD
本指标是实践实战交易完善的波浪自动分析的指标   ! 黄金实战 案例... 注:波浪分级用西方叫法不习惯,因 受到缠论(缠中说禅)命名方式习惯的影响,我是将基础波浪命名为 笔 , 将二级波段命名为 段 , 同时具有趋势方向的段命名为 主趋段 (以后笔记中都是这种命名方式,先告知大家),但是算法上和缠论关系不大切勿混淆.反映的是本人分析盘面总结的 千变万化纷繁复杂的运行规律 . 对波段进行了标准化定义,不再是不同人不同的浪 , 对人为干扰的画法进行了排除 , 在严格分析进场起到了关键的作用 . 指标内容 1.   基础波浪(笔): 首先我们找出了价格波动过程中的基础波动拐点,当然他的有序性还不算太强,为下一步的计算提供基础 . 2.   二级波段(段) :在基础波浪的基础上,通过算法分析得到层级更明显的二级波段,二级波段为波浪提供了分析基础 3.   波浪(浪): 有着更清晰的趋势,更清晰直观的方向.分析一个波浪是否延续,需要看二级波段的形态,分析二级的构成,可以得出波浪后续的预测. 4.   通道: 通道计算采用了线性回归的方式进行计算. 5.   回撤: 波浪中的两个重要回撤会在
188 USD
PZ Divergence Trading MT5
PZ TRADING SLU
3.67 (3)
棘手的发现和频率稀缺是最可靠的交易方案之一。该指标使用您喜欢的振荡器自动查找并扫描常规和隐藏的发散。 [ 安装指南 | 更新指南 | 故障排除 | 常见问题 | 所有产品 ] 容易交易 发现常规和隐藏的分歧 支持许多知名的振荡器 根据突破实现交易信号 显示适当的止损和获利水平 可配置的振荡器参数 可自定义的颜色和尺寸 按条形过滤大小差异 实现绩效统计 它实现了电子邮件/声音/视觉警报 为了提供广阔的市场前景,可以使用不同的振荡器在同一张图表中多次加载该指标,而不会产生干扰。该指标支持以下振荡器: RSI CCI MACD OSMA 随机 动量 很棒的振荡器 加速器振荡器 威廉姆斯百分比范围 相对活力指数 由于差异可能会扩大很多,尤其是在外汇市场中,因此该指标产生了转折:它在等待交易突破之前等待donchian突破确认差异。最终结果是带有非常可靠的交易信号的重新粉刷指示器。 输入参数 幅度:用于寻找差异的之字形周期 振荡器-选择要加载到图表的振荡器。 突破期-交易信号的突破期,以柱为单位。 发散类型-启用或禁用发散类型:隐藏,常规或两者。 最小散度单位为条形-最
249 USD
Introduction to X3 Chart Pattern Scanner X3 Cherart Pattern Scanner is the non-repainting and non-lagging indicator detecting X3 chart patterns including Harmonic pattern, Elliott Wave pattern, X3 patterns, and Japanese Candlestick patterns. Historical patterns match with signal patterns. Hence, you can readily develop the solid trading strategy in your chart. More importantly, this superb pattern scanner can detect the optimal pattern of its kind. In addition, you can switch on and off individu
250 USD
Golden Spikes Detector
Batsirayi L Marango
5 (1)
Golden Spikes Detector This indicator is based on an advanced strategy primarily for trading spikes on Boom and Crash Indices. Complex algorithms were implanted to detect high probability entries only. It alerts on potential Buy and Sell entries. To trade spikes on the Deriv or Binary broker, only take Buy Boom and Sell Cash alerts. It was optimised for 5-minute timeframe. Features ·          Sends push notifications to mobile phone ·          Pop up and sound alerts on computer or laptop ·     
150 USD
Bill Williams Advanced
Siarhei Vashchylka
5 (1)
Bill Williams Advanced is designed to analyze the chart according to Bill Williams' Profitunity system. The indicator analyzes the signals of the AO, AC indicators and places them in the panel in the upper left corner of the chart. In addition, using hot keys, the indicator instantly displays / hides the AO and AC indicators (for more details, see the video instructions). Description Each line of the indicator table represents the signals of the Profitunity system that are valid on the last fi
199 USD
VTrende Pro
Andrii Diachenko
VTrende Pro - MTF indicator for trend trading with a display panel for MT5 *** Videos can be translated into any language using subtitles (video language - Russian) Although the signals of the VTrende Pro indicator can be used as signals of a full-fledged trading system, it is recommended to use them in conjunction with the Bill Williams TS. VTrende Pro is an extended version of the VTrende indicator. Difference between Pro version and VTrende: - Time zones - Signal V - signal 1-2 waves
697 USD
Traffic Signal
Ramzi Abuwarda
推出瞩目的MT5指标——交通信号,它基于分析RSI(相对强弱指标)、Stochastics(随机指标)、CCI(商品通道指标)和趋势等多个时间框架上的水平,以获取最准确的入场信号的特殊策略。交通信号是您成功交易的终极通道!该创新指标精确且专业,通过集成先进的技术指标,并覆盖所有时间框架,助您准确把握市场动向,为您提供无与伦比的自信心。 通过交通信号,您可以全面分析关键指标,经过精密校准,以探测最具利润潜力的交易机会。告别不确定性,迎接明智决策的新时代。交通信号将RSI、Stochastics、CCI和趋势等指标融合得天衣无缝,为您描绘市场动态提供鲜活画面,前所未有。 畅享轻松的市场趋势和模式,交通信号为您持续监测各个时间框架。无论您偏好短期激动还是长期战略,这一杰出指标均可满足您的交易风格,为您提供对市场起伏的整体认知。 交通信号的准确性是其成功的基石。通过广泛的研究与开发,该指标提供精确调校和时机准确的信号。告别虚假信号,迎接前所未有的可靠性水平。就像有一位可信赖的盟友与您并肩作战,以毫不动摇的准确性引导您走向丰盈机会。 通过直观的界面和易于理解的信号,您将体验到自信交易的乐趣。无论
450 USD
Weis Wave with Alert MT5
Trade The Volume Waves Single Member P.C.
4.93 (14)
Get 30% Discount until 30/9/20203 on Lifetime package 420$ from 599$. Rental/Lifetime Package Options and Privileges  * For optimum results the yearly or lifetime package is suggested due to live training and Discord  channel trading with the  creator! Rent Monthly Six Months   Yearly/Lifetime Weis Wave with Speed with Alert+Speed Index x x x Manual  x x x Quick Set up Video x x x Blog x x x Lifetime Updates x x x Setup and Training Material x x Free Rectangle Break Alert Tool      x Discord
420 USD
Introduction Excessive Momentum Indicator is the momentum indicator to measure the excessive momentum directly from raw price series. Hence, this is an extended price action and pattern trading. Excessive Momentum Indicator was originally developed by Young Ho Seo. This indicator demonstrates the concept of Equilibrium Fractal Wave and Practical Application at the same time. Excessive Momentum detects the market anomaly. Excessive momentum will give us a lot of clue about potential reversal and
200 USD
Elliott Wave Trend MT5
Young Ho Seo
4 (3)
Elliott Wave Trend was designed for the scientific wave counting. This tool focuses to get rid of the vagueness of the classic Elliott Wave Counting using the guideline from the template and pattern approach. In doing so, firstly Elliott Wave Trend offers the template for your wave counting. Secondly, it offers Wave Structural Score to assist to identify accurate wave formation. It offers both impulse wave Structural Score and corrective wave Structure Score. Structural Score is the rating to sh
200 USD
这个PowerSignal是基于ATR技术指标的完整交易系统。该指标将分析并记录每个POWERTREND从M5-MN中每个周期和货币对趋势强度。 PowerSignal通过评估这些数据来创建一个趋势强度和入口点信号列表显示。如果趋势强度百分比达到100,则一个警告会弹出来指示这种情况。当趋势百分比达大于等于75%时认为是强货币,另外LastEntry字段提示选择一个周期入场、显示了多个入场周期,入场价格,时间.通常根据实际情况选择一个中高周期入场比较好。 输入参数 Periods = 14-indicators Periods. Text Color = While - 常态文本颜色。 Buy Signal color = LawnGreen - 多头信号颜色。 Sell signal color = OrangeRed - 空头信号颜色。 Alert_ON = false-禁止报警.true-激活报警:支持报警提示、邮件、手机推送. Alert_Min_Interval = 15 Entry_Percent = PERCENT_100 - PERCENT_100表示产生多空信号
150 USD
"Piranha" - an autonomous trading system that determines overbought and oversold levels on the chart. Red and blue zones represent overbought and oversold levels respectively. Entry points are marked with arrows: a downward arrow in the red zone for "sell" and an upward arrow in the blue zone for "buy". The Take profit level is indicated by the green moving average. Key features: Adjusting the Take profit level as the green moving average changes position. Averaging ability when a new market e
300 USD
PZ Swing Trading MT5
PZ TRADING SLU
5 (4)
Swing Trading 是第一个旨在检测趋势方向的波动和可能的反转波动的指标。它使用在交易文献中广泛描述的基准摆动交易方法。该指标研究多个价格和时间向量,以追踪总体趋势方向,并检测市场超卖或超买并准备好进行修正的情况。 [ 安装指南 | 更新指南 | 故障排除 | 常见问题 | 所有产品 ] 市场波动的利润不会被窃取 指示器始终显示趋势方向 彩色价格带代表机会基准 彩色虚线表示可能的反转波动 该指标分析其自身的质量和性能 它实现了一个多时间仪表板 可定制的趋势和波动周期 它实现了电子邮件/声音/推送警报 指示器为非重涂或重涂 什么是摇摆交易 摇摆交易是一种尝试在一天到一周内从证券中获得收益的交易方式,尽管某些交易最终可以保持更长的寿命。摇摆交易者使用技术分析来买入弱点和卖出力量,并有耐心等待这些机会的发生,因为在发生一波抛售浪潮之后购买证券而不是陷入抛售更有意义。 机会基准 关于历史数据的大量研究证明,适合于波动交易的市场倾向于在基线价格带上下交易,基线价格带由图表显示,使用平均真实区间计算得出。波动交易者使用基线,该策略是购买常态和卖出躁狂,或做空常态并掩盖沮丧。
249 USD
Description Very precise patterns to detect: entry signals as well as breakout, support and resistance reversal patterns. It points out zones in which, with a high probability, institutional orders with the potential to change the price’s direction and keep moving towards it, have been placed. Support:   We create great tools for the entire trading community. Most of them are free. If you believe in what we do  Support Us Here.   KEY LINKS:   Indicator Manual  -  All Products  How is this ind
280 USD
LT Regression Chanel MT5
Sie Samuel Roland Youl
LT 回归通道是一种高度复杂的技术指标,结合了各种分析方法的原理,提供全面准确的市场评估。 其中关键组成部分——信封指标,使得交易员能够评估市场波动性,为潜在价格波动提供宝贵的见解。此外,斐波那契分析的应用增强了对超买和超卖水平的准确识别,帮助交易员做出明智的交易决策。 此外,傅里叶外推在该指标中的加入在预测未来市场走势中起着至关重要的作用。通过同时考虑信封指标和斐波那契分析的数据,LT 回归通道能够提供全面的市场趋势和潜在价格行动。 该指标的一个重要优势在于其多功能性。交易员可以选择将其作为独立工具使用,也可以与其他指标结合,进行更全面的市场分析。它还兼容多种时间框架和图表类型,适用于具有不同交易风格和偏好的交易员。 然而,需要注意的是,该指标可能会出现一些重绘,这意味着过去的数据点可能会随着新数据的添加而改变。为了减轻这种情况,建议使用较长的时间周期,最好在500以上。这样做可以显著提高指标的稳定性,从而实现更可靠和准确的预测。 总体而言,LT 回归通道是一个强大的工具,可以极大地增强交易员的市场分析和决策过程。凭借其整合不同分析原理的能力和适应各种交易场景的
200 USD
PZ Day Trading MT5
PZ TRADING SLU
2.6 (5)
该指标仅使用价格行为分析和donchian渠道以锯齿形检测价格反转。它是专门为短期交易而设计的,根本不需要重新粉刷或补漆。对于精明的交易者来说,这是一个绝佳的工具,旨在增加他们的运作时间。 [ 安装指南 | 更新指南 | 故障排除 | 常见问题 | 所有产品 ] 极易交易 它在每个时间段都提供价值 实施自我分析统计 它实现了电子邮件/声音/视觉警报 基于可变长度的突破和拥挤区域,该指标仅使用价格行为来选择交易并对市场快速做出反应。 显示过去信号的潜在利润 该指标分析其自身的质量和性能 突围的损失突出显示并解决 该指标是不可重涂和不可重涂的 该指标将帮助盘中交易者不要错过单个价格反转。但是,并非所有价格反转都是一样的,也不是具有相同的可行质量。决定要突破哪些突破而忽略哪些取决于交易者的良好判断。 如何解释统计数据 该指标研究其自身信号的质量,并在图表上绘制相关信息。将分析每笔交易,并在图表的左上角显示总体历史结果,这使您可以针对任何给定的工具和时间范围自行优化指标参数。每个乐器和时间表都有其自己的最佳设置,您可以自己找到它们。 最大优惠交易:对于任何给定的交易,MFE都是
249 USD
The indicator is recommended to be used on D1. This version, unlike the version for MT4, does not have an additional filter. Peculiarities Suitable for all tools Many strategies; Important levels, recommendations; Flexibility in settings for different instruments and intervals. Signals B,S - predict the direction of movement of the candle at the beginning or at the close of the candle. Recommended TF from H4 and above. BuyStopLvl, SellStopLvl - levels that can be used to set Limit, Stop order
200 USD
Matreshka
Dimitr Trifonov
5 (1)
Matreshka self-testing and self-optimizing indicator: 1. Is an interpretation of the Elliott Wave Analysis Theory. 2. Based on the principle of the indicator type ZigZag, and the waves are based on the principle of interpretation of the theory of DeMark. 3. Filters waves in length and height. 4. Draws up to six levels of ZigZag at the same time, tracking waves of different orders. 5. Marks Pulsed and Recoil Waves. 6. Draws arrows to open positions 7. Draws three channels. 8. Notes support and re
245 USD
INTRODUCING WORLD'S FIRST MT5 "AUTO SCALE" Naveen Geometric Square with Circle To Analyze Markets Geometric Relationship. Naveen's Geometric Square  has some of the most impressive features you will ever find in Gann & Geometric Analysis world. The Naveen's Geometric Square  is a Powerful method of squaring TIME AND PRICE .It is a free-hand drawing tool giving you control of the size of the box. The internal diagonals, grid-lines and angles can be Enabled/ Disabled. All square diagonals lik
1 299 USD
"Sentiments of traders" in the financial markets is a topic that has been of interest to us for a long time. In time, we could not find the right formula to define these sentiments. We went through many stages in the search for the right methodology - from taking data from external sources to calculate open positions of buyers and sellers to calculating tick volumes, but still we were not satisfied with the results. The calculation of open positions of buyers and sellers from external sources ha
150 USD
MR Range Breakouts 5
Sergey Khramchenkov
5 (2)
" A trading range occurs when a financial instrument trades between constant high and low prices over a period of time. The upper part of the trading range of a financial instrument often provides price resistance, while the lower part of the trading range usually offers price support.  Traders can enter in the direction of a breakout or breakdown from a trading range... " This is the "Classical Theory" understanding of ranges. We have a different understanding of the nature of ranges and th
150 USD
MR Reversal Patterns 5
Sergey Khramchenkov
5 (1)
In the "Masters of Risk" trading system, one of the main concepts is related to places where markets change direction. In fact, this is a change in priority and a violation of the trend structure at the extremes of the market, where supposedly there are or would be stop-losses of "smart" participants who are outside the boundaries of the accumulation of volume. For this reason, we call them "Reversal Patterns" - places with a lot of weight for the start of a new and strong trend. Some of the im
150 USD
MR Trend Corrections 5
Sergey Khramchenkov
We publish the indicator as a useful tool in trading and call this indicator the "Swiss Army Knife" because it provides many possibilities and combinations to help understand the material on the "Masters of Risk" trading system. The indicator itself is not part of the tools used in the "Masters of Risk" trading system. The indicator consists of 3 separate multi-timeframe indicators, which in combination with each other help to reduce the "noise" of false signals. The first of the indicators ar
150 USD
作者的更多信息
Blahtech Supply Demand
Blahtech Limited
4.61 (33)
Was: $299    Now: $149   Supply Demand uses previous price action to identify potential imbalances between buyers and sellers. The key is to identify the better odds zones, not just the untouched ones. Blahtech Supply Demand indicator delivers functionality previously unavailable on any trading platform. This 4-in-1 indicator not only highlights the higher probability zones using a multi-criteria strength engine, but also combines it with multi-timeframe trend analysis, previously confirmed swin
149 USD
Blahtech Candle Timer
Blahtech Limited
4.82 (89)
Over 100,000 users on MT4 and MT5 Blahtech Candle Timer displays the remaining time before the current bar closes and a new bar forms. It can be used for time management Links [  Install  |  Update  |  Training  ] Feature Highlights The only candle timer on MT4 with no stutter and no lag S electable Location Tracks server time not local time Multiple colour Schemes Configurable Text Customisable alerts and messages Optimised to reduce CPU usage Input Parameters Text Location   - Beside / Upper
FREE
Blahtech Candle Timer MT5
Blahtech Limited
4.76 (102)
Over 100,000 users on MT4 and MT5 Blahtech Candle Timer displays the remaining time before the current bar closes and a new bar forms. It can be used for time management Links [  Install  |  Update  |  Training  ] Feature Highlights The only candle timer on MT5 with no stutter and no lag S electable Location Tracks server time not local time Multiple colour Schemes Configurable Text Customisable alerts and messages Optimised to reduce CPU usage Input Parameters Text Location - Beside / Upper L
FREE
Blahtech Market Profile MT5
Blahtech Limited
5 (8)
Was: $249    Now: $149   Market Profile defines a number of day types that can help the trader to determine market behaviour. A key feature is the Value Area, representing the range of price action where 70% of trading took place. Understanding the Value Area can give traders valuable insight into market direction and establish the higher odds trade. It is an excellent addition to any system you may be using. Blahtech Limited presents their Market Profile indicator for the MetaTrader community.
149 USD
Blahtech Daily Range
Blahtech Limited
4.8 (5)
Was: $99  Now: $49   Blahtech Daily Range indicator displays the average daily range alongside the individual session ranges. Using the daily open price as a reference the indicator shows fixed range and dynamic range targets as lines on the charts. These lines clearly show when the average range has been exhausted. Daily and session ranges can be useful for confirming entries or setting targets and is an excellent odds enhancer for many trading systems. Links [  Documentation   |   Install  |
49 USD
Blahtech VWAP MT5
Blahtech Limited
5 (1)
Was: $69    Now: $48   Blahtech VWAP - Volume Weighted Average Price (VWAP) is the ratio of price to total volume. It provides an average price over a specified time interval.  Links [  Install  |  Update  |  Documentation   ] Feature Highlights Configurable VWAP Line Sessions, intervals, anchored or continuous Previous day settlement line Standard Deviation bands Alerts at bar close or real time Automatic Broker or Tick volumes Significantly reduced CPU usage Input Parameters Expert Advis
49 USD
Blahtech Market Profile
Blahtech Limited
4.59 (17)
Was: $249    Now: $149   Market Profile defines a number of day types that can help the trader to determine market behaviour. A key feature is the Value Area, representing the range of price action where 70% of trading took place. Understanding the Value Area can give traders valuable insight into market direction and establish the higher odds trade. It is an excellent addition to any system you may be using. Blahtech Limited presents their Market Profile indicator for the MetaTrader community.
149 USD
Was: $49    Now: $49   Blahtech Better Volume provides an enhanced version of the vertical volume bars. Each bar is compared to the previous 20 bars. Depending on its volume, range and volume density it will be assigned a state and colour. Low Volume – Minimum volume High Churn   – Significant volume with limited movement Climax Neutral –   High volume with unclear direction Climax Up   – High volume with bullish direction Climax Dn   – High volume with bearish direction Climax Churn – High vo
49 USD
Blahtech VWAP
Blahtech Limited
5 (2)
Was: $69    Now: $48   Blahtech VWAP - Volume Weighted Average Price (VWAP) is the ratio of price to total volume. It provides an average price over a specified time interval.  Links [  Install  |  Update  |  Documentation   ] Feature Highlights Configurable VWAP Line Sessions, intervals, anchored or continuous Previous day settlement line Standard Deviation bands Alerts at bar close or real time Automatic Broker or Tick volumes Significantly reduced CPU usage Input Parameters Expert Advis
49 USD
Blahtech Moving Average MT5
Blahtech Limited
5 (2)
Blahtech Moving Average indicator is a multitimeframe version of the standard Moving Average indicator. It is also enhanced with customisable alerts, period breaks and other configuration options. The 50 day and 200 day moving averages are widely followed by investors and traders, with breaks above and below the MA lines considered to be signals of interest. Links [  Install  |  Update  |   Training   |   All Products  ] Feature Highlights Up to three timeframes Configurable calculation variab
FREE
Blahtech Daily Range MT5
Blahtech Limited
5 (1)
Was: $99  Now: $49   Blahtech Daily Range indicator displays the average daily range alongside the individual session ranges. Using the daily open price as a reference the indicator shows fixed range and dynamic range targets as lines on the charts. These lines clearly show when the average range has been exhausted. Daily and session ranges can be useful for confirming entries or setting targets and is an excellent odds enhancer for many trading systems. Links [  Documentation   |   Install  | 
49 USD
Blahtech Fisher Transform indicator is an oscillator that displays overbought and oversold locations on the chart. The Fisher Transform algorithm transforms prices with any distribution shape into a normal distribution. The end result is a curve with sharp turning points that may help to identify bullish or bearish trends. Fisher Transform values exceeding 1.66 on the daily chart are considered to be good areas for reversal trades. Links [  Install  |  Update  |  Training   |  All Products  ]
33 USD
Blahtech Fisher Transform
Blahtech Limited
5 (1)
Blahtech Fisher Transform indicator is an oscillator that displays overbought and oversold locations on the chart. The Fisher Transform algorithm transforms prices with any distribution shape into a normal distribution. The end result is a curve with sharp turning points that may help to identify bullish or bearish trends. Fisher Transform values exceeding 1.66 on the daily chart are considered to be good areas for reversal trades. Links [  Install  |  Update  |  Training   |  All Products  ]
33 USD
Blahtech Better Volume
Blahtech Limited
5 (1)
Was: $49    Now: $49   Blahtech Better Volume provides an enhanced version of the vertical volume bars. Each bar is compared to the previous 20 bars. Depending on its volume, range and volume density it will be assigned a state and colour. Low Volume – Minimum volume High Churn   – Significant volume with limited movement Climax Neutral –   High volume with unclear direction Climax Up   – High volume with bullish direction Climax Dn   – High volume with bearish direction Climax Churn – High vo
49 USD
Blahtech Moving Average
Blahtech Limited
4.5 (6)
Blahtech Moving Average indicator is a multitimeframe version of the standard Moving Average indicator. It is also enhanced with customisable alerts, period breaks and other configuration options. The 50 day and 200 day moving averages are widely followed by investors and traders, with breaks above and below the MA lines considered to be signals of interest. Links [  Install  |  Update  |   Training   |   All Products  ] Feature Highlights Up to three timeframes Configurable calculation variab
FREE
筛选:
Nicolas Dobrovsky
609
Nicolas Dobrovsky 2023.08.21 17:26 
 

Great indicator, I used it on MT4. I have been using it on MT5 for a few months now, the advantage of MT5 is more time frames (H2,H3 etc)

Denis Sokolovsky
414
Denis Sokolovsky 2023.06.25 21:39 
 

thank you :)

smhczd
54
smhczd 2022.12.29 21:30 
 

At first I rented the indicator for 1 month to understand how it's working and see if it really gives what it promises, I watched the youtube video several times to get the most of it and after 1 month of trial with various settings, I got convinced that it really helps with your trading, and just to be %100 sure I rented it for another 3 months and I in this period I have been testing the indicator and my knowledge about it on demo and have seen wonders :) so now I can say that it is really perfect for the ones who are looking for supply & demand indicator (which is actually the basics of technical analysis no matter if you're a scalper or day/swing trader) and as my period ends I will definitely buy it . Especially if you're working with several instruments, it just makes wonders that all you need to do is check the supply & demand areas (especially nested ones with higher timeframes) and set alarms on or close to those levels and check how the price is approaching those levels. I tried hundreds of free and paid indicators in 3 years of trading life and I can say that this is literally a good indicator which eases your trading process because as all of us know indicators are not the basics of trading but if you know how to use them properly, they may lessen your workload in great extent and make a real contribution to your trading adventure. It is so obvious that Dee and her team literally knows what trading is and their product is no bullshit but just a real working tool that came up at the end of a scientific research & development (as an engineer I can see it clearly:). To sum up, if you are looking for a supply & demand indicator, just try it at least for 1 month . Try to understand fully how it works, especially the backtest mode is perfect for it and I am pretty sure that you'll get the benefits that you've been looking for. Thank you Blahtech !

RiaB
59
RiaB 2022.11.14 21:07 
 

I've been using this indicator for over a year and can definitely recommend this reliable and effective tool showing high probability zones on multiple timeframes. Other functionalities include detailed info on the zones and their strength, trend indicator and backtesting mode.

boxtrader
66
boxtrader 2022.06.25 21:44 
 

Amazing tool to identify Supply & Demand levels on any chart timeframe. Tremendous flexibilty in configuring alerts and display options. Found an issue with duplicate alerts in a previous version and Blahtech quickly resolved for me. Would definitely recommend!

Frank Paetsch
7002
Frank Paetsch 2022.01.24 10:56 
 

simly good

MAKARIOS YACOUBIAN
2838
MAKARIOS YACOUBIAN 2022.01.16 10:22 
 

one of the best coded system , many choices to adjust your zones . i will defiantly give 5 stars from experience trader to experience developer

47358640
24
47358640 2021.06.16 23:59 
 

I liked the app when I tested it on my demo account so I went ahead and bought it to use once I opened a “real” account. Unfortunately the MT5 platform is not very user friendly and it is very poor when it comes to customer support so I have not been able to fund my “real” account or link it to my other brokerage accounts like they say you are supposed to be able to do, so I can’t give a good review. My issue is more with MT5 and MQL5 than with Blahtech.

musashi69
24
musashi69 2021.05.22 16:03 
 

For all the bells and whistles the training and documentation fall well short of easy or intuitive use. I try to figure things out on my and then go for help if I need it. Even after I go to the manual I can't get some features to work or be altered as they do in the video. They manual should have enhanced screen captures which show what they are talking about and show changes. Not just pages of insufficient text.

EdiF
170
EdiF 2021.05.19 08:04 
 

One of the few high level Indicators.

Alief Nurtendron
123
Alief Nurtendron 2020.12.01 06:04 
 

plis help, how to lunc this indicator, i am beginner and can not use this, the botton of lunch indicator was gone

Scott Moore
34
Scott Moore 2020.09.27 17:40 
 

It works great with the relevant theory. Already back tested it with more recent market moves. I was specifically hoping it would work with S&P 500 and it aligned perfectly with the setups I was looking at. Coupled with market profile and specific setups it saves me time doing the math and charting points. Worth the money in my humble opinion.

arti90
52
arti90 2019.02.11 14:52 
 

its a brilliant indicator when u get a little bit used to it and understand it. good one its the money worse.

faithdefender
1617
faithdefender 2019.01.23 00:52 
 

I was not too impressed with this supply/demand indicator. It appears it may have been developed with Online Trading Academy's "program" in mind. (A very expensive course that didn't help me) The idea that a drop base drop or a rally base rally equates into a S/D zone is silly. These same DBD RBR can and often are developed by price imbalances. I even heard the proverbial "don't diddle in the middle" saying that runs rampant through the $$ OTA course. Nevertheless, this indicator carries with it the idea that these S/D pointed out by the indicator could be areas where Bank Institution left orders. The same sentiment taught by OTA. I have used the indicator and I have yet to have the "Big Banks" helping my trades. The key pad should be memorized because you depend upon the alphabet to learn how to use the indicator. Too many bells and whistles. I gave it a three because it does provide Supply/Demand levels, but nothing more than other indicators.

Jair Miranda
176
Jair Miranda 2017.04.27 05:35 
 

I bought it wrong, I thought this was for metatrader 4, there is no way to return the money so I can buy the correct one.

Even though I downloaded and installed metatrader 5 and put this indicator and it does not work for anything, it is in the browser, but it does not go to the graph

回复评论
版本 4.0 2022.05.12
- Overall Trend - Add "Three In A Row" option to highlight trend when all three timeframe trends align
- Hotkeys - Zone Visibility - With Trend - Hide zones with unknown trend status
- Alerts - Zone Visibility - Alow user to filter visibility independent of the display hotkey setting
版本 3.9 2022.04.11
- New Alerts - Stop excessive alerts being generated when multiple timeframes are active
版本 3.8 2022.02.07
- Block invalid alerts that were triggered when broker resets data feed
- Improve level tooltip texts to always include nested info
- Summary Panel - Add parameter Trend Show Consolidation Dots
- Summary Panel - Rename parameter Engulfings - Stop Loss to Engulfings - Viable Size
版本 3.7 2021.05.05
Enhancements
- Timeframes - Add new timeframe options - Current Plus One / Two / Three
- Profiles - Add parameter "Clear Hotkeys On Terminal Close" to improve profile switching on MT5
- Offline Charts - Add support for offline charts and backtest tools with missing market data and unsynced current time

Fixes
- Summary Panel - Q Points - Improve accuracy of real time updates
- Summary Panel - Q Points - Ensure text is positioned correctly in the center of the box
- Trend Change - Incremental - Check that BarNum >= MinBarsOldZones
- Mouse Events - Keep CHART_EVENT_MOUSE_MOVE enabled if other indicators are waiting on mouse events
版本 3.6 2021.04.20
Enhancements
- MT5 - Add support for extended timeframes
- Trend Worm - Add option to display Trend Worm and/or Consolidation Worm on the chart
(Due to a platform issue, MT5 users may need to re-attach the indicator to see the Trend Worm)

Performance
- Clear Hotkey - Improve performance of clear chart calls
- Redraw - Remove ObjectsDeleteAll calls that slow other indicators with many objects
版本 3.5 2021.04.02
Fixes
- Summary SupDem - Apply Filters to SupDem column
- iCustom - Apply Filters to iCustom buffers
- iCustom - Improve Blahtech Expert Advisor Examples
- Alerts - Add MinBarsLevel and PriceAway filters to alerts
- Overall Move - Fix edge case where Overall Move wasn't being calculated correctly
版本 3.4 2021.03.24
Enhancements
- Enable filters whenever an individual filter is changed in the GUI
- iCustom - Refactor EA code examples into class to support cleaner multiple instances

Fixes
- Summary SupDem - Improve highlighting of overlapped zones
- Consolidations - Fix edge case when near MaxBars
- Allow user to configure Timeframes 1-4 in any order
- Allow experts to operate on higher timeframes than the current chart period
- Change format of diff files to support iCustom development
- Only populate iCustom buffers if they are enabled and used
- Change position of Overall Move filter to the top half of the GUI
版本 3.3 2021.03.08
Enhancements
- Summary Trend - Display dot next to the trend direction when recent bars are consolidating
- Filters - Add Max Levels filter to allow the user to restrict the number of levels on the chart
- Zone Highlight - Add parameter to change highlighting mode (None/Strength/Untouched)
- Parameters - Write simple list of changed parameters to experts log when Ctrl+Q keys are pressed
- Parameters - Create detailed report of changed parameters in Files/Blahtech directory to assist users and support

Fixes
- Q Points - Add Min Risk Reward parameter
- Trend Change - Add Min Range and rename Min Risk Reward parameters
- Overall Trend Alerts - Print all three timeframe directions in alert message
- Summary SupDem - Improve highlighting accuracy with overlapped zones
- Old Zones - Enable detection of old zones with just two bars
- Consolidation - Fix edge case in consolidation zones detection
- Hotkeys - Revert regression from 3.1 release where [ and ] were swapped round
- Expert Advisor Mode - Change to a single option named "Reserved For iCustom Calls"
版本 3.2 2021.01.20
Enhancements
- Alerts - Add parameter "Filter Nested (Levels)" to control raising alerts for nested zones only
- Alerts - Add parameter "Trigger Alerts Early" to trigger touch/break alerts N points before the level
- Hotkey Panel - Add "Alerts Nest" button to allow user to modify the nested zone filter from the GUI
- Summary - Alerts panel - Add icon next to title to show "Trigger Early Alerts" points value
- Summary - Alerts panel - Improve alerts icon tooltips
- Touches - Increase accuracy of Touches and add optional Touch/Untouch points parameters
- Info - Add parameter to control the precision of the {lots1} substitution string
- Info - Add a second user custom format string

Fixes
- Alerts - Fix edge case where duplicate alerts could be raised
- Alerts - Remove overlaps from Retouch alerts and apply filters to New alerts
- Alerts - Don't raise alerts for levels hidden from display by the "Zone Visibility" parameter
- Alerts - Improve text format, add bid price and number of touches
- Trend Change - Modify trend change parameter to OVERLAP_ALL to improve consistency of trend reversals
- Summary Panel - Improve accuracy of summary panel when price retraces from touched levels
- Summary Panel - Optimise summary panel redraw to compensate for increased accuracy
- HotKey Panel - Adjust panel Y location when position changed to Bottom left/right
版本 3.1 2019.10.17
- Enable left mouse click actions on Hotkey panel when keys have been reserved
版本 3.0 2019.10.09
Enhancements
- Add a third mode to the Summary panel GUI to control all alerts
- Alow user to set individual alert timeframes for Trend, Engulfings, QPoints and Levels
- Allow M30,H4,D1 as well as 1,2,3 when setting alerts timeframe parameters
- Enable Summary Timeframe Bubble Numbers by default
- Add bubble numbers to QPoints and SupDem columns in the Summary panel
- Add option to adjust the zone start bar of a level to the begining of a consolidation
- Add Timeframe hints to the TF section of the Hotkey panel
- Add {lots3} option to Info format

Fixes
- Change default colour of QPoint 2 from MediumOrchid to PaleVoiletRed
- Change Invert Style and colour parameters to be more intuitive
- Change text colour of oversized Q Points on the chart to Gray
- Change Summary heading from TimeF to Time
- Improve the behaviour of the Q Points hotkeys
- Modify all lines drawn by the indicator to be unselectable
- Include first bar in search for max move away of zones and Q Points
- Reset hotkey settings when indicator is removed from chart or chart is closed
- Only call TerminalInfoInteger to get ctrl status when key pressed or object clicked
版本 2.9 2019.07.16
Fix issue when backtesting beyond Max Bars
版本 2.8 2019.06.19
Enhancements
- Add options to draw multi timeframe Q Points on the chart
- Add GUI tab within HUD panel for control of filter parameters
- Add extra filters for Nested Levels, Zone Size and Min Price Away
- Change default values for live filters to disabled
- Add option to choose method for Zone Height calculation - Default/Whole Body/Entire Candle
- Add parameters to limit zone height "Zone Height Min" and "Zone Height Max"
- Add iCustom Buffers for QPoint 1 Top Bar and QPoint 1 Bot Bar
- Add option to display Total Move in custom format
- Left clicking any description in the Hud Panel now resets the value back to its input parameter version

Fixes
- Change defaults to display more features on chart at startup
- Check UserTickSize to stop divide by zero error
- Check for empty iCustom buffer
版本 2.7 2018.05.30
Enhancements
- Option to disable highlighting of Strong Zones
- Option to use Current Timeframe only for Overall Trend
- Parameter to change corner anchor of Summary Display
- Added Sup/Dem button to show only supplies or demands
- Added filter for number of retouches
- Added filter for levels that were formed by engulfing pattern
- Added filter for max price away
- Added filter for age of old zones in bars
- Support alerts for trend changes
- Support alerts for overall trend changes
版本 2.5 2017.08.29
Enhancements
- Support alerts for QPoint touches and breaks
- Support alerts for up to 3 timeframes
- Support inverted zone styles for the multi timeframe display
- Remember hotkey states when restarting terminal
- Support iCustom calls with 64+ parameters by using a set file

Changes
- Add tooltips to nested zone graphics
- Add reserved keys parameter to prevent clashes with other products
版本 2.4 2017.07.21
- Rebuilt with MetaEditor 1629 compiler to support MetaTrader cloud
- Add tooltips to Hotkey display
版本 2.2 2017.04.06
Enhancements
- Support additional timeframes
- Support alerts for engulfings
- Draw zones one bar back if the conterminous line originates there
- Changed colour and font of QPoints label when range greater than 15x average size
- Separated old and active filters to simplify usage
- Added advanced iCustom buffers for timeframes two and three
- Added second demo mode to show extra timeframes
= Summary Panel
- Support clicking on timeframe values to show/hide zones
- Support clicking on QPoint values to change focus
- Disabled highlighting of QPoint value in pink/blue when range is less than 15x average range
- Modified highlighting of SupDem values to only use pink/blue
= Hotkeys
- Reversed the order of hotkey changes when "Shift" key is pressed
- Nudge both start and end of zones one bar forward when "X" key is pressed

Fixes
- Remember the QPoint timeframe set by the user when switching chart timeframes
- Fixed the average bar size to match version 1.0 values (regression bug)
- Rebuild with latest compiler for MetaTrader platform changes
- Changed all global variables to be constant expressions
版本 2.1 2017.01.19
Fixes
- Resolved issues with iCustom calls

Performance
- Reduced overhead each tick to optimise Expert Advisor performance
- Added Expert Advisor mode to skip creation and drawing of objects