Parabolic Sar Buy Sell
- Индикаторы
- Magdalena Estefania Colonna
- Версия: 1.3
- Активации: 5
📊 Parabolic SAR Buy Sell Premium
🔍 Overview
The Parabolic SAR with Arrows is a custom technical indicator developed for MetaTrader 5 that combines the power of the classic Parabolic SAR with clear visual buy and sell signals. This indicator is designed for traders looking to quickly and visually identify trend reversals.
⚙️ Key Features
🎯 Visual Elements
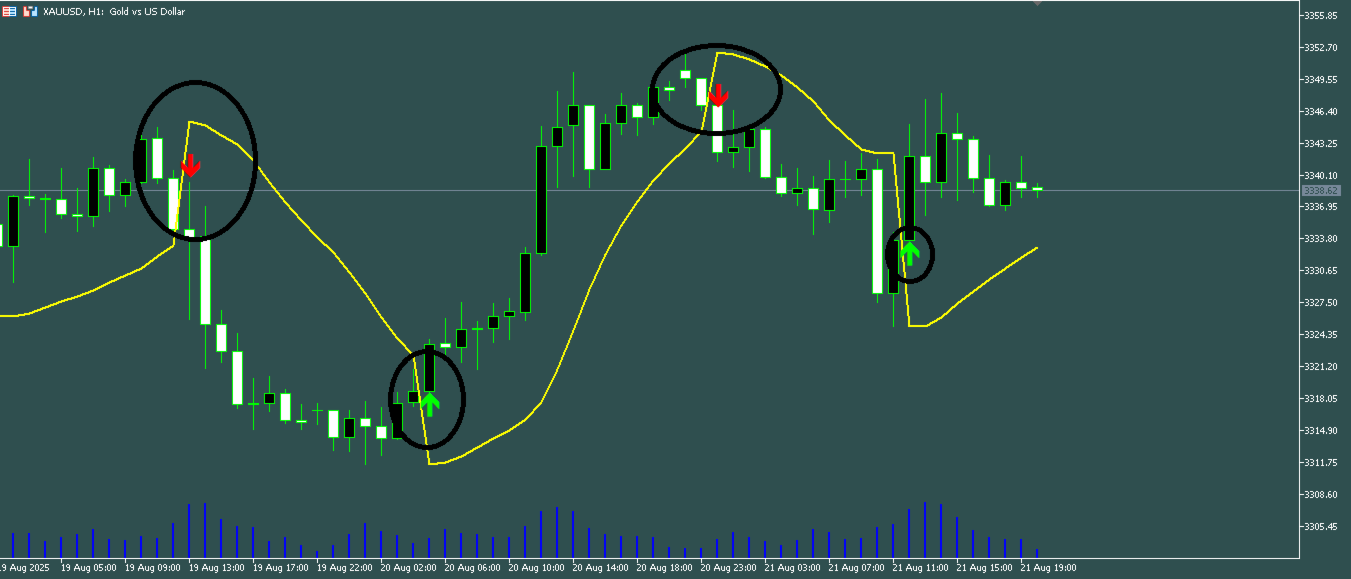
SAR Line: Dotted yellow points that follow the price
Buy Arrows: Green arrows (↑) that appear when the price breaks above the SAR
Sell Arrows: Red arrows (↓) that appear when the price breaks below the SAR
🛠️ Configurable Parameters
Initial Step (InpSarStep): 0.02 by default - Controls the initial sensitivity of the SAR
Maximum Step (InpSarMaximum): 0.20 by default - Limits the maximum acceleration of the SAR
🎲 How It Works
Indicator Logic
SAR Calculation: Uses the MT5 native iSAR() function to calculate parabolic points
Trend Detection: Compares the SAR position with the closing price
SAR below the price = Uptrend
SAR above the price = Downtrend Bearish
Signal Generation: Detects trend changes and places arrows automatically
Trading Signals
🟢 Buy Signal: When the price breaks above the SAR (change from bearish to bullish)
🔴 Sell Signal: When the price breaks below the SAR (change from bullish to bearish)
📈 Indicator Advantages
✅ Key Benefits
Simplicity: Clear and easy-to-interpret signals
Noise-free: Does not generate annoying audible alerts
Compatibility: Respects your MT5 custom colors
Efficiency: Low system resource consumption
Versatility: Works on all timeframes and symbols
🎯 Ideal Use Cases
Trend Following: Identify the start of new trends
Signal Confirmation: As an additional filter with other indicators
Intraday Trading: Especially effective on medium timeframes (M15, H1, H4)
Swing Trading: Capture movements of various days
⚙️ Recommended Settings
Initial step: 0.02 (standard for most markets)
Maximum step: 0.20 (balance between sensitivity and stability)
Timeframes: M15, H1, H4 for best results
📊 Signal Interpretation
🟢 Buy Signal (Green Arrow)
Appears when the price closes above the SAR after being below it.
Indicates the possible start of an uptrend.
Consider a long entry with a stop loss on the SAR.
🔴 Sell Signal (Red Arrow)
Appears when the price closes below the SAR after being above it.
Indicates the possible start of a downtrend.
Consider a short entry with a stop loss on the SAR.
🚀 Conclusion
This indicator is a valuable tool for traders looking for a systematic approach to identifying trend reversals. Its visual simplicity and lack of noise make it ideal for both beginners and experienced traders who value clarity in their technical analysis.