Смотри обучающее видео по маркету на YouTube
Как купить торгового робота или индикатор
Запусти робота на
виртуальном хостинге
виртуальном хостинге
Протестируй индикатор/робота перед покупкой
Хочешь зарабатывать в Маркете?
Как подать продукт, чтобы его покупали
Платные технические индикаторы для MetaTrader 4 - 63
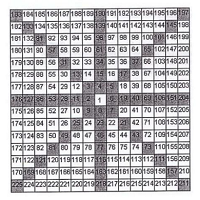
Индикатор уровней поддержки и сопротивления. Уровни рассчитаны согласно диагонального и кардинального креста квадрата Ганна.
Расчет происходит относительно текущей цены или относительно цены заданной пользователем в настройке Price.
Так же, в расчете можно использовать часть ценообразующей при помощи настроек Digit и minus_znak.
Например: текущая цена имеет вид - 1.23456, и настройка Digit установлена _5____ , значит в расчете будет
участвовать число 23456,
для _6____ будет число 123456

Индикатор Muvi2A- очень прост в понимании. Данный индикатор имеет принцип силового показателя. В данном случае сила тренда покупателей и продавцов в зависимости от построения графика показана графически и на скриншоте виден к примеру тренд вск ( тоеть покупки) Свечи находятся выше графических силовых показателей. Аналогично и с продажами. Дополнительно в индикаторе прописан сигнал на покупку или продажи в виде стрелок. Индикатор силового типа. Протестируйте его в тестере для убеждения тог

Индикатор-информер сообщает о резком изменении цены выбранного финансового инструмента. Также учитываются характеристики «японских свечей» (соотношение «тень»/«тело» в процентах) и «перепроданность»/«перекупленность» (по индикатору RSI - вызывается как подпрограмма: график не рисуется - если нужно, подключите график вручную). Пороговые значения задаются параметрами (менять можно "на ходу" сколько угодно раз). Сообщает на экран, на электронную почту и мобильное устройство: телефон/планшет (на
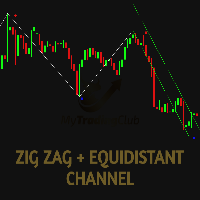
The MTC Equidistant Channel indicator is a helping tool for the traders who use: The supports and resistances lines; The trends; Fibonacci levels; It's a combination between the ZigZag indicator and the Equidistant chanel, It helps to detect the break-outs in many strategies and shows the possible entry points. The indicator capabilities : Drawing the Equidistant chanel automatically on the ZigZag indicator. The possibility of changing the ZigZag indicator settings. The indicator works on all ti

Parabolic Predictor — это мощный технический индикатор, предназначенный для определения точных тенденций и фильтрации традиционных сигналов Parabolic для прогнозирования уровней входа и выхода из рынка. Благодаря передовым методам этот индикатор предлагает точную визуализацию направления тренда, оптимальных уровней входа и уровней тейк-профита прямо на графике. Кроме того, он оснащен системой быстрого оповещения, которая отправляет уведомления по мобильному телефону, электронной почте и всплыв

This indicator Pluuto Alert Pro indicator.Indicator displays trend movement. Indicator calculates automatically line.Alert = (FiltPer1,Line1_Arrow).When the alert is up the next alert is down,when the alert is down the next alert is up (new bar). Features FiltPer1 - displays indicator period.Per1 FiltPer2 - displays indicator period.Per2. FiltPer3 - displays indicator period.Per3. Multiplier1_per1 - displays indicator multiplier.(FlitPe1,step) Multiplier2_line1 - displays indicator multiplier.(L
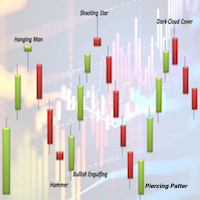
The DYJ CandleShape contains 80 candlestick Patterns, such as MORNING STAR, DOJI STAR, HARAMI CROSS,INVERT HAMMER,ENGULFING..... candlestick is a valid form of market technical analysis. The recommended short stoploss is near the highest price of the first three to five candles The recommended long stoploss is near the lowest price of the first three to five candles Input InpCandShapeMaxBars = 100. InpAlert = true -- Enable. Alert InpColorBull = clrGold

The background trend is an indicator that helps us to know the trend that is dragging the market. The indicator has 2 possibilities: 1) If the indicator is above zero the trend is buying and the indicator will be green.
2) If the indicator is below zero, the trend is selling and the indicator will be red.
You can download the demo and test it yourself.
The indicator has a text help in the upper right corner, in which it shows whether the indicator has a bullish or bearish background trend

Индикатор разворота тренда, без перерисовки. Чистая и легкая визуализация Нет альтернативного сигнала на покупку-продажу без учета тренда. Возможность фильтрации шума. Работает на всех парах.
Идеально подходит для начинающих и опытных трейдеров Лучше всего использовать на таймфреймах выше М30, с начала Лондонской сессии и до Америки.
Следует помнить, что не существует индикаторов, которые не ошибаются. Любая стратегия требует подтверждения своих сигналов. При построении своей собственной с

Индикатор LTS для MT4 (Level + Trends + Speed)
Индикатор LTS был создан для быстрого анализа консолидаций на графике , существенно облегчающий принятие решений при торговле. LTS выделяет точки напряжения и дает информацию о силах, влияющих на него, а так же текущую скорость и средний ход. Индикатор легко настраивается под любой стиль торговли и может анализировать любой таймфрейм. LTS использует уникальный алгоритм анализа трендов по 4м параметрам от глобального до локального.
Настрой

Индикатор поддержки и сопротивления для бинарных опционов Этот индикатор разработан специально для торговли бинарными опционами и отлично показывает откаты от уровней поддержки и сопротивления. Сигналы появляются на текущей свече. Красная стрелка, направленная вниз, указывает на потенциальную возможность продажи, а синяя стрелка, направленная вверх, предлагает возможности для покупки. Все, что вам нужно настроить, это цвет сигнальных стрелок. Рекомендуется использовать его на таймфреймах M1-M5,
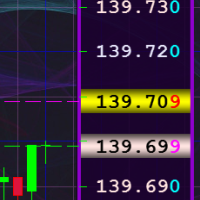
Индикатор предназначен для замены стандартной вертикальной ценовой шкалы, расположенной с правой стороны в окне графика клиентского терминала, на более удобную ценовую шкалу с возможностью детальной настройки параметров отображения этой шкалы. Кроме этого, индикатор позволяет делать фоновую заливку окна графика любым изображением по желанию пользователя и двухцветную сетку с элементами её тонкой настройки. В первую очередь, индикатор будет полезен трейдерам, обладающим не самым лучшим зрением,
Оригинальный трендовый индикатор Trrend Arrow,показывающий области покупок и продаж. С этим индикатором вам не нужно сидеть около компьютера и ждать появления точки перегиба днями и ночами.
Пользоваться индикатором очень просто. При появлении стрелки вверх, открывать сделку buy. При появлении стрелки вниз, открывать сделку sell.
Индикатор работает на всех таймфреймах и валютных парах. Индикатор желательно использовать в комплексе с другими инструментами для более достоверных сигналов и прин

LSM TrendReversal Pro Indicator is a ideal tool to identify detail and overall Trend and Supply/Demand Zones(Reversal) for scalping/day trading or swing trading. It has itself " MTF(Multi Time frame)" Trend filtering system in the indicator. 1. Easy Follow the Trend 2. Catch the Trend Reversal Area(Combined with " SupplyDemand Zones Indicator " ) 3. Supporting Entry/Exit Point (Trade Direction)
Basket Currency Strength indicator. Chart Symbols Changer. (Please see " LSM Basket Indicat

Расширенный расчет на основе чистого ценового действия для поиска прорывов LH и HL.
Это даст вам отличные точки разворота на рынке. Сигналы LH и HL также могут использоваться для прорывов трейнгла.
Когда происходит прорыв, это указывает на сильный разворот. Хороший фильтр для скользящих средних. Я настоятельно рекомендую использовать это с индикаторами тренда.
Может использоваться как дополнительное подтверждение для индикаторов поддержки и сопротивления, спроса и предложения.
Более по
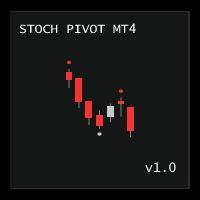
Stochastic Pivot draws a point on the chart at Stochastic overbought or oversold. During overbought periods, this indicator will draw the pivot point at the high of the highest candle and at the low of the lowest candle during oversold periods. NB : All pivots are updated 'on tick' and 'on any chart event' immediately Settings Name Description Upper Limit Set Stochastic Overbought Level
Lower Limit
Set Stochastic Oversold Level %KPeriod Set Stochastic K Period %DPeriod Set Stochastic D P

Одна из самых больших проблем, с которыми сталкиваются трейдеры, - это поиск подходящей для себя торговой системы. Индикатор Trend Op предсказывает наиболее вероятное краткосрочное движение цен на основе сложных математических расчетов. Этот индикатор создан для обнаружения тенденций движения цены и позволяет быстро определить не только направление тренда, но и понять уровни взаимодействия покупателей и продавцов. Он не имеет настроек и поэтому может быть воспринят так, как он сигнализирует.

The San Andres Fault is an indicator designed to detect the movements that make the market tremble. This system detects a tremor and marks its intensity in real time to decide in your operation. In addition, the recording of the sismic signal allows us to interpret movement patterns that help us in decision making You can download the demo and test it yourself.
The indicator has a text help in the upper right corner, in which it shows whether the indicator has a bullish or bearish b

GS trendS - трендовый индикатор, который можно использовать для любых финансовых инструментов Форекс. Индикатор не перерисовывается и не запаздывает. Рекомендуемый таймфрейм H1. Есть возможность выбора настройки алгоритмя тренда {Only Open, Average Open/Close, Average High/Low}
Цветом отображает направление тренда: желтый - направление может быть SELL или BUY (S_B)
синий - восходящий тренд (BUY)
красный - нисходящий тренд (SELL) На панеле индикатора отображаются значения тренда 5 таймфреймо
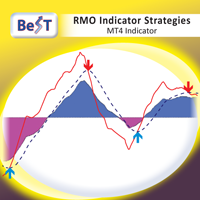
BeST_RMO Indicator Strategies is an MT4 Indicator that is based on the corresponding famous Oscillator created by Rahul Mohindar that detects trends in all markets and it can produce Buy and Sell Signals of high winning probability forming a complete and standalone trading system of impressive results.
The indicator uses 2 strategies as a selection: i) Classic : produces Reversed Entry Signals by the crossings of zero (0) line and ii) MAsSignals : produces Reversed Entry Signals using MAs of R

Индикатор Trend Hist предназначен для отображения на графике и визуальной оценки алгоритма трейлинга по внутренним барам.
Данный индикатор находит сильные трендовые движения валютной пары на заданном количестве баров, а также находит коррекцию к этому тренду. Если тренд достаточно сильный, а коррекция становится равной заданной в параметрах, то индикатор сигнализирует об этом.
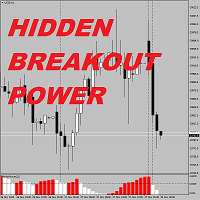
Hidden Breakout Power The market has a cycle, keeps on moving from: RANGE -> BREAKOUT -> TREND ->CONSOLIDATION ->RANGE RANGE and TREND The two major states, while the BREAKOUT refer to the short period of market breaking the range, CONSOLIDATION refer to the long consolidation of market and shrink to range. Usually oscillatory indicator performs well in RANGE states and perform poorly in trend state, while TREND indicator is the other way around, it performs will in a TREND states and but poor
This indicator's main objective is to be able to receive alerts whenever your support and resistance level have been touched and has the candle closed over the support/resistance level. It is a fairly simple indicator, all you need to do is place a horizontal line at where your support/resistance level is and whenever a candle touches and closes past the candle, you will receive an alert. Each line will generate two alerts per candle, once when the candle touches the line and once when it closes

Индикатор Trend Slow использует авторский алгоритм анализа поведения цены и отображает результат сложной работы в виде линий. Для простоты алгоритм автоматически меняет цвет линии согласно своему направлению.
В индикаторе присутствует параметр для включения подачи алертов при изменении цвета, таким образом помогая трейдеру определять новые тренды рынка.
Эта система поможет найти высоковероятностные сделки в направлении сильных трендов.

THE SOUND OF MARKET is an indicator designed to detect the sound produced for the market movement. This system detects the background sound produced by market movements in real time to decide in your operation. In addition, by analyzing the sound recorded in the indicator, we can detect operational patterns. You can download the demo and test it yourself.
The indicator has a text help in the upper right corner, in which it shows whether the indicator has a bullish or bearish backgro

Индикатор горизонтальных и вертикальных объемов. Предназначен для внутридневной и среднесрочной торговли (до Н4).Рассчитывается на основе тиковых или реальных объёмах (если их предоставляет брокер). Ценовой уровень, внутри свечи, на котором было максимальное количество сделок, выделяется цветом. Вертикальные объемы определяют паттерны Price Action (SonicR, BetterVolume) или импульсы (Enhanced) на выбор. Сочетание вертикальных и горизонтальных значений позволяет определить среднесрочные уровни по

Brief description
TrendWatch indicator analyze chart trend strength and acceleration. Analysis is based on close price SMA with configurable period. Result is given as set of two curves in the indicator window. Blue (default color) curve identify trend direction and strength. Yellow curve (default color) identify trend tendency to accelerate/deceleare. Scale of curves is normed to maximal value in given time period. Both curves can be additionally smoothed using configurable SMA and/or set to

Индикатор показывает смену тренда и как меняется рынок. При вычислении идет взвешивание многих параметров. Поэтому возможна дивергенция между графиком и индикатором. Входные параметры: IndicatorPeriod: несколько периодов рассчета (small - краткосрочный период, medium - среднесрочный, long - долгосрочный). Торговать можно по дивергенции, анализировать на линии сопротивления и поддержки (и другие виды графического анализа), в составе других индикаторов. Tags: Stochastic, Trend.

Формула индикатора: High-Low+Volume; Open-Close+Volume То есть попытка привести к общему знаменателю цену и объем.
Входные параметры:
IndicatorPeriod: несколько периодов рассчета (small-краткосрочный; medium-средний; long-долгосрочный период).
MnojitelLine, MnpjitelLine2 - домножение линий для сравнения.
AverageVolume - усреднение объемов для вычисления (нужно чтобы удалить зависимость от объемов). Если и индикатор и график делает резкий скачек, то ждем откат. Кроме того, анализироват

Индикатор представляет собой жесткий Moving Average, взвешенный по многим параметрам. Соответственно, торговать нужно по волатильности графика. В индикатор для удобства добавлены скользящие средние периодов High, Low, Median((High-Low)/2). Входные параметры: IndicatorPeriod(зеленая линия): несколько периодов (general-общий, вычисление по всем периодам; small-краткосрочный; medium-средний; long-долгосрочный) MaLine- сглаживание индикатора (Moving Average)(синяя линия). PeriodHigh, PeriodLow, Per

Important!! ZO Trend MTF can't work on MN and W1 timeframe. /*--------------------------------------------------------------------------------------------------------------------------------------------------------------------------------------------- ZO TREND : https://www.mql5.com/en/market/product/49138 ZO Trend MTF an indicator used to search for entry point. With the session candle algorithm on many timeframe, ZO Trend creates an area for traders find good Entry Point. ZO SYSTEM BASIC SET

Following trend indicator coached by Alina. This product made based by RSI and Oscillator. Another indicator to support this strategy will send to you free by whatsapp. Been tested this for over 3 years, over 60% winning rate. Support Eur Usd, Eur JPY , Nzd Usd, Xau Usd. Aud Jpy , Aud Usd , Eur Cad , Usd Cad , Usd Chf , Gbp Usd, Aud Cad , Aud Nzd. quality signals and can be used for everyday .
100% без перерисовки
Торговать можно на любом базовом активе. Наиболее благоприятным временем для работы считается Европейская, Американской сессии.
При появлении синей стрелки под свечой приобретается опцион ВВЕРХ. При появлении красной стрелки приобретается опцион ВНИЗ. Следует отметить одну особенность индикатора: сигнал образуется при открытии свечи, открывать сделку стоит этом баре Благодоря этому можно ефективно торговать бинарными опционами с манименеджментом мартингейл в 1 колено (ст

MOUNTAINS:It is an indicator that detects market consolidations prior to a movement.
The objective of this indicator is to indicate the areas before the market makes a move.
The areas that we are interested in detecting are the PLATEAU, which are between the slopes.
When the system detects a PLATEAU , the trader must place his operation in that area, waiting for the increase in volatility to reach its target.
The best option to carry out the operation of the PLATEAU is through covera

Данный индикатор значительно расширяет возможности привычного ЗигЗага благодаря добавлению параболических каналов на самой ранней стадии их зарождения.
Скачивайте демо версию и тестируйте его в тестере. Вся графика в тестере работает удовлетворительно.
Но алгоритм ЗигЗага здесь особый, т.к. он реализован на уникальном авторском сверхбыстром бесцикловом алгоритме расчета параболической регрессии и расчета ее среднеквадратического отклонения. Особенностями данного ЗигЗага являются: Быст
Pullback Probability It is an indicator that shows us the probability that the price will t urn around and we can operate that market turn.
The indicator marks a line that oscillates between a percentage of 0% to 100%.
The one indicated in the upper left corner shows us a help in which it informs us of the area in which the price is in real time, as well as the percentage that the candle is open. You can download the demo and test it yourself.
The indicator marks 6 work zones. 1) Ab

Скользящее среднее с уровнями, построенными на основе индикатора ATR. В отличие от обычных уровней с постоянным отклонением, которые можно добавить к Moving Average, в уровнях MA with ATR bands учитывается волатильность рынка. Основной вариант использования индикатора: покупать при пробое верхнего уровня, продавать - при пробое нижнего.
ПАРАМЕТРЫ MA_Period : п ериод усреднения скользящей средней MA_Method : м етод усреднения скользящей средней MA_Price : и спользуемая цена для скользящей сре
When the current candle is smaller than the previous candle but its volume is greater than the previous one, it means that the market maker is blocking the trend, means that it is in the process of (buying or selling). So when the price closes above that candle, we buy and if it closes below that candle we sell as well. Note that this candle becomes a strong zone as resistance or support. The indicator draws two lines on the divergence spread volume candle, you have to wait for the price to clo

Это инновационный индикатор измерения силы валют от INFINITY является незаменимым помощником для скальперов и трейдеров торгующих в долгую.
Система анализа Силы/слабости валют давно известна и применяется на рынке ведущими трейдерами мира. Любая арбитражная торговля не обходится без этого анализа.
Наш индикатор легко определяет силу базовых валют по отношению друг к другу. Он выводит линейные графики по всем или по текущей паре валют, позволяя проводить мгновенный анализ и поиск наиболее сил
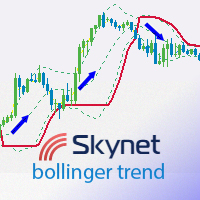
Данный индикатор отображает точки входа в рынок с помощью лент Боллинжера и точки выхода, которые определяются по заданному расстоянию в пунктах от точки входа. Линия индикатора выше цены говорит о медвежьем тренде. Если линия ниже цены, то на рынке присутствует бычий тренд. Информационная панель показывает результаты работы индикатора, чтобы можно было его настроить более точно и видеть, как параметры влияют на результат. Оповещение о точках входа и выхода приходит на телефон. Преимущества Пр

ВНИМАНИЕ — ИЗУЧИТЕ ОПИСАНИЕ! Применять только на валютной паре GBPUSD - H1. Данный индикатор ежедневно после закрытия 13-го бара определяет есть ли сегодня точка силы или нет. Если ее нет, индикатор ничего не нарисует, тогда этот день пропускаем. Если же уровень будет отображен, вам необходимо только наблюдать за дальнейшим движением цены. Чтобы сигнал предварительно был подтвержден важно, чтобы выполнились некоторые базовые условия в течение этого и максимум следующего дня, а именно: цена дост
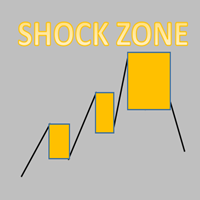
Every trading shock range is a point of gaining momentum!
The stop loss is generally the height of the shock zone.
Take profit depends on personal preference and market position. Generally at least double the height of the shock zone. Being in a good market position, it can have a profit-loss ratio of 5-10
Necessary for traders: tools and indicators Waves automatically calculate indicators, channel trend trading Perfect trend-wave automatic calculation channel calculation , MT4 Perfect
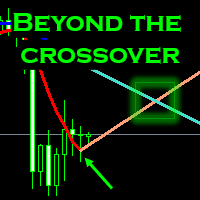
Do you want to anticipate to the crossover movements? Raise your change of success? With this program t he Crossovers can be anticipated before its appearance and thus get a better price. Developed a MA line that anticipated the crossovers and also it can be used for support and resistance level. Check in the backtesting and get the reversal at the beginning. Description MA beyond the crossover is an average price calculation over a certain time period causing a faster reaction b
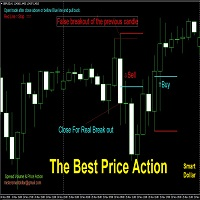
This price action is a very strong strategy, it is based on the fact that the price makes a false breakout of the previous candle and closes in the other side. which means that the area of the false breakout contains very powerful orders which push the price to turn in the other direction. the indicator helps you to choose the time frame for the price action and the minimum number of points for the area which is between the blue and red line. when the indicator gives an alert, it's time to wait
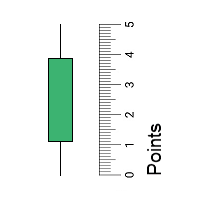
Индикатор отображает High-Low и Open-Close размеры свечей. Также по этим размерам можно построить простые скользящие средние. Линия скользящей средней строится по формуле: Линия MA = MA(Period) * Delta. Чтобы скрыть скользящую среднюю, достаточно установить ее период равным 0.
Чтобы собрать статистику по размерам свечей, используйте скрипт Candle Size Stats .
ПАРАМЕТРЫ Period_MA_HL: период усреднения скользящей средней, построенной по размерам High-Low свечей Delta_MA_HL: множитель для Hig

Genetic Code, is an indicator that differentiates two types of market: the market in range and the market with volatility.
This indicator allows the trader to choose whether to use a range trade or a volatility trade. You can download the demo and test it yourself.
When observing the trace of the indicator it shows us narrow areas that correspond to market ranges.
These ranges always end with a volatility process, so you can work with two conditional pending orders.
When the two DNA str

HAWA GOLD Advanced trading indicator with realistic pre-defined entry and exit levels with almost 80% win rate. The system focuses only Small and Steady Profits . It uses fixed stop loss for every signal to keep money management in place. As compare to other available indicators in market, HAWA gold has unique feature of displaying total profit and loss in terms of points where 1PIP=10points and Minimum profit is 10 pips. Its smart and advanced algorithm detects trend and trend strength usin

This is MT4 version of StochScanner It scans Stochastic from Multi Symbols and Multi Timeframes and displayed on the dashboard on a single chart. . 4 scanning modes: 1. Mode OverBought/OverSold Indicator scans Overbought and OverSold . OverBought : current stochastic is above level 80 and OverSold : current stochastic is below level 20 2. Mode Signal It means if the previous stochastic is on OverBought or OverSold ( either Main Line and Signal Line ) and the current Main Line cross over the curr

MA bounce LITE arrows is simplified version of main indicator MA bounce . It's for people who don't need to use all features of main indicator. Lite version shows only arrows on chart when there is high probability of price bounce from selected MA.
MA bounce LITE arrows input settings: Current MA period - period of moving average on current TF Current MA type - moving average calculation method on current TF Current MA applied price - applied price of moving average on current T
MA bounce LITE arrows is simplified version of main indicator MA bounce . It's for people who don't need to use all features of main indicator. Lite version shows only HTF line in short/long term opertion method.
MA bounce LITE htf line input settings: TD line source for calculation - choose if oscillators or price levels will be used as source for calculation TD line method (for oscillators source) - choose between long term and short term calculation Filter period (for oscillators source)

Индикатор RealCryptoLevels скачивая стаканы ордеров криптобирж с максимальной глубиной показывает горизонтальные объёмы популярных криптовалют выводя их на график, благодаря чему можно видеть не только сами объёмы, но и уровни и что не мало важно силу отображаемых уровней (смотрите скриншоты), что очень важно для успешной торговли по всем стратегиям от скальпинга до среднесрочной торговли, ведь можно видеть предпочтения покупателей и продавцов в настоящий момент и их настроения на будущее. Ин

DNA is an indicator that allows us to operate both in favor of a trend and a pullback. You can download the demo and test it yourself.
Trend trading is above zero and pullback trading is below zero.
The direction of the operation is marked by the color of the line.
If the line is green it corresponds to purchases.
If the line is red it corresponds to sales.
For example, if the green line is above zero and growing, we will have an uptrend operation. If the red line is above zero and

This indicator will create bars in 4 deference colors. The Green Bar is Up Trend. The Red Bar is Down Trend. Lite Green Bar is No Trend (corrective or sideway) but still in Up Trend. Pink Bar is No Trend (corrective or sideway) but still in Down Trend. You can just looking at the Bar's Color and Trade in Green Bar for Long Position and Red Bar for Short Position. You can change all the colors in your way.
1. Alert function : Will popup Alert Windows and play sound when the Bar was changed. 2.
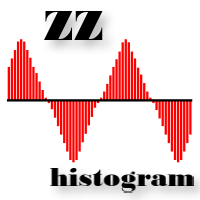
ZZ Histogram отображает длину и направление волны на ценовом графике. Минимальный размер волны задается в настройках. По своей сути данный индикатор - тот же зигзаг (можете скачать здесь ), который определяет ценовые волны не меньше определенной длины, но только в виде гистограммы. Это можно увидеть на скриншотах.
Для сбора статистики по размерам ценовых волн используйте идикатор Wave Size Stats .
ПАРАМЕТРЫ MinWaveSize: минимальная длина волны, на которую реагирует индикатор. Для маленьк
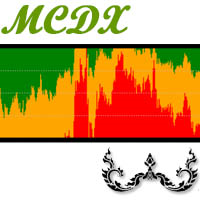
MCDX is an indicator based on specific formula to detect Buy and Sell momentum Red Bar means Price go up and Buy momentum. Green Bar means Price go down and Sell momentum" Height of RED bar > 50% means Bull is in control. i.e. RED more than GREEN to go buy. Lower of Green bar < 50% means Bear is in control. i.e. GREEN more than RED to go sell. DARKER RED COLOR - STRONG Up Trend or Strong Bullish Power
LIGHTER RED COLOR - WEAK Up Trend or Weak Bullish Power
LIGHTER GREEN COLOR - STRONG Down

DNA is an indicator that allows us to operate both in favor of a trend and a pullback. You can download the demo and test it yourself.
Trend trading is above zero and pullback trading is below zero.
The direction of the operation is marked by the color of the line.
If the line is green it corresponds to purchases.
If the line is red it corresponds to sales.
For example, if the green line is above zero and growing, we will have an uptrend operation. If the red line is above zero and

Индикатор AURUS Arrow предусматривает возможность выявления различных особенностей и закономерностей в динамике цен, которые не видны невооруженным глазом.
AURUS Arrow — индикатор, показывающий стрелки покупки-продажи, которые определенно помогут каждому трейдеру, который не знает как торговать.
На основании этой информации, трейдеры могут предположить дальнейшее движение цены и корректировать свои стратегии, соответственно.
Буферная стрелка покупки-продажи с сигнальным алертом.
Тайм-фре
Данный индикатор находит рыночные ситуации по типу "ложный пробой", "сложный ложный пробой" и "пробой уровня".
Настройки
SettingListMarket - В данном разделе гибко настраивается список торговых инструментов и фильтров.
ListOrMarketOverview - При false список инструментов используется из List_1...List_5, при true инструменты из обзора рынка. Forex - включает в список Forex инструменты. CFD - включает в список CFD инструменты. Futures - включает в список Futures инструменты. CFDOnIndexes - вк

TD Combo is better when you have sharp directional moves, because it requires only thirteen price bars from start to finish compared to TD Sequential which needs at least 22 bars. The criteria for a Setup within TD Combo are the same with those required for a Setup within TD Sequential. The difference is that the count starts at bar 1 of the setup and not from bar 9 and TD Combo requires four conditions to be satisfied simultaneously.
Requirements for a TD Combo Buy Countdown
- Close lower

The indicator scans for TD Combo signals in multiple timeframes for the all markets filtered and shows the results on Dashboard. Key Features Dashboard can be used for all markets It can scan for signals on MN1, W1, D1, H4, H1, M30, M15 ,M5, M1 timeframes Parameters UseMarketWatch: Set true to copy all symbols available in market watch MarketWatchCount : Set the number of symbols that you want to copy from the market watch list. CustomSymbols: Enter the custom symbols that you want to be availa

T D Sequential indicator consist of two components. TD Setup is the first one and it is a prerequisite for the TD Countdown – the second component.
TD Setup TD Setup compares the current close with the corresponding close four bars earlier. There must be nine consecutive closes higher/lower than the close four bars earlier.
1- TD Buy Setup - Prerequisite is a bearish price flip, which indicates a switch from positive to negative momentum.
– Af

The indicator scans for TD Sequential signals in multiple timeframes for the all markets filtered and shows the results on Dashboard. Key Features Dashboard can be used for all markets It can scan for signals on MN1, W1, D1, H4, H1, M30, M15 ,M5, M1 timeframes Parameters UseMarketWatch: Set true to copy all symbols available in market watch MarketWatchCount : Set the number of symbols that you want to copy from the market watch list. CustomSymbols: Enter the custom symbols that you want to be a

PinTouch indicator calculates and draws high-probability direction Entry points with arrows. Moving Averages are applied as the direction filter and visualised at the chart.
To identify Exit points is recommended to use one of these options:
1. The nearest levels calculated by the PivoZone Indicator under the link: https://www.mql5.com/en/market/product/57066
2. Reversal signal
3. Calculated by RR-ratio 4. Of course, your options (post me a message)

Многофункциональный индикатор уровней IRES – это мощный профессиональный инструмент для определения уровней поддержки и сопротивления на финансовом инструменте. Эффективность индикатора доказана тысячами тестов на реальных и демонстрационных счетах. Индикатор, работающий на реальных данных с использованием живой настоящей статистики.
Индикатор поможет торговать сетями или же одиночными ордерами, имеется алерт, можно выбрать настройки индикатора именно под себя, под свою систему.
Группа вк

Indicator that alerts by push notification to the mobile phone or by alert on the platform of the touch of the candle with the selected average. The alarm can be set to receive "x" seconds before the candle closes. Specially suitable for those who cannot or want to spend a lot of time in front of the screens to see a movement start from a moving average and therefore miss the movement. You can configure any average method and the time to receive the alert before the candle closes.
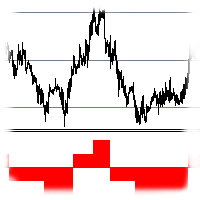
Индикатор показывает количество и направление переходов цены между уровнями сетки. Шаг сетки устанавливается в настройках. Индикатор будет особенно полезен трейдерам, торгующим по Мартингейлу, как инструмент для определения оптимальной точки входа.
ПАРАМЕТРЫ Step: размер шага сетки (например: step = 50, shift = 0, тогда уровни будут иметь значения ...1.1050, 1.1100, 1.1150...) Shift: сдвиг сетки (например: step = 50, shift = 25, тогда уровни будут иметь значения ...1.1075, 1.1125, 1.1175...)
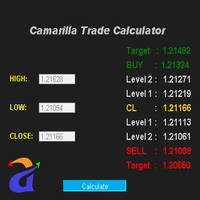
Advanced Camarilla Calculator is one of the most commonly used trading calculators. This calculator can be used to generate levels. Scenario 1 Open price is between H3 and L3 For Long - Wait for the price to go below L3 and then when it moves back above L3, buy. Stop loss will be when price moves below L4. Target1 - H1, Target2 - H2, Target3 - H3 For Short - Wait for the price to go above H3 and then when the price moves back below H3, sell. Stop loss will be when price moves above H4. Targe
Super Oscillator , is a powerful indicator that vibrates along with the market, resulting in a very useful tool to improve and decide your trading.
You can download the demo and test it yourself.
In a versatile indicator that in a single graph shows us information about four different aspects of the market
1) 4 operational zones. The indicator divides the screen into 4 zones that allows us to properly assess the moment of the market. a) Pullback Buy Trend. If the indicator is above 80,
Multi Trend Analyzer MT4 indicator provides signals from the following technical trading indicators: RSI, STOCH, STOCHRSI, MACD, ADX, Williams % R, ATR, Oscillator, ROC and Bull/Bear Power. It supports all time frames, from the 1 minute up to the monthly charts. You can change all indicator inputs. Indicator provide total trend summary. We can easily analysis and study market movement .
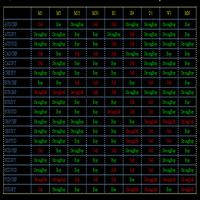
MACD MULTI TIME FRAME WITH MULTI SYMBOLS INDICATOR MACD MTF Indicator visualize all MT4 time frame and trend based on Moving Average Convergence Divergence (MACD) strategy . Indicator have settings for MACD customizing and variable "Symbols "EURUSD,USDCHG,...", which is used to define symbols. , Signals are displayed Buy , Strong buy , Sell, Strong Sell, ### - No Trend Strong Description The Moving Average Convergence/Divergence indicator is a momentum oscillator primarily used to tr
А знаете ли вы, почему MetaTrader Market - лучшее место для продажи торговых стратегий и технических индикаторов? Разработчику у нас не нужно тратить время и силы на рекламу, защиту программ и расчеты с покупателями. Всё это уже сделано.
Вы упускаете торговые возможности:
- Бесплатные приложения для трейдинга
- 8 000+ сигналов для копирования
- Экономические новости для анализа финансовых рынков
Регистрация
Вход
Если у вас нет учетной записи, зарегистрируйтесь
Для авторизации и пользования сайтом MQL5.com необходимо разрешить использование файлов Сookie.
Пожалуйста, включите в вашем браузере данную настройку, иначе вы не сможете авторизоваться.